MPAndroidChart开源图表库---折线图
2015-08-11 20:42
691 查看
项目地址:点击打开,原文参考地址:点击打开
1. 将mpandroidchartlibrary-2-0-8.jar包copy到项目的libs中
2. 定义xml文件
3. 主要Java逻辑代码如下,注释已经都添加上了。
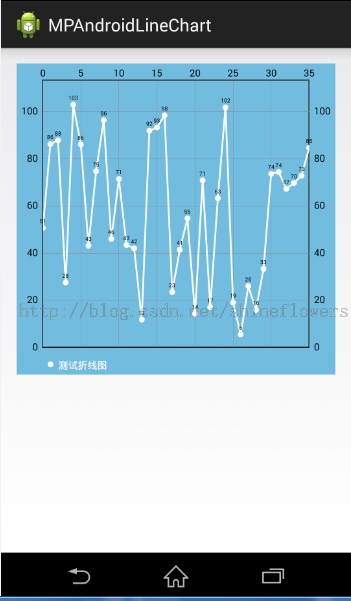
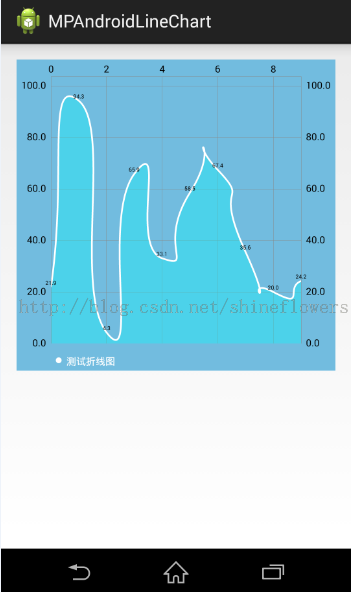
效果图借用原文中的图片:
1. 将mpandroidchartlibrary-2-0-8.jar包copy到项目的libs中
2. 定义xml文件
<?xml version="1.0" encoding="utf-8"?>
<LinearLayout xmlns:android="http://schemas.android.com/apk/res/android"
android:layout_width="match_parent"
android:layout_height="wrap_content"
android:orientation="vertical" >

<com.github.mikephil.charting.charts.LineChart
android:id="@+id/chart"
android:layout_width="match_parent"
android:layout_height="200dp" />

</LinearLayout>
3. 主要Java逻辑代码如下,注释已经都添加上了。
package com.example.sensorchart;

import java.util.ArrayList;

import android.app.Activity;
import android.graphics.Color;
import android.os.Bundle;
import android.view.Menu;
import android.view.MenuItem;

import com.github.mikephil.charting.charts.LineChart;
import com.github.mikephil.charting.components.Legend;
import com.github.mikephil.charting.components.Legend.LegendForm;
import com.github.mikephil.charting.components.XAxis.XAxisPosition;
import com.github.mikephil.charting.data.Entry;
import com.github.mikephil.charting.data.LineData;
import com.github.mikephil.charting.data.LineDataSet;
import com.shelwee.uilistview_demo.R;

public class LineChartShow extends Activity {
private LineChart mLineChart;

@Override
protected void onCreate(Bundle savedInstanceState) {
super.onCreate(savedInstanceState);
setContentView(R.layout.line_chart);
mLineChart = (LineChart) findViewById(R.id.spread_line_chart);

// mTf = Typeface.createFromAsset(getAssets(), "OpenSans-Bold.ttf");
}

@Override
protected void onStart() {
// TODO Auto-generated method stub
LineData mLineData = getLineData();
showChart(mLineChart, mLineData, Color.rgb(114, 188, 223));
super.onStart();
}

// 设置显示的样式
private void showChart(LineChart lineChart, LineData lineData, int color) {
lineChart.setDrawBorders(false); // 是否在折线图上添加边框

// no description text
lineChart.setDescription("");// 数据描述
// 如果没有数据的时候,会显示这个,类似listview的emtpyview
lineChart
.setNoDataTextDescription("You need to provide data for the chart.");

// enable / disable grid background
lineChart.setDrawGridBackground(false); // 是否显示表格颜色
lineChart.setGridBackgroundColor(Color.WHITE & 0x70FFFFFF); // 表格的的颜色,在这里是是给颜色设置一个透明度

// enable touch gestures
lineChart.setTouchEnabled(true); // 设置是否可以触摸

// enable scaling and dragging
lineChart.setDragEnabled(true);// 是否可以拖拽
lineChart.setScaleEnabled(true);// 是否可以缩放
lineChart.getAxisRight().setEnabled(false); // 隐藏右边 的坐标轴
lineChart.getXAxis().setPosition(XAxisPosition.BOTTOM);//设置横坐标在底部
lineChart.getXAxis().setGridColor(Color.TRANSPARENT);//去掉网格中竖线的显示
// if disabled, scaling can be done on x- and y-axis separately
lineChart.setPinchZoom(false);//

lineChart.setBackgroundColor(color);// 设置背景

// add data
lineChart.setData(lineData); // 设置数据

// get the legend (only possible after setting data)
Legend mLegend = lineChart.getLegend(); // 设置比例图标示,就是那个一组y的value的

// modify the legend ...
// mLegend.setPosition(LegendPosition.LEFT_OF_CHART);
mLegend.setForm(LegendForm.CIRCLE);// 样式
mLegend.setFormSize(6f);// 字体
mLegend.setTextColor(Color.WHITE);// 颜色
// mLegend.setTypeface(mTf);// 字体

lineChart.animateX(2500); // 立即执行的动画,x轴
}

/**
* 生成一个数据
*
* @param count
*            表示图表中有多少个坐标点
* @param range
*            用来生成range以内的随机数
* @return
*/
private LineData getLineData() {
String[] xData = Conductivity.getDeviceName();//获得的数据,下同
Float[] yData = BroadcastCome.getBtData();//
for (int i = 0; i < yData.length; i++) {
System.out.println("lineChart_yData---:"+yData);
}
int dataLength = xData.length;
ArrayList<String> xValues = new ArrayList<String>();
for (int i = 0; i < dataLength; i++) {
// x轴显示的数据,这里默认使用数字下标显示
// xValues.add("" + i);
xValues.add(xData[i]);
}

// y轴的数据
ArrayList<Entry> yValues = new ArrayList<Entry>();
for (int i = 0; i < dataLength; i++) {
// float value = (float) (Math.random() * range) + 3;
// yValues.add(new Entry(value, i));
yValues.add(new Entry(yData[i], i));
}

// create a dataset and give it a type
// y轴的数据集合
LineDataSet lineDataSet = new LineDataSet(yValues, "温度数据一览图" /* 显示在比例图上 */);
// mLineDataSet.setFillAlpha(110);
// mLineDataSet.setFillColor(Color.RED);

// 用y轴的集合来设置参数
lineDataSet.setLineWidth(1.75f); // 线宽
lineDataSet.setCircleSize(3f);// 显示的圆形大小
lineDataSet.setColor(Color.WHITE);// 显示颜色
lineDataSet.setCircleColor(Color.WHITE);// 圆形的颜色
lineDataSet.setHighLightColor(Color.WHITE); // 高亮的线的颜色

ArrayList<LineDataSet> lineDataSets = new ArrayList<LineDataSet>();
lineDataSets.add(lineDataSet); // add the datasets
lineDataSet.setDrawCircles(false);
lineDataSet.setDrawCubic(true);
lineDataSet.setCubicIntensity(0.6f);
lineDataSet.setDrawFilled(true);
lineDataSet.setFillColor(Color.rgb(0, 255, 255));
// create a data object with the datasets
LineData lineData = new LineData(xValues, lineDataSets);

return lineData;
}

/**
*
* @param strings字符串转换成float
*/
public Float[] stringTofloat(String[] strings) {
Float[] data = new Float[strings.length];
for (int i = 0; i < strings.length; i++) {
data[i] = Float.valueOf(strings[i].trim().replace("℃", ""));
System.out.println("转换后的数据:"+data[i]);
}
return data;
}

@Override
public boolean onCreateOptionsMenu(Menu menu) {
// Inflate the menu; this adds items to the action bar if it is present.
return true;
}

@Override
public boolean onOptionsItemSelected(MenuItem item) {
// Handle action bar item clicks here. The action bar will
// automatically handle clicks on the Home/Up button, so long
// as you specify a parent activity in AndroidManifest.xml.
return super.onOptionsItemSelected(item);
}
}
效果图借用原文中的图片:

相关文章推荐
- Android studio主题风格的添加
- ImageLoader框架使用步骤
- Android屏幕适配
- Android项目中如何用好构建神器Gradle?
- Android单元测试异常总结---Test run failed:Unable to find instrumentation target package
- Android多个按钮下本Activity按钮事件处理
- Android_Activity传值和跳转
- Android下获取各种存储目录
- Android-SD卡文件夹创建和删除实现
- 个人对Android Touch事件机制的理解
- Android多线程问题—— AsyncTask机制
- 修改Android studio 中svn版本
- Android边缓冲边播放视频(ijkplayer的编译和使用)
- android ButterKnife
- android adb 权限修改
- android,自定义无标题对话框(继承Dialog类,非AlertDialog)的样式
- 【Android应用开发】Android Studio - MAC 版 - 快捷键详解
- AndroidImageSlider
- Android中的动画(待续)
- Android笔记(九) Android中的布局——框架布局