理解GC日志
2015-06-29 19:03
316 查看
理解GC 日志
如何查看GC日志
设置参数 :-verbose:gc -XX:+PrintGCDetails -XX:+PrintGCDateStamps -Xloggc:gc.log
/**
*
* -verbose:[class|gc|jni] 在输出设备上显示虚拟机运行信息。
* -verbose:class 显示有多少个类被加载
* -verbose:gc 在虚拟机发生内存回收时在输出设备显示信息
* -verbose:jni 输出native方法调用的相关情况,一般用于诊断jni调用错误信息。
* -verbose:gc
* -XX:+PrintGCDetails  打印日志详细信息
* -XX:+PrintGCDateStamps 显示时间戳
* -Xloggc:gc.log 输出到文件
*
* @author Nicholas
*
*/

public class ReferenceCountingGC {

public Object instance = null;
private static final int _1MB = 1024 * 1024;

// 这个属性的作用就是占点内存,以便在GC 日志中查看内存是否被回收
private byte[] bigSize = new byte[2 * _1MB];

public void testGC() {
ReferenceCountingGC referenceCountingGC1 = new ReferenceCountingGC();
ReferenceCountingGC referenceCountingGC2 = new ReferenceCountingGC();

// 循环引用
referenceCountingGC1.instance = referenceCountingGC2;
referenceCountingGC2.instance = referenceCountingGC1;

referenceCountingGC1 = null;
referenceCountingGC2 = null;

System.gc();
}

public static void main(String[] args) {
new ReferenceCountingGC().testGC();
}
}
具体的日志信息如下
Java HotSpot(TM) 64-Bit Server VM (25.45-b02) for windows-amd64 JRE (1.8.0_45-b15), built on Apr 30 2015 12:40:44 by "java_re" with MS VC++ 10.0 (VS2010)
Memory: 4k page, physical 8288616k(4376860k free), swap 9533800k(3998704k free)
CommandLine flags: -XX:InitialHeapSize=132617856 -XX:MaxHeapSize=2121885696 -XX:+PrintGC -XX:+PrintGCDateStamps -XX:+PrintGCDetails -XX:+PrintGCTimeStamps -XX:+UseCompressedClassPointers -XX:+UseCompressedOops -XX:-UseLargePagesIndividualAllocation -XX:+UseParallelGC
2015-06-29T18:22:09.690+0800: 0.126: [GC (System.gc()) [PSYoungGen: 8806K->2696K(38400K)] 8806K->2704K(125952K), 0.0019668 secs] [Times: user=0.00 sys=0.00, real=0.00 secs]
2015-06-29T18:22:09.694+0800: 0.128: [Full GC (System.gc()) [PSYoungGen: 2696K->0K(38400K)] [ParOldGen: 8K->2557K(87552K)] 2704K->2557K(125952K), [Metaspace: 2473K->2473K(1056768K)], 0.0070960 secs] [Times: user=0.00 sys=0.00, real=0.01 secs]
Heap
PSYoungGen total 38400K, used 333K [0x00000000d5d80000, 0x00000000d8800000, 0x0000000100000000)
eden space 33280K, 1% used [0x00000000d5d80000,0x00000000d5dd34a8,0x00000000d7e00000)
from space 5120K, 0% used [0x00000000d7e00000,0x00000000d7e00000,0x00000000d8300000)
to space 5120K, 0% used [0x00000000d8300000,0x00000000d8300000,0x00000000d8800000)
ParOldGen total 87552K, used 2557K [0x0000000081800000, 0x0000000086d80000, 0x00000000d5d80000)
object space 87552K, 2% used [0x0000000081800000,0x0000000081a7f448,0x0000000086d80000)
Metaspace used 2479K, capacity 4486K, committed 4864K, reserved 1056768K
class space used 274K, capacity 386K, committed 512K, reserved 1048576K
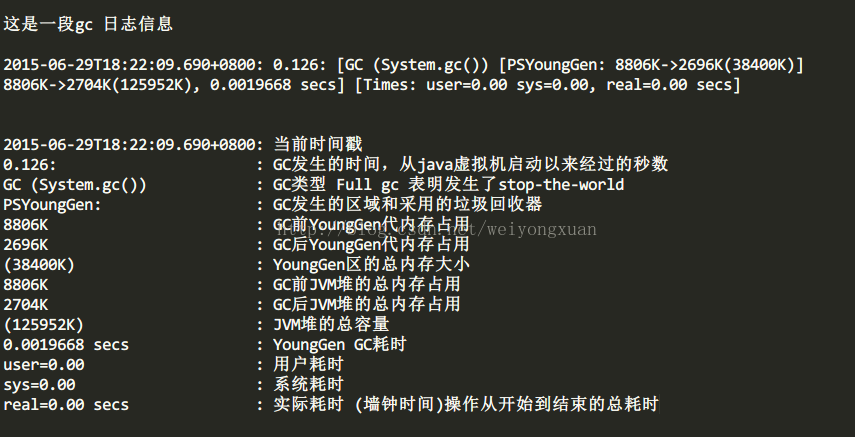
这是一段gc 日志信息
这里有更清晰的图片说明
2015-06-29T18:22:09.690+0800: 0.126: [GC (System.gc()) [PSYoungGen: 8806K->2696K(38400K)] 8806K->2704K(125952K), 0.0019668 secs] [Times: user=0.00 sys=0.00, real=0.00 secs]
2015-06-29T18:22:09.690+0800: 当前时间戳
0.126: : GC发生的时间,从java虚拟机启动以来经过的秒数
GC (System.gc()) : GC类型 Full gc 表明发生了stop-the-world
PSYoungGen: : GC发生的区域和采用的垃圾回收器
8806K : GC前YoungGen代内存占用
2696K : GC后YoungGen代内存占用
(38400K) : YoungGen区的总内存大小
8806K : GC前JVM堆的总内存占用
2704K : GC后JVM堆的总内存占用
(125952K) : JVM堆的总容量
0.0019668 secs : YoungGen GC耗时
user=0.00 : 用户耗时
sys=0.00 : 系统耗时
real=0.00 secs : 实际耗时 (墙钟时间)操作从开始到结束的总耗时
如何理解GC的类型和区域
GC: 和Full GC:表明垃圾收集的停顿类型,有full表明发生了stop-the-world,如果调用了system.gc(),则类型是[Full GC(System)]GC发生的区域和所使用的收集器密切相关
PSYoungGen: PS是Parallel Scavenge收集器的缩写,所以PSYoungGen可以理解为对新生代采用Parallel Scavenge收集器收集。DefNew: Default New generation,使用serial收集器对新生代收集。
ParNew: Parallel New generation,使用ParNew收集器收集新生代。
老年代同理。

相关文章推荐
- jQuery验证邮箱手机
- 用js得到当前页面的url
- 跨平台的游戏客户端Socket封装
- linux下查看和添加PATH环境变量
- C# 键值对排序
- Kernel那些事儿之内存管理(4) --- 未雨绸缪
- Exchange Server 2010续定证书系列3-将续定后证书导入服务器
- JavaScript事件代理,减少开销提高效率
- JavaScript事件代理,减少开销提高效率
- php 与 sql in 带参数
- MySQL导入或导出数据库字符编码集设置
- Android虚拟机Dalvik Android的相关文件类型
- 用心看世界
- MyBatis中动态SQL语句完成多条件查询
- 【FMDB】事务
- selenium如何跳转到iframe
- 字符串的案例,代码详解
- jquery学习基础(二)
- 2015-6-29yii 数据库连接笔记
- Android Studio编译大工程报错:java.exe'' finished with non-zero exit value 1