Logstash+ElasticSearch+Kibana4日志分析系统安装详解
2015-06-02 10:38
423 查看
ELK日志分析系统
环境:centos6.5
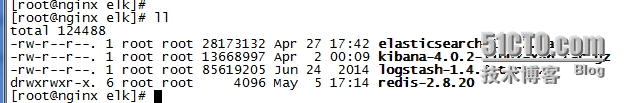
准备好ELK三个安装包,去官网下载最新版
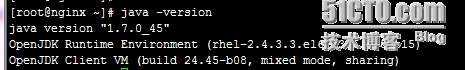
看下版本,1.7是不行的,要1.8以上
升级到1.8
先删除1.7版本
# yum remove -y java-1.7.0-openjdk
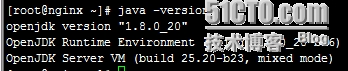
然后安装1.8版本,看到下面信息即可
2、安装elasticsearch
下载安装包(tar)https://www.elastic.co/downloads/elasticsearch
直接解压到/usr/local下面
tar -xzvf elasticsearch-1.5.2.tar.gz -C /usr/local
加载模块
execstack -c /usr/local/elasticsearch-1.5.2/lib/sigar/libsigar-x86-linux.so
启动
/usr/local/elasticsearch-1.5.2/bin/elasticsearch -d
检查启动状态
[root@nginx ~]# curl 127.0.0.1:9200
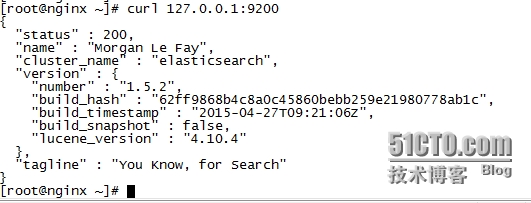
说明启动成功
如果你看到报错信息如下:
[2015-05-13 16:18:01,985][WARN ][bootstrap ] jvm uses the client vm, make sure to run `java` with the server vm for best performance by adding `-server` to the command line
[2015-05-13 16:18:01,992][ERROR][bootstrap ] Exception
java.lang.RuntimeException: Java version: 1.7.0_45 suffers from critical bug https://bugs.openjdk.java.net/browse/JDK-8024830 which can cause data corruption.
Please upgrade the JVM, see http://www.elastic.co/guide/en/elasticsearch/reference/current/_installation.html for current recommendations.
If you absolutely cannot upgrade, please add -XX:-UseSuperWord to the JVM_OPTS environment variable.
Upgrading is preferred, this workaround will result in degraded performance.
那我只能说,扇脸,用力,叫你不听我的,叫你不听我的!!!
解决办法:
Yum install -y java-1.8.0-openjdk
3、安装redis,下载2.8版本的
下载redishttp://redis.io/
如果下载2.8以上版本,依赖解决起来会麻烦很多
Wget https://github.com/antirez/redis/archive/2.8.20.tar.gz
安装依赖tcl(别问我这个tcl跟卖家电的TCL有什么关系,我母鸡啊)
# yum install -y tcl
如果你想作死不装TCL的话,那你就会看到不一样的效果,看下图~~~
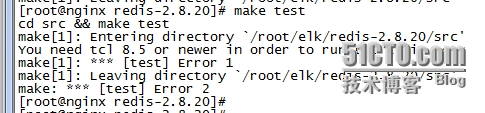
编译安装
make
make test
make install
cp redis.conf /etc/
配置redis
# vim /usr/local/redis/etc/redis.conf
daemonize yes#设置后台运行
启动redis
# redis-server /redis.conf

说明启动成功
4、安装logstash
直接解压过去就行了[root@nginx elk]# tar -xzvf logstash-1.4.2.tar.gz -C /usr/local/ 创建日志推送配置文件[root@nginx elk]# mkdir /usr/local/logstash-1.4.2/etc [root@nginx elk]# vim /usr/local/logstash-1.4.2/etc/logstash_agent.conf input { file { type => "nginx_access log"#这里定义的是日志文件名 path => ["/usr/local/nginx/logs/host.access.log"]#这里定义的是日志文件路径 }}output { redis { host => "localhost"#这里定义redis主机地址,这里是本机 data_type => "list" key => "logstash:redis" }} 创建indexer配置文件[root@nginx elk]# vim /usr/local/logstash-1.4.2/etc/logstash_indexer.conf input { redis { host => "localhost" data_type => "list" key => "logstash:redis" type => "redis-input" }}filter { grok { type => "nginx_access" match => [ "message", "%{IPORHOST:http_host} %{IPORHOST:client_ip} \[%{HTTPDATE:timestamp}\] \"(?:%{WORD:http_verb} %{NOTSPACE:http_request}(?: HTTP/%{NUMBER:http_version})?|%{DATA:raw_http_request})\" %{NUMBER:http_status_code} (?:%{NUMBER:bytes_read}|-) %{QS:referrer} %{QS:agent} %{NUMBER:time_duration:float} %{NUMBER:time_backend_response:float}", "message", "%{IPORHOST:http_host} %{IPORHOST:client_ip} \[%{HTTPDATE:timestamp}\] \"(?:%{WORD:http_verb} %{NOTSPACE:http_request}(?: HTTP/%{NUMBER:http_version})?|%{DATA:raw_http_request})\" %{NUMBER:http_status_code} (?:%{NUMBER:bytes_read}|-) %{QS:referrer} %{QS:agent} %{NUMBER:time_duration:float}" ] }}output { elasticsearch { embedded => false protocol => "http" host => "localhost" port => "9200" }}启动logsyash nohup /usr/local/logstash-1.4.2/bin/logstash -f /usr/local/logstash-1.4.2/etc/logstash_agent.conf & nohup /usr/local/logstash-1.4.2/bin/logstash -f /usr/local/logstash-1.4.2/etc/logstash_indexer.conf &
5、安装kibana
同样不需要安装,解压就能用[root@nginx elk]# tar -xzf kibana-4.0.2-linux-x86.tar.gz -C /usr/local/
启动
[root@nginx elk]# nohup /usr/local/kibana-4.0.2-linux-x86/bin/kibana &
然后打开浏览器输入IP加端口5601即可访问
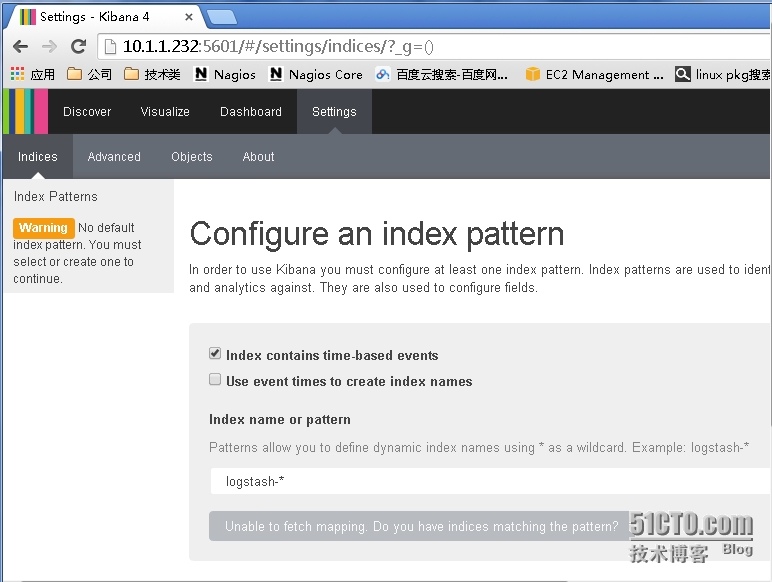
进来之后他要你创建一个默认索引,可是怎么办没有create啊,下面会灰色的,是不是我做错了,好紧张,好害怕~~~~~~~~
好吧,其实都不是,这个如果你装完kibana你那个日志文件要是一直没有新的日志产生呢这里就一直是灰的,这个时候你只需要去访问一下你的网站,然后就行了
(当时我碰到这个问题的时候,因为用的虚拟机做的,卡了几个小时啊坑爹啊)
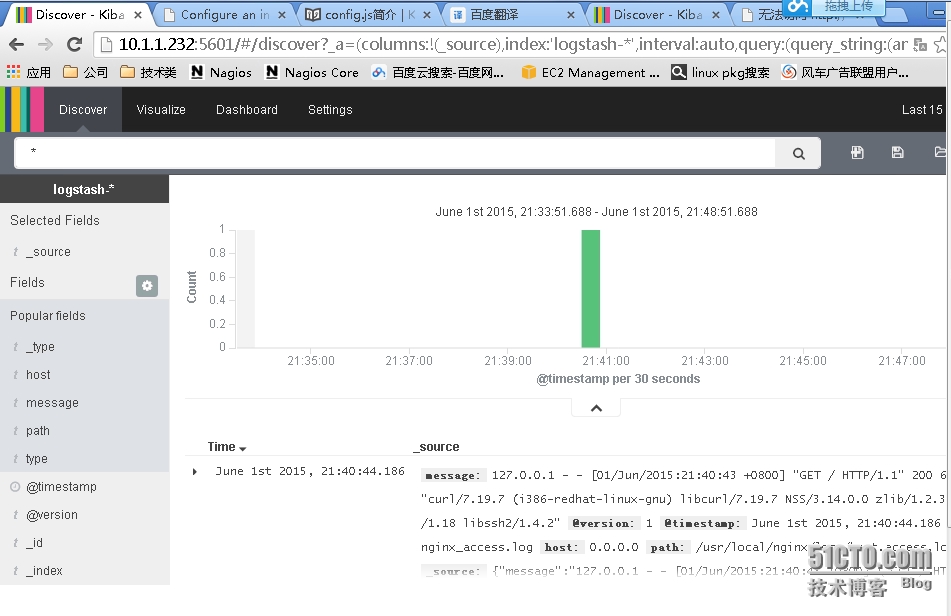
然后你就可以看到下面的情况了,选择timestamp,点击create创建,完成
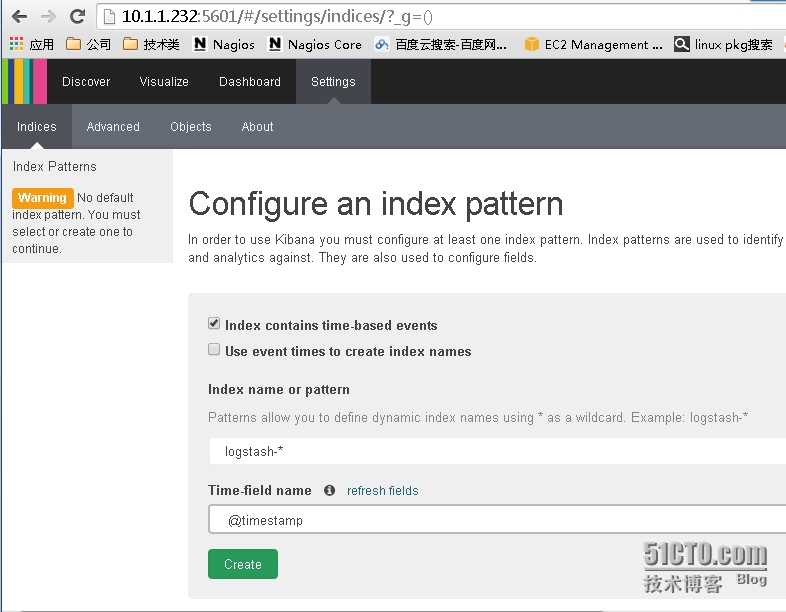
搭建成功
6、客户机配置
上面我们是获取本机的日志而已,其他客户机怎么配置呢?
客户机只需要安装logstash
解压[root@nginx elk]# tar -xzvf logstash-1.4.2.tar.gz -C /usr/local/ 创建日志推送配置文件[root@nginx elk]# mkdir /usr/local/logstash-1.4.2/etc [root@nginx elk]# vim /usr/local/logstash-1.4.2/etc/logstash_agent.conf input { file { type => "nginx_access log"#这里定义的是日志文件名 path => ["/usr/local/nginx/logs/host.access.log"]#这里定义的是日志文件路径 }}output { redis { host => "10.1.1.231"#这里定义redis主机地址 data_type => "list" key => "logstash:redis" }} 启动logsyash nohup /usr/local/logstash-1.4.2/bin/logstash -f /usr/local/logstash-1.4.2/etc/logstash_agent.conf &
完成!!!!
参考资料:http://kibana.logstash.es/content/
本文出自 “飞一般的爱情故事” 博客,请务必保留此出处http://niubdada.blog.51cto.com/3511133/1657386
环境:centos6.5
准备好ELK三个安装包,去官网下载最新版
1、安装jdk
网上有的教程叫下载oracle的jdk,其实没必要,系统自带的openjdk就行了,不过需要先看下版本,1.7是不行的,要1.8以上
升级到1.8
先删除1.7版本
# yum remove -y java-1.7.0-openjdk
然后安装1.8版本,看到下面信息即可
2、安装elasticsearch
下载安装包(tar)https://www.elastic.co/downloads/elasticsearch
直接解压到/usr/local下面
tar -xzvf elasticsearch-1.5.2.tar.gz -C /usr/local
加载模块
execstack -c /usr/local/elasticsearch-1.5.2/lib/sigar/libsigar-x86-linux.so
启动
/usr/local/elasticsearch-1.5.2/bin/elasticsearch -d
检查启动状态
[root@nginx ~]# curl 127.0.0.1:9200
说明启动成功
如果你看到报错信息如下:
[2015-05-13 16:18:01,985][WARN ][bootstrap ] jvm uses the client vm, make sure to run `java` with the server vm for best performance by adding `-server` to the command line
[2015-05-13 16:18:01,992][ERROR][bootstrap ] Exception
java.lang.RuntimeException: Java version: 1.7.0_45 suffers from critical bug https://bugs.openjdk.java.net/browse/JDK-8024830 which can cause data corruption.
Please upgrade the JVM, see http://www.elastic.co/guide/en/elasticsearch/reference/current/_installation.html for current recommendations.
If you absolutely cannot upgrade, please add -XX:-UseSuperWord to the JVM_OPTS environment variable.
Upgrading is preferred, this workaround will result in degraded performance.
那我只能说,扇脸,用力,叫你不听我的,叫你不听我的!!!
解决办法:
Yum install -y java-1.8.0-openjdk
3、安装redis,下载2.8版本的
下载redishttp://redis.io/
如果下载2.8以上版本,依赖解决起来会麻烦很多
Wget https://github.com/antirez/redis/archive/2.8.20.tar.gz
安装依赖tcl(别问我这个tcl跟卖家电的TCL有什么关系,我母鸡啊)
# yum install -y tcl
如果你想作死不装TCL的话,那你就会看到不一样的效果,看下图~~~
编译安装
make
make test
make install
cp redis.conf /etc/
配置redis
# vim /usr/local/redis/etc/redis.conf
daemonize yes#设置后台运行
启动redis
# redis-server /redis.conf
说明启动成功
4、安装logstash
直接解压过去就行了[root@nginx elk]# tar -xzvf logstash-1.4.2.tar.gz -C /usr/local/ 创建日志推送配置文件[root@nginx elk]# mkdir /usr/local/logstash-1.4.2/etc [root@nginx elk]# vim /usr/local/logstash-1.4.2/etc/logstash_agent.conf input { file { type => "nginx_access log"#这里定义的是日志文件名 path => ["/usr/local/nginx/logs/host.access.log"]#这里定义的是日志文件路径 }}output { redis { host => "localhost"#这里定义redis主机地址,这里是本机 data_type => "list" key => "logstash:redis" }} 创建indexer配置文件[root@nginx elk]# vim /usr/local/logstash-1.4.2/etc/logstash_indexer.conf input { redis { host => "localhost" data_type => "list" key => "logstash:redis" type => "redis-input" }}filter { grok { type => "nginx_access" match => [ "message", "%{IPORHOST:http_host} %{IPORHOST:client_ip} \[%{HTTPDATE:timestamp}\] \"(?:%{WORD:http_verb} %{NOTSPACE:http_request}(?: HTTP/%{NUMBER:http_version})?|%{DATA:raw_http_request})\" %{NUMBER:http_status_code} (?:%{NUMBER:bytes_read}|-) %{QS:referrer} %{QS:agent} %{NUMBER:time_duration:float} %{NUMBER:time_backend_response:float}", "message", "%{IPORHOST:http_host} %{IPORHOST:client_ip} \[%{HTTPDATE:timestamp}\] \"(?:%{WORD:http_verb} %{NOTSPACE:http_request}(?: HTTP/%{NUMBER:http_version})?|%{DATA:raw_http_request})\" %{NUMBER:http_status_code} (?:%{NUMBER:bytes_read}|-) %{QS:referrer} %{QS:agent} %{NUMBER:time_duration:float}" ] }}output { elasticsearch { embedded => false protocol => "http" host => "localhost" port => "9200" }}启动logsyash nohup /usr/local/logstash-1.4.2/bin/logstash -f /usr/local/logstash-1.4.2/etc/logstash_agent.conf & nohup /usr/local/logstash-1.4.2/bin/logstash -f /usr/local/logstash-1.4.2/etc/logstash_indexer.conf &
5、安装kibana
同样不需要安装,解压就能用[root@nginx elk]# tar -xzf kibana-4.0.2-linux-x86.tar.gz -C /usr/local/
启动
[root@nginx elk]# nohup /usr/local/kibana-4.0.2-linux-x86/bin/kibana &
然后打开浏览器输入IP加端口5601即可访问
进来之后他要你创建一个默认索引,可是怎么办没有create啊,下面会灰色的,是不是我做错了,好紧张,好害怕~~~~~~~~
好吧,其实都不是,这个如果你装完kibana你那个日志文件要是一直没有新的日志产生呢这里就一直是灰的,这个时候你只需要去访问一下你的网站,然后就行了
(当时我碰到这个问题的时候,因为用的虚拟机做的,卡了几个小时啊坑爹啊)
然后你就可以看到下面的情况了,选择timestamp,点击create创建,完成
搭建成功
6、客户机配置
上面我们是获取本机的日志而已,其他客户机怎么配置呢?
客户机只需要安装logstash
解压[root@nginx elk]# tar -xzvf logstash-1.4.2.tar.gz -C /usr/local/ 创建日志推送配置文件[root@nginx elk]# mkdir /usr/local/logstash-1.4.2/etc [root@nginx elk]# vim /usr/local/logstash-1.4.2/etc/logstash_agent.conf input { file { type => "nginx_access log"#这里定义的是日志文件名 path => ["/usr/local/nginx/logs/host.access.log"]#这里定义的是日志文件路径 }}output { redis { host => "10.1.1.231"#这里定义redis主机地址 data_type => "list" key => "logstash:redis" }} 启动logsyash nohup /usr/local/logstash-1.4.2/bin/logstash -f /usr/local/logstash-1.4.2/etc/logstash_agent.conf &
完成!!!!
参考资料:http://kibana.logstash.es/content/
本文出自 “飞一般的爱情故事” 博客,请务必保留此出处http://niubdada.blog.51cto.com/3511133/1657386

相关文章推荐
- 使用Redis实现高并发分布式序列号生成服务
- 获取当前显示的ViewController
- 22个很棒的jQuery文件上传插件
- JavaScript 闭包初步
- 欢迎使用CSDN-markdown编辑器
- 19.在字符串数组中找出给定的字符串并输出其位置
- Android 图片的三级缓存 及 图片压缩
- 普通的101键盘在Mac上的键位对应
- RAID
- A8ERP权限管理系统
- RESTful架构
- Graph database_neo4j 底层存储结构分析(2)
- 比ListView和GridView更加高效的RecyclerView
- 15HD_OJ——献给杭电五十周年校庆的礼物
- Node.js事件循环
- error LNK2038: 检测到“_MSC_VER”的不匹配项: 值“1700”不匹配值“1800”
- lwip1.3.2+ucosII服务器与浏览器连接问题bug解决
- Hadoop课程介绍
- SQL:将查询结果插入到另一个表的三种情况
- Graph database_neo4j 底层存储结构分析(1)