logstash 过虑nginx访问日志
2015-05-06 19:27
211 查看
标题是不是可以翻译成这样:logstash Filters nginx access log

好了,进入正题,日志管理服务器我用ElasticSearch+LogStash+Kibana+Redis
先说下我的架构:
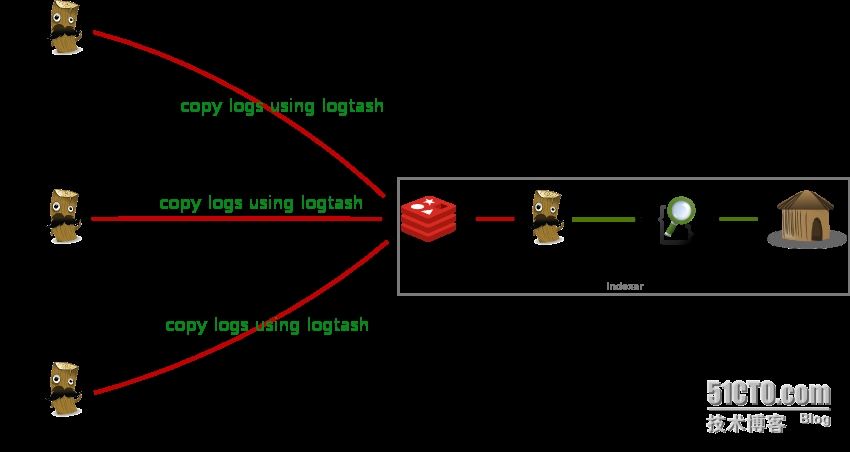
远程NGINX采集日志数据到REDIS+logstash+elasticsearch+kibana服务器
至于怎么部署,因本人之前用baidu博客写在那上面了,以后有时间把百度的搬过来
好了,这里就先不说部署了,我们直接进入配置正题
在nginx服务器,我们一、先配置nginx的日志格式
1.1 配置logstash patterns
注意,我们配置的日志格式完全要和我们的patterns解析出来
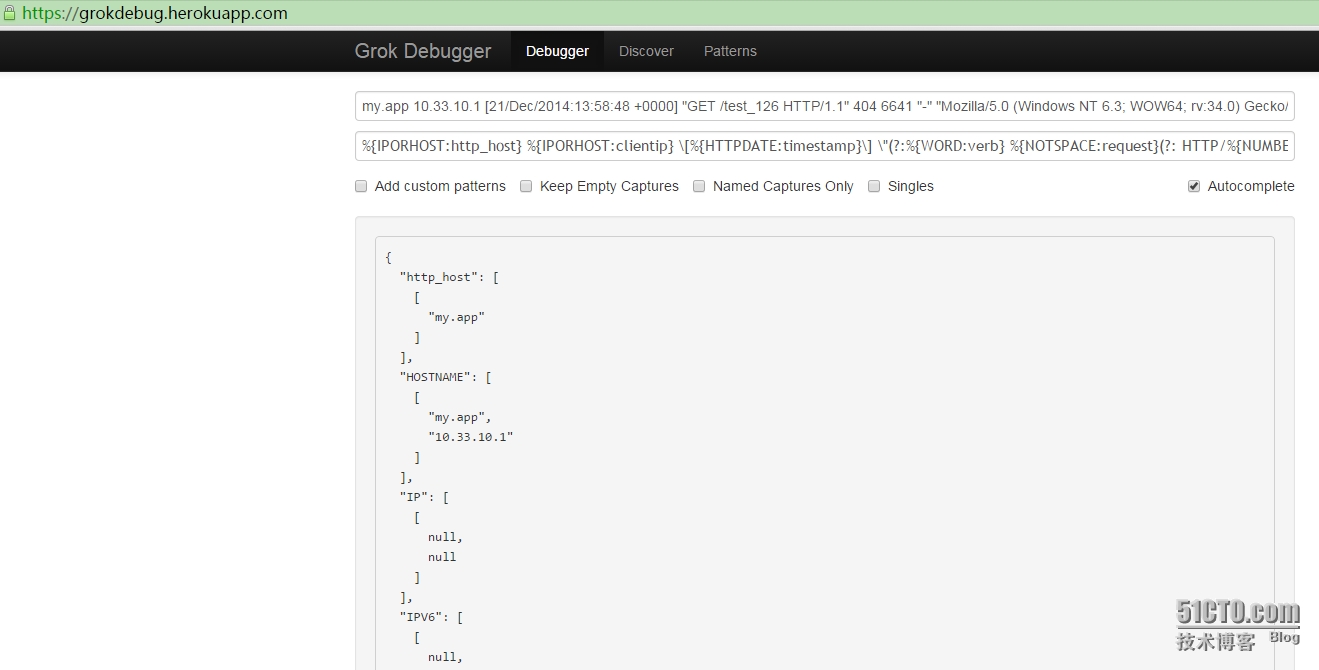
具体解析方式,可以到https://grokdebug.herokuapp.com/
input:nginx的日志
patterns:就是要过滤的格式,如图
2.1 配置nginx日志采集脚本
启动:
直接写logstash脚本
好的,脚本配置完毕,接下来我们访问看看
本文出自 “xiangcun168” 博客,谢绝转载!
好了,进入正题,日志管理服务器我用ElasticSearch+LogStash+Kibana+Redis
先说下我的架构:
远程NGINX采集日志数据到REDIS+logstash+elasticsearch+kibana服务器
至于怎么部署,因本人之前用baidu博客写在那上面了,以后有时间把百度的搬过来
好了,这里就先不说部署了,我们直接进入配置正题
在nginx服务器,我们一、先配置nginx的日志格式
log_format main '$http_host $remote_addr - $remote_user [$time_local] "$request" '
'$status $body_bytes_sent "$http_referer" '
'"$http_user_agent" "$upstream_addr" $request_time';
二、配置logstash采集文件
1.1 配置logstash patterns
logstash/patterns# vi nginx
NGUSERNAME [a-zA-Z\.\@\-\+_%]+
NGUSER %{NGUSERNAME}
NGINXACCESS %{IPORHOST:http_host} %{IPORHOST:clientip} - %{USERNAME:remote_user} \[%{HTTPDATE:timestamp}\] \"(?:%{WORD:http_verb} %{NOTSPACE:http_request}(?: HTTP/%{NUMBER:http_version})?|%{DATA:raw_http_request})\" %{NUMBER:response} (?:%{NUMBER:bytes_read}|-) %{QS:referrer} %{QS:agent} %{QS:xforwardedfor} %{NUMBER:request_time:float}
注意,我们配置的日志格式完全要和我们的patterns解析出来
具体解析方式,可以到https://grokdebug.herokuapp.com/
input:nginx的日志
patterns:就是要过滤的格式,如图
2.1 配置nginx日志采集脚本
logstash#vi nginx_logs.conf
input {
file {
type => "nginx-access"
path => "/www/log/nginx/access/default.log"
start_position => "beginning"
}
}

filter {

if [type] == "nginx-access" {
grok {
match => { "message" => "%{NGINXACCESS}" }
}
date {
match => [ "timestamp" , "dd/MMM/YYYY:HH:mm:ss Z" ]
}
geoip {
source => "clientip"
target => "geoip"
database =>"/server/logstash/vendor/geoip/GeoLiteCity.dat"
add_field => [ "[geoip][coordinates]", "%{[geoip][longitude]}" ]
add_field => [ "[geoip][coordinates]", "%{[geoip][latitude]}"  ]

}
mutate {
convert => [ "[geoip][coordinates]", "float" ]
}
}
}

output {

redis {
host => "10.252.35.170"
port => 6379
data_type => "list"
key => "logstash"
}
}这个脚本里,我主要采集了geoip的信息,当然,你也直接可以将数据导入到redis,我就附上我的全脚本吧~~启动:
#/server/logstash/bin/logstash agent -f /alidata/server/logstash/nginx_logs.conf &三、配置REDIS+logstash
直接写logstash脚本
logstash# vi nginx.conf
input {
redis {
host => "127.0.0.1"
port => "6379"
data_type => "list"
key => "logstash"
type => "redis-input"
codec => "json"
}
}

output {
elasticsearch {
embedded => false
protocol => "http"
host => "localhost"
port => "9200"
}
}启动脚本#/logstash/bin/logstash agent -f /alidata/server/logstash/nginx.conf &
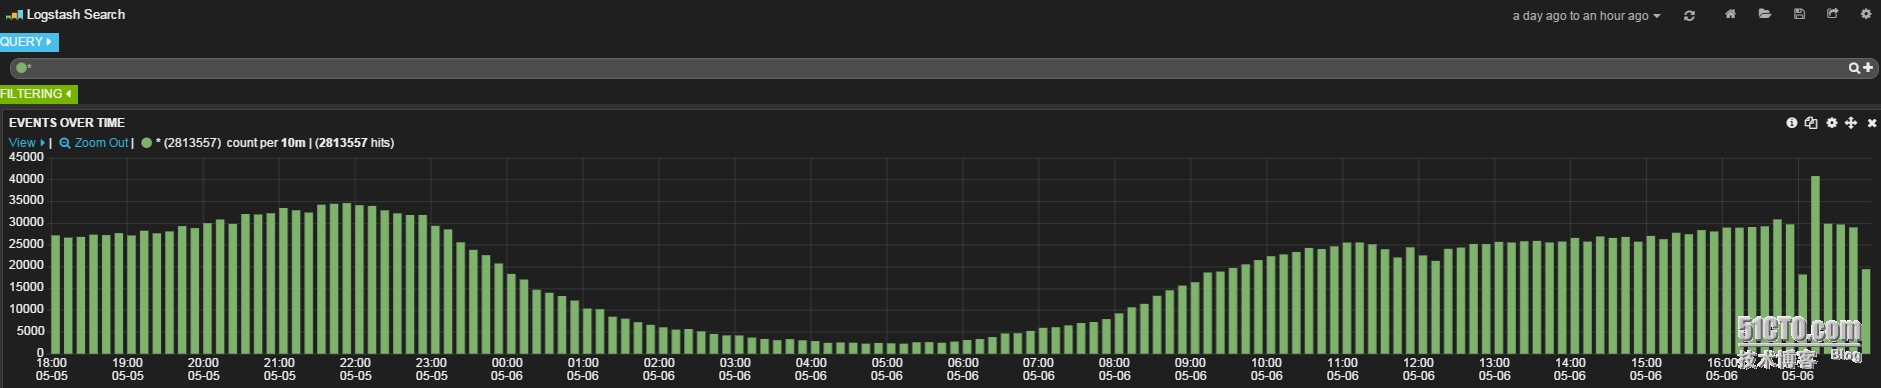
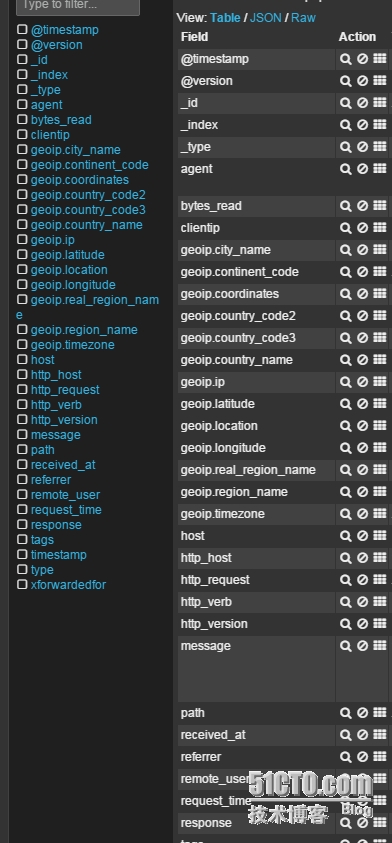
好的,脚本配置完毕,接下来我们访问看看
本文出自 “xiangcun168” 博客,谢绝转载!

相关文章推荐
- logstash收集nginx访问日志
- Logstash+ElasticSearch+Kibana处理nginx访问日志(转)
- 使用logstash收集nginx访问日志
- logstash 处理nginx 访问日志
- logstash 处理nginx 访问日志
- 使用Logstash分析纪录Nginx服务器访问及错误日志
- LOGSTASH+ELASTICSEARCH+KIBANA处理NGINX访问日志
- Nginx访问日志、静态文件不记录过期时间
- Nginx访问日志、日志切割、静态文件不记录日志和过期时间
- LNMP架构(nginx访问日志,Nginx日志切割,静态文件不记录访问日志)
- shell脚本分析 nginx日志访问次数最多及最耗时的页面(慢查询)
- LNMP架构(三)Nginx访问日志-日志 –静态文件
- shell脚本分析 nginx日志访问次数最多及最耗时的页面(慢查询)
- Apache/Nginx 访问日志分析脚本
- Logstash收集nginx日志之使用grok过滤插件解析日志
- logstash 处理nginx 错误日志
- 解决nginx访问日志记录post数据
- python正则分析nginx的访问日志
- nginx日志不记录静态文件访问和缓存
- nginx访问日志切割脚本