VS2013 建立 remote debugging 远程debug的方法
2015-03-27 23:02
435 查看
转载地址:http://www.itworld.com/article/2699037/development/how-to-set-up-remote-debugging-in-visual-studio-2013.html
As is the custom, the code which works perfectly in your local environment rarely works as perfectly in your remote test environment. Some issues can only be reproduced on the different hardware running as a different service account etc. To find out exactly what’s happening in that environment, you need to set up remote debugging.
spooks 620x465
How an acute shortage of cyber talent gave rise to ‘spooks as a service’
As the list of victims of sophisticated cyber attacks expands, so does the need for high-priced talent
READ NOW
Remote debugging in Visual Studio allows you to step through code, set breakpoints, review objects, inspect the stack, and catch errors on a remote server just as if you were running the code locally. While generally dog slow, this capability is invaluable when mysterious problems crop up in another environment.
Microsoft has made the setup of this magical feature pretty simple, but there are a few gotcha’s that always cause me headaches. To get started, you need to install the Visual Studio Remote Tools on the server you want to debug remotely. Once you install the service, you’ll find a link to the remote tools configuration wizard in the start menu on the server. Running that will allow you to specify the account for the service to run under, or if you prefer, set up the monitoring tool to run as a user account instead of a service. After you complete the wizard you can start the Remote Debugger Monitor by running the program from the server’s start menu. That’s it for the server side in most cases.
Next you need to connect to the server from visual studio so you can attach to the w3wp process. Before you do that however, here are two important items to note:
You must have the same version of the code on the server as you have locally, so make sure you publish your solution before trying to debug it.
You must publish the Debug version of the code to the server. If you publish the Release version, the .pdb files which contain all of the debug symbols will not be included and you won’t be able to debug remotely.
With the latest debug code pushed up to the server, you should be able to connect up and attach to the process to begin debugging. From Visual Studio, go to Debug -> Attach to process. In the Qualifier field, type the IP or the hostname of the server you want to connect to (the port should default to 4018 automatically), then press the Refresh button at the bottom. If you’re successful in reaching the server, you’ll see a list of running processes.
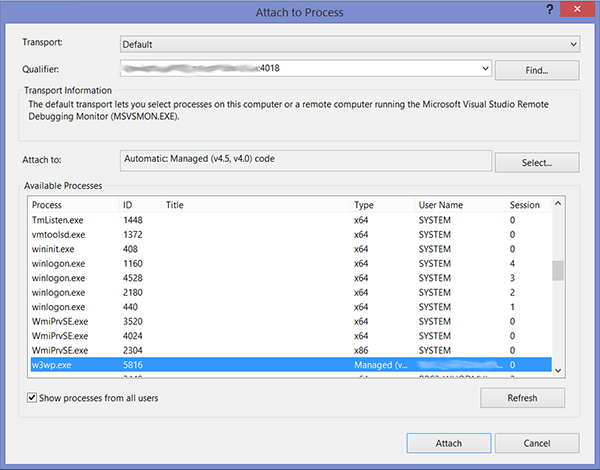
If you don’t see the w3wp.exe process in the list, be sure you’ve checked the “Show processes from all users” box. If you still don’t see it, navigate to the application in a web browser to kick off the process, then refresh again.
Once you find the w3wp.exe process, highlight it and click the “Attach” button. Your local client and the server will sync up the symbol files, which can take a minute, and then you should be connected to the remote debugger. You’re now free to set breakpoints in your local code which will be hit from the remote execution.
Once you set a breakpoint, open a web browser and navigate to the application on the remote server. When you do, you should hit your breakpoint just as you would if you had launched the program locally.
As is the custom, the code which works perfectly in your local environment rarely works as perfectly in your remote test environment. Some issues can only be reproduced on the different hardware running as a different service account etc. To find out exactly what’s happening in that environment, you need to set up remote debugging.
spooks 620x465
How an acute shortage of cyber talent gave rise to ‘spooks as a service’
As the list of victims of sophisticated cyber attacks expands, so does the need for high-priced talent
READ NOW
Remote debugging in Visual Studio allows you to step through code, set breakpoints, review objects, inspect the stack, and catch errors on a remote server just as if you were running the code locally. While generally dog slow, this capability is invaluable when mysterious problems crop up in another environment.
Microsoft has made the setup of this magical feature pretty simple, but there are a few gotcha’s that always cause me headaches. To get started, you need to install the Visual Studio Remote Tools on the server you want to debug remotely. Once you install the service, you’ll find a link to the remote tools configuration wizard in the start menu on the server. Running that will allow you to specify the account for the service to run under, or if you prefer, set up the monitoring tool to run as a user account instead of a service. After you complete the wizard you can start the Remote Debugger Monitor by running the program from the server’s start menu. That’s it for the server side in most cases.
Next you need to connect to the server from visual studio so you can attach to the w3wp process. Before you do that however, here are two important items to note:
You must have the same version of the code on the server as you have locally, so make sure you publish your solution before trying to debug it.
You must publish the Debug version of the code to the server. If you publish the Release version, the .pdb files which contain all of the debug symbols will not be included and you won’t be able to debug remotely.
With the latest debug code pushed up to the server, you should be able to connect up and attach to the process to begin debugging. From Visual Studio, go to Debug -> Attach to process. In the Qualifier field, type the IP or the hostname of the server you want to connect to (the port should default to 4018 automatically), then press the Refresh button at the bottom. If you’re successful in reaching the server, you’ll see a list of running processes.
If you don’t see the w3wp.exe process in the list, be sure you’ve checked the “Show processes from all users” box. If you still don’t see it, navigate to the application in a web browser to kick off the process, then refresh again.
Once you find the w3wp.exe process, highlight it and click the “Attach” button. Your local client and the server will sync up the symbol files, which can take a minute, and then you should be connected to the remote debugger. You’re now free to set breakpoints in your local code which will be hit from the remote execution.
Once you set a breakpoint, open a web browser and navigate to the application on the remote server. When you do, you should hit your breakpoint just as you would if you had launched the program locally.

相关文章推荐
- 安装vs2013 Sqlserver 无法连接远程服务器的解决方法
- Tomcat中设置远程debug方法
- VS 2003使用第三方程序启动不能Debug的解决方法
- 在虚拟机VMware中建立Moodle,然后远程访问的方法
- VS2013/2012 下无法打开 源 文件“stdafx.h”的解决方法
- VS远程调试方法
- VS_2008远程调试方法
- 在VS.NET 2003中建立项目时遇到的两个问题及解决方法
- Hook技术3 建立远程线程的方法
- Error:System.Data.SqlClient.SqlException: 在与 SQL Server 建立连接时出现与网络相关的或特定于实例的错误,请检查远程连接是否开启。解决方法
- 离线安装VS 2013开发工具的方法!
- VS 2005 无法对项目DEBUG的解决方法
- 【Vegas原创】客户端无法建立跟远程计算机的连接解决方法
- Hook技术3 建立远程线程的方法
- 建立可协作远程SVN版本库的几种方法
- 在VS.NET 2003中建立项目时遇到的两个问题及解决方法 (转)
- Tomcat中设置远程debug方法
- vs中debug和release版本的同时编译方法
- VS_2008远程调试方法
- 卸载VS2011 Developer Preview后Sql Server2008 R2建立数据库关系图报“找不到指定的模块”错误的解决方法