Zabbix监控(七):手动监控windows端口
2014-11-24 09:26
330 查看
1、监控端口的几个主要Keys:
说明:Zabbix自带单独服务检测模板,如Template App FTP Service,就是使用的ket.tcp.service[ftp]这个KEY来监控的。
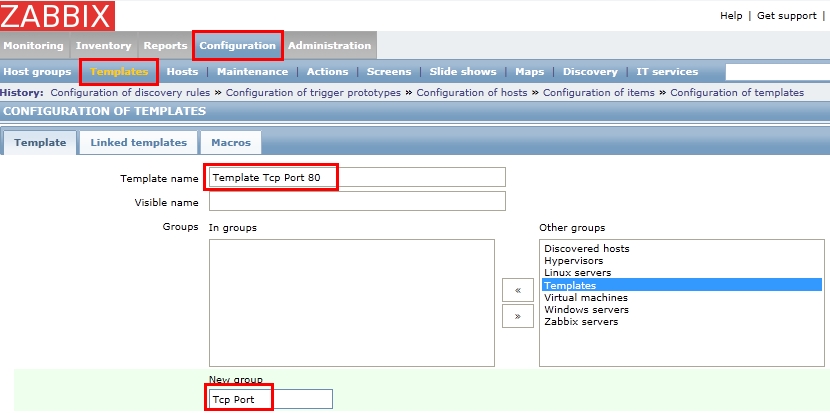
2、创建一组专门用于端口监控的模板
监控80端口的模板,新建一个组Tcp Port
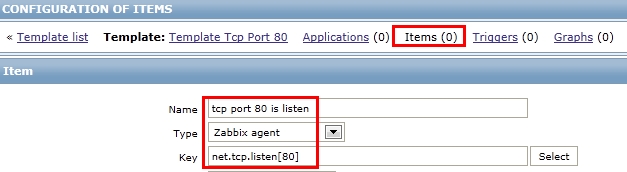
3、在模板中添加Item
添加一个监控80端口是否在Listen状态的Item,使用的KEY是net.tcp.listen[]
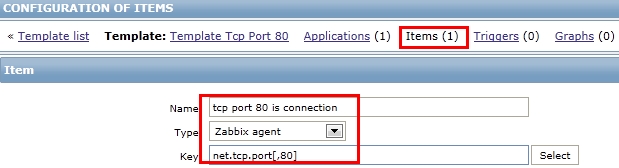
4、添加第二个Item
这个Item使用的KEY是net.tcp.port[],用来检查TCP端口是否可以正常连接
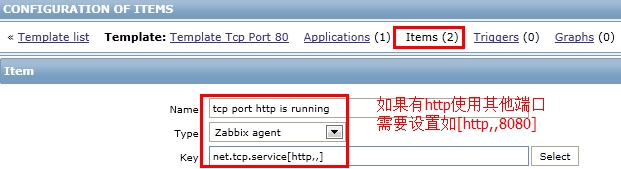
5、添加第三个Item
这个Item使用的KEY是net.tcp.service[],用来监控服务是否可用,不指定端口将检查该服务的默认端口
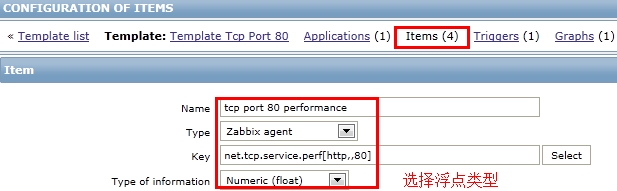
6、添加第四个Item
这个Item使用的KEY是net.tcp.service[],用来监控服务(端口)的连接性能,注意下面的数据类型选择float
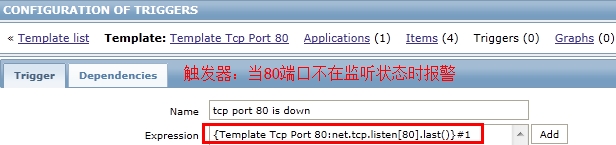
7、给第一个Item创建一个触发器
第一个Item是监控80端口是否在listen状态,返回0表示不在,返回1表示在
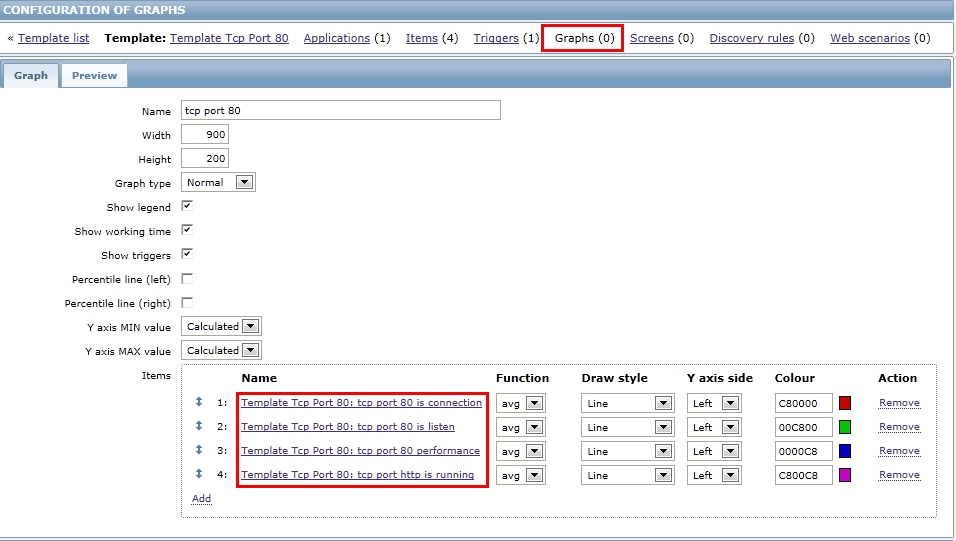
8、在模板中创建一个图像,将4个Items显示在图像中
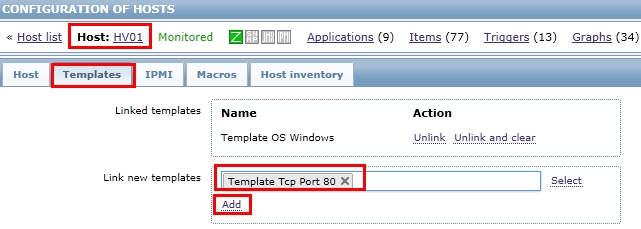
9、将模板Link到监控主机上
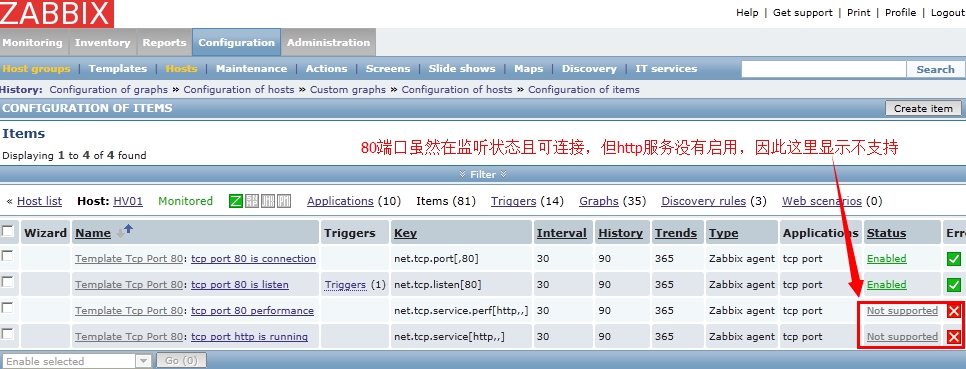
10、主机HV01显示的监控结果
11、主机HV03显示的监控结果
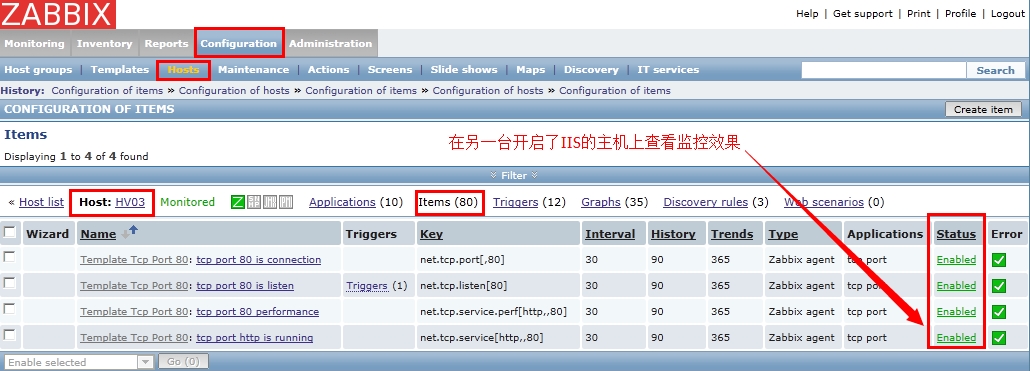
说明:通过以上两图可以看到四个Items的区别与作用
12、主机HV03的监控图像
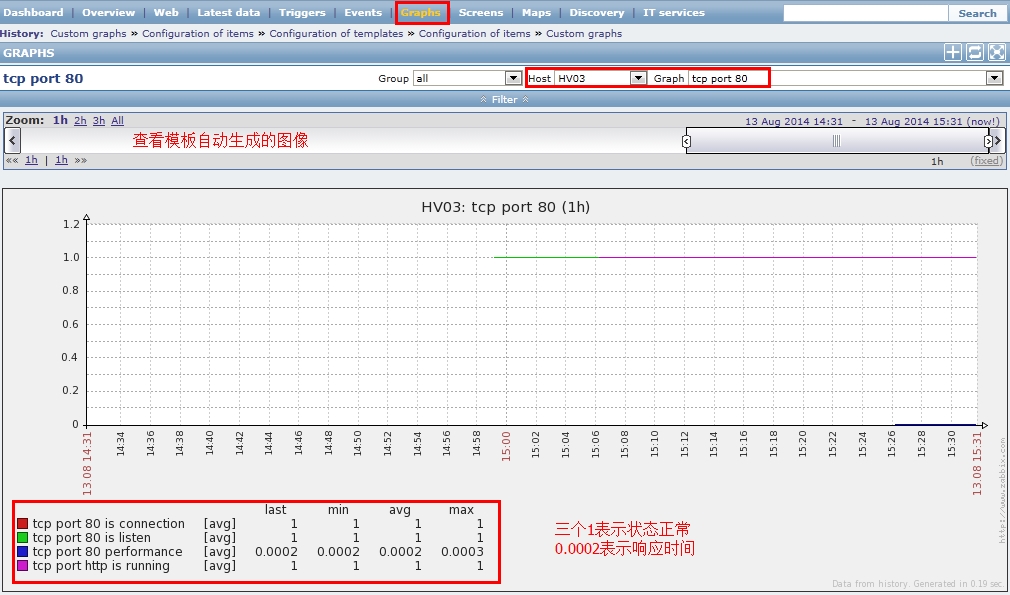
说明:上图反映了四个端口监控Items的状态与数值,performance反映了HV03服务器的80端口连接性能,越小越好。
本文出自 “月晴星飞” 博客,请务必保留此出处/article/4513938.html
| net.tcp.listen[port] | Checks if this port is in LISTEN state. 0 - it is not, 1 - it is in LISTEN state.监控TCP端口是否监听 |
| net.tcp.port[<ip>,port] | Check, if it is possible to make TCP connection to the port number. 0 - cannot connect, 1 - can connect. IP address is optional. If ip is missing, 127.0.0.1 is used. Example: net.tcp.port[,80]检查TCP端口是否可以正常连接。 |
| net.tcp.service[service,<ip>,<port>] | Check if service is available. 0 - service is down, 1 - service is running. If ip is missing 127.0.0.1 is used. If port number is missing, default service port is used. Example: net.tcp.service[ftp,,45].检查服务是否可用,FTP服务可直接使用FTP模板 |
| net.tcp.service.perf[service,<ip>,<port>] | Check performance of service "service". 0 - service is down, sec - number of seconds spent on connection to the service. If ip is missing 127.0.0.1 is used. If port number is missing, default service port is used.监控服务(端口)连接性能 |
| net.udp.listen[port] | Checks if this port is in LISTEN state. 0 - it is not, 1 - it is in LISTEN state.监控UDP端口是否监听(不支持windows) |
2、创建一组专门用于端口监控的模板
监控80端口的模板,新建一个组Tcp Port
3、在模板中添加Item
添加一个监控80端口是否在Listen状态的Item,使用的KEY是net.tcp.listen[]
4、添加第二个Item
这个Item使用的KEY是net.tcp.port[],用来检查TCP端口是否可以正常连接
5、添加第三个Item
这个Item使用的KEY是net.tcp.service[],用来监控服务是否可用,不指定端口将检查该服务的默认端口
6、添加第四个Item
这个Item使用的KEY是net.tcp.service[],用来监控服务(端口)的连接性能,注意下面的数据类型选择float
7、给第一个Item创建一个触发器
第一个Item是监控80端口是否在listen状态,返回0表示不在,返回1表示在
8、在模板中创建一个图像,将4个Items显示在图像中
9、将模板Link到监控主机上
10、主机HV01显示的监控结果
11、主机HV03显示的监控结果
说明:通过以上两图可以看到四个Items的区别与作用
12、主机HV03的监控图像
说明:上图反映了四个端口监控Items的状态与数值,performance反映了HV03服务器的80端口连接性能,越小越好。
本文出自 “月晴星飞” 博客,请务必保留此出处/article/4513938.html

相关文章推荐
- Zabbix监控(七):手动监控windows端口
- zabbix自动监控Linux端口 , 自动和手动监控windows端口 ,zabbix自动监控windows服务
- zabbix自动监控Linux端口 , 自动和手动监控windows端口 ,zabbix自动监控windows服务
- Zabbix监控(八):自动监控windows端口
- zabbix_get, zabbix_sender手动调测监控数据
- zabbix 客户端 监控nginx_status
- zabbix监控
- zabbix JMX监控 tomcat
- 正常用的zabbix服务器进程,包括监控服务器本机
- zabbix开源监控系列二(mysql+redis 模板)
- 深入浅出Zabbix 3.0 -- 第五章 开始监控
- Zabbix Agent active主动模式监控
- Zabbix添加监控项及配置邮件报警
- Zabbix系统端口监控状态
- Zabbix agent自动注册功能实现主机批量监控
- Zabbix3.2监控RabbitMQ
- zabbix tomcat requestCount监控
- zabbix 监控LDAP认证
- zabbix监控windows linux主机 agent的安装方式
- zabbix自定义监控脚本——获取tcp状态之不同命令的响应时间