数字图像处理 边缘特征提取 Image edge detection
2014-09-27 17:29
627 查看
Image edge detection
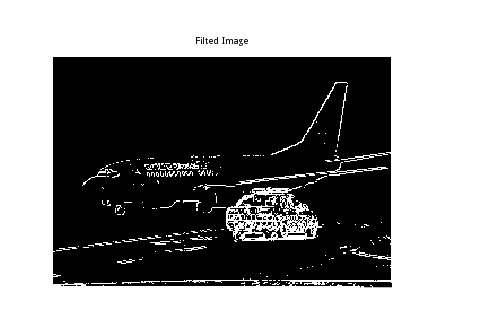
今天听到师姐做报告,接触到了“各种算子” 感觉很有意思~ 图像的线性处理以及边缘检测.下面是一个普通图片,我们可以观察到在图片中有飞机和汽车,在数字图像处理中,边缘特征的提取(说白了就是把图像中物体边缘的坐标点标记出来,没别的)

肿么破捏?
这个时候我们学习的最最简单的数学知识——求导
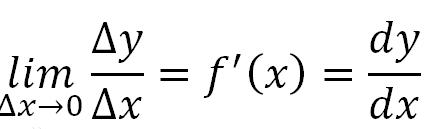
wait wait... 这是连续领域的啊!数字图像信息以离散的数字储存,肿么办?差分!
想想,对于一个点point(x,y) 它周围的点如果都和它的像素值相近或相同,
point(x,y) - point(x+1,y+1) 这样做差分结果是不是接近于0 ? (废话,肯定嘛 \-0-/ )
如果位于物体的边缘情况就变得不同了,这里做差的结果将远离0.
什么,对边缘没概念?来个极端的例子
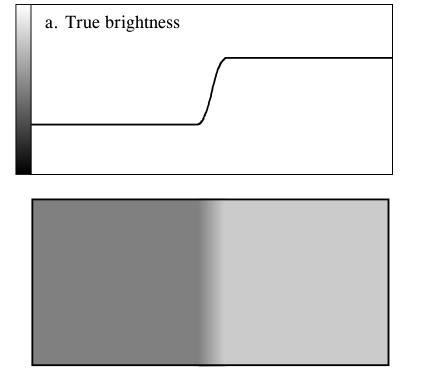
下面图像的像素值随着从左到右的过程在边界处急剧升高!
下面介绍算子 (operator)
operator = [z1 z2 z3;
z4 z5 z6;
z7 z8 z9];
怎么用呢?
对于一副图片Img = [ i1 i2 i3;
i4 i5 i6;
i7 i8 i9];
Filted_img = [ f1 f2 f3;
f4 f5 f6;
f7 f8 f9];
此处省略Img的其他点,f5可以看作是处理之后的图像中的任意一点.
滤波运算操作:
f5 = z1*i1 + z2*i2 + z3*i3 + z4*i4 + z5*i5 + z6*i6
+ z7*i7 + z8*i8 +z9*i9;
用最简单的算子做例子
0 0 0
0 1 0
0 0 0
这个算子对图像做以上介绍的滤波
得到啥?原图!
0 0 0
0 1 0
0 0 -1
这个算子呢?只要稍加阈值
便可检测出边缘部分!
取一定的阈值,大于阈值的赋值为255,小于阈值的赋值为0
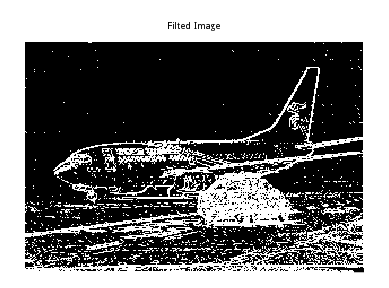
这里阈值我尝试了不同的值
下图是阈值较小时(我取的 5 ),比较敏感,
各种公路上的线条都识别出来了,换个大点的阈值
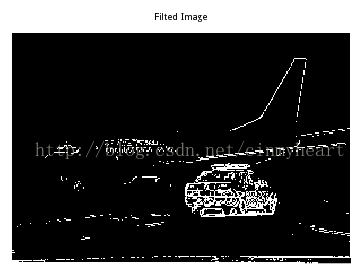
这里换做25的阈值. 我把阈值调到18的时候,效果算比较好的
可以看出这里几乎仅保留了汽车和飞机的轮廓,
但是又丢失了点信息,继续调节阈值
0 0 0
0 1 0
0 0 -1
这个算子很简单,但是效果嘛,不能算很好
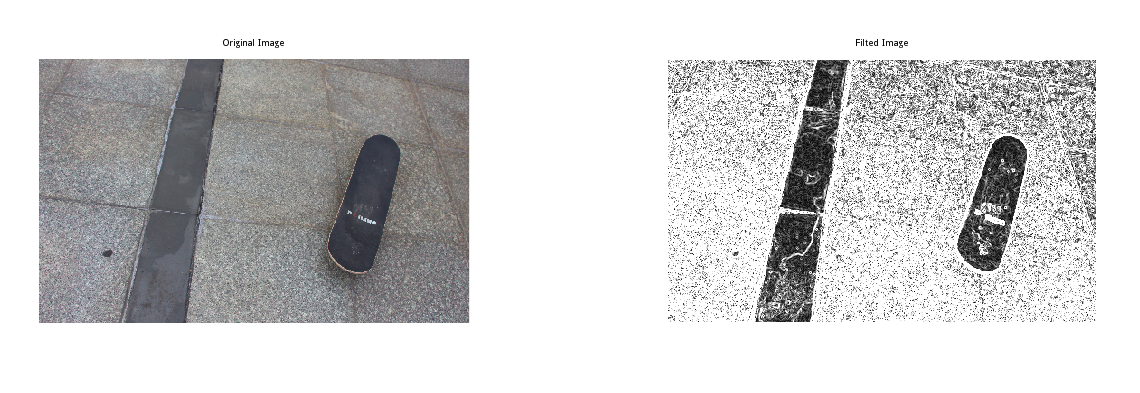
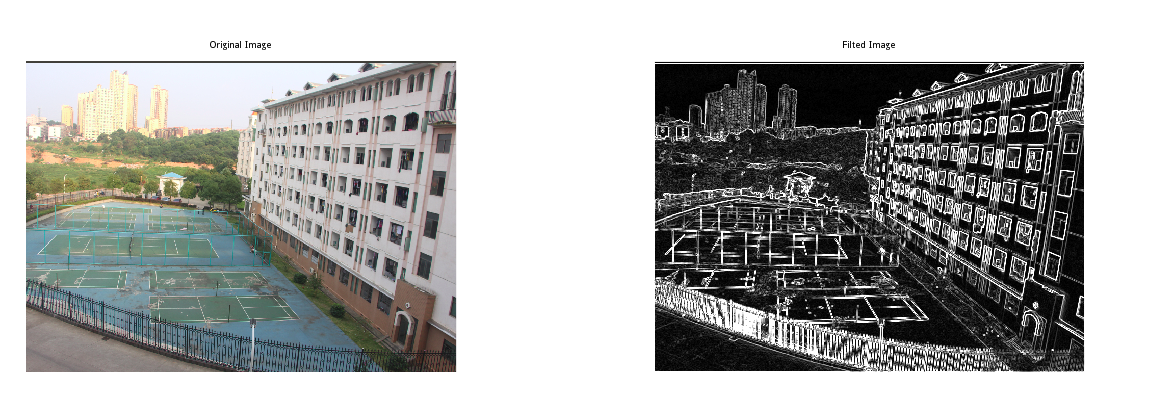
这个时候换个有名的算子——sobel 算子
-1 0 1
-2 0 2
-1 0 1
以及
1 2 1
0 0 0
-1 -2 -1
具体内容还是wiki吧 ,真爱都在wiki : )
注意这里是做卷积!不是做简单的矩阵乘法!别傻...
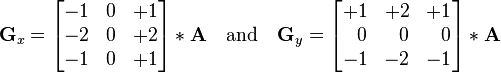
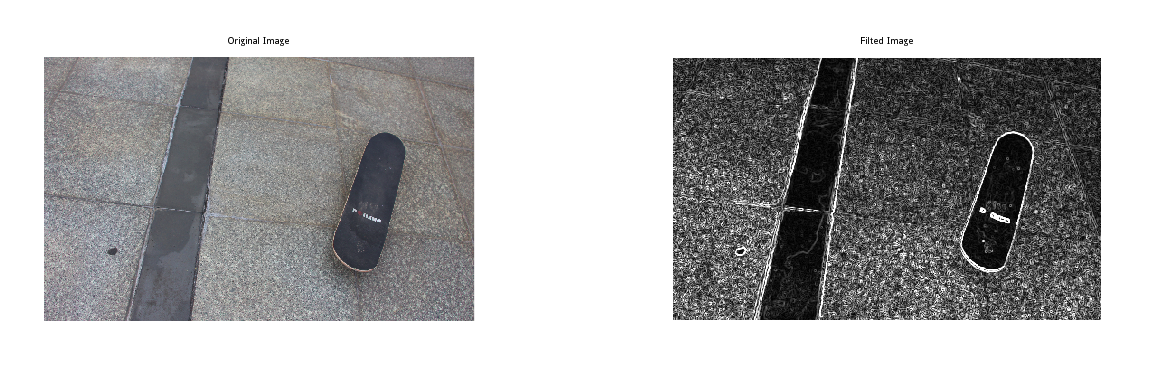
呵呵旁边是我的滑板,地板砖上的细小颗粒的边缘都能检测出来...酷帅
Octave (matlab )实现代码:
%%%%%%%%%%%%%%%%%%%%%%%%%%%%%%%%%%%%%%%%%%%%%%%%%%%%%%%%%%%%%%%
% code writer 	:	EOF
% code date	    :	2014.09.27
% code file	    :	img_filter_sobel.m
% e-mail	      :	jasonleaster@gmail.com
%
%	If there is something wrong with my code, please
% touch me by e-mail. Thank you :)
%
%%%%%%%%%%%%%%%%%%%%%%%%%%%%%%%%%%%%%%%%%%%%%%%%%%%%%%%%%%%%%%

clear all
clc

Original_img = imread('/home/jasonleaster/Picture/building.png');

float_Orignal_img = double(Original_img);

F64_WHITE = 255.0;
F64_BLACK = 0.000;

THRESHOLD = 40;

sobel_operator_X = [-1, 0, 1;-2,0,2;-1, 0, 1];
sobel_operator_Y = [1 , 2, 1; 0,0,0;-1,-2,-1];

Original_img_row 	= size(Original_img,1);
Original_img_col 	= size(Original_img,2);
Original_img_channel 	= size(Original_img,3);

sobel_operator_X_row = size(sobel_operator_X,1);
sobel_operator_X_col = size(sobel_operator_X,2);

sobel_operator_Y_row = size(sobel_operator_Y,1);
sobel_operator_Y_col = size(sobel_operator_Y,2);

dark_channel = zeros(Original_img_row,Original_img_col);
Filted_img   = zeros(Original_img_row,Original_img_col);

for row = 1:Original_img_row

for col = 1:Original_img_col

min_piexl = F64_WHITE;
for channel = 1: Original_img_channel

if(min_piexl > Original_img(row,col,channel))

min_piexl = Original_img(row,col,channel);
end
end

dark_channel(row,col) = min_piexl;
end
end

for row = 1:Original_img_row

for col = 1:Original_img_col

conv_sum_X = 0;
for square_row = (row - floor(sobel_operator_X_row/2)) : (row + floor(sobel_operator_X_row/2))
for square_col = (col - floor(sobel_operator_X_col/2)) : (col + floor(sobel_operator_X_col/2))

if square_row <= Original_img_row && square_col <= Original_img_col && ...
square_row > 0                 && square_col > 0
conv_sum_X = conv_sum_X + ...
dark_channel(square_row,square_col)...
*sobel_operator_X(square_row - (row - floor(sobel_operator_X_row/2)) + 1,square_col - (col - floor(sobel_operator_X_col/2)) + 1);

end
end
end

conv_sum_Y = 0;
for square_row = (row - floor(sobel_operator_Y_row/2)) : (row + floor(sobel_operator_Y_row/2))
for square_col = (col - floor(sobel_operator_Y_col/2)) : (col + floor(sobel_operator_Y_col/2))

if square_row <= Original_img_row && square_col <= Original_img_col && ...
square_row > 0                 && square_col > 0

conv_sum_Y = conv_sum_Y + ...
dark_channel(square_row,square_col)...
*sobel_operator_Y(square_row - (row - floor(sobel_operator_X_row/2)) + 1,square_col - (col - floor(sobel_operator_X_col/2)) + 1);

end
end
end

Filted_img(row,col) = sqrt(conv_sum_X*conv_sum_X +conv_sum_Y*conv_sum_Y);

end
end

figure(1);
subplot(1,2,1);
imshow(Original_img);
title('Original Image')
subplot(1,2,2);
imshow(uint8(Filted_img));
title('Filted Image');
scharr 算子
-3 0 3
-10 0 10
-3 0 3
上面是X方向上的scharr算子
下面是Y方向上的scharr算子
3 10 3
0 0 0
-3 -10 -3
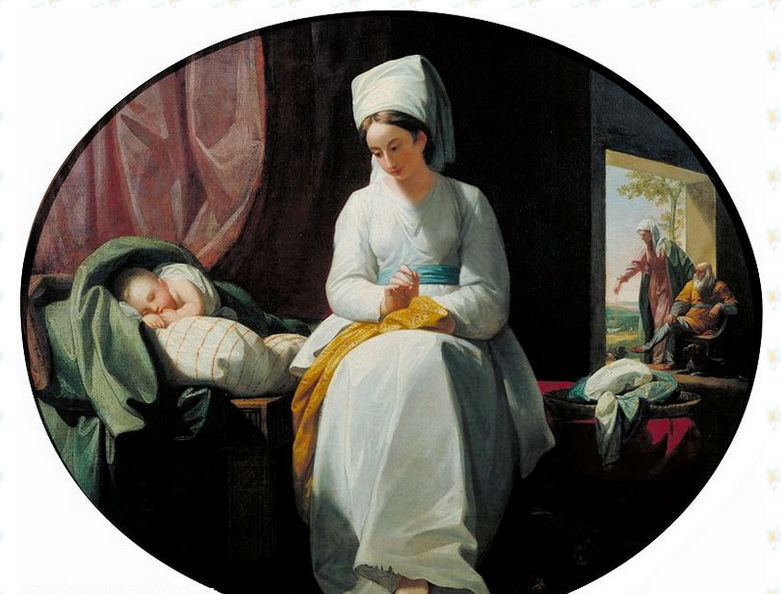
黄金时代 本杰明 美国 布面油画 1776年 654x765cm 私人收藏 纳尔逊-阿特金斯艺术博物馆
这幅被誉为黄金时代(he Golden Age)的画,描绘了母子情深的动人情景。作者本杰明·威斯特(benjamin west 1738-1820年),美国画家,但其大多数作品在伦敦完成。他是第一位赢得国际声誉的美国本土艺术家

相关文章推荐
- A Detailed Review of Feature Extraction in Image Processing Systems图像处理系统中特征提取的详细介绍
- 数字图像处理7--特征提取
- 彩色图像边缘检测--求RGB的最大变化率方向(数字图像处理(Digital Image Processing Second Edition)冈萨雷斯)
- 数字图像处理---有关特征提取的相关概念
- Unity3D图像后处理特效——Edge Detection image effect
- Unity3D图像后处理特效——Edge Detection image effect
- 数字图像处理10--基于特征提取的拼接方法
- 玩玩数字图像处理之边缘提取
- 数字图像处理之特征提取及常用方法
- 【图像处理专题(一)】图像边缘特征提取
- 数字图像处理之边缘检测
- 【数字图像处理】一种求图像边缘的方法
- 【数字图像处理】Canny边缘检测详解及编程实现
- C#数字图像处理有3种典型方法:提取像素法、内存法、指针法。
- 图像特征检测(Image Feature Detection)
- 【数字图像处理】Canny边缘检测详解及编程实现
- 图像特征检测(Image Feature Detection)
- 数字图像处理之边缘检测,图像分割
- 图像特征检测(Image Feature Detection)
- 图像处理特征提取