Centos6.3下zabbix监控mysql数据库参数
2014-09-19 10:15
274 查看
系统环境:centos6.3 x64mysql: mysql-5.6.10zabbix: zabbix-2.06
一.修改mysql客户端zabbix_agentd.conf配置:# vi /usr/local/etc/zabbix_agentd.conf这里注意mysql账号密码与你的数据库账户需对应,还有本脚本获取的是zabbix服务端本地mysql数据库信息,若要获取zabbix客户端信息,请在每行语句mysql或mysqladmin后加 -h"IP"参数,否则无法获取客户端mysql参数信息。例如:UserParameter=mysql.Ping,mysqladmin -uroot -h192.168.7.10 -p123456 ping|grep alive|wc -l末行添加如下内容:-----------------UserParameter=mysql.Ping,mysqladmin -uroot -p123456 ping|grep alive|wc -lUserParameter=mysql.Threads,mysqladmin -uroot -p123456 status|cut -f3 -d":"|cut -f1 -d"Q"UserParameter=mysql.Questions,mysqladmin -uroot -p123456 status|cut -f4 -d":"|cut -f1 -d"S"UserParameter=mysql.Slowqueries,mysqladmin -uroot -p123456 status|cut -f5 -d":"|cut -f1 -d"O"UserParameter=mysql.Qps,mysqladmin -uroot -p123456 status|cut -f9 -d":"
UserParameter=mysql.Slave_IO_State,if [ "$(mysql -uroot -p123456 -e "show slave status\G"| grep Slave_IO_Running|awk '{print $2}')" == "Yes" ];then echo 1; else echo 0;fiUserParameter=mysql.Slave_SQL_State,if [ "$(mysql -uroot -p123456 -e "show slave status\G"| grep Slave_SQL_Running|awk '{print $2}')" == "Yes" ];then echo 1; else echo 0;fi
UserParameter=mysql.Key_buffer_size,mysql -uroot -p123456 -e "show variables like 'key_buffer_size';"| grep -v Value |awk '{print $2/1024^2}'UserParameter=mysql.Key_reads,mysql -uroot -p123456 -e "show status like 'key_reads';"| grep -v Value |awk '{print $2}'UserParameter=mysql.Key_read_requests,mysql -uroot -p123456 -e "show status like 'key_read_requests';"| grep -v Value |awk '{print $2}'UserParameter=mysql.Key_cache_miss_rate,echo $(mysql -uroot -p123456 -e "show status like 'key_reads';"| grep -v Value |awk '{print $2}') $(mysql -uroot -p123456 -e "show status like 'key_read_requests';"| grep -v Value |awk '{print $2}')| awk '{printf("%1.4f\n",$1/$2*100)}'
UserParameter=mysql.Key_blocks_used,mysql -uroot -p123456 -e "show status like 'key_blocks_used';"| grep -v Value |awk '{print $2}'UserParameter=mysql.Key_blocks_unused,mysql -uroot -p123456 -e "show status like 'key_blocks_unused';"| grep -v Value |awk '{print $2}'UserParameter=mysql.Key_blocks_used_rate,echo $(mysql -uroot -p123456 -e "show status like 'key_blocks_used';"| grep -v Value |awk '{print $2}') $(mysql -uroot -p123456 -e "show status like 'key_blocks_unused';"| grep -v Value |awk '{print $2}')| awk '{printf("%1.4f\n",$1/($1+$2)*100)}'
UserParameter=mysql.Innodb_buffer_pool_size,mysql -uroot -p123456 -e "show variables like 'innodb_buffer_pool_size';"| grep -v Value |awk '{print $2/1024^2}'UserParameter=mysql.Innodb_log_file_size,mysql -uroot -p123456 -e "show variables like 'innodb_log_file_size';"| grep -v Value |awk '{print $2/1024^2}'UserParameter=mysql.Innodb_log_buffer_size,mysql -uroot -p123456 -e "show variables like 'innodb_log_buffer_size';"| grep -v Value |awk '{print $2/1024^2}'
UserParameter=mysql.Table_open_cache,mysql -uroot -p123456 -e "show variables like 'table_open_cache';"| grep -v Value |awk '{print $2}'UserParameter=mysql.Open_tables,mysql -uroot -p123456 -e "show status like 'open_tables';"| grep -v Value |awk '{print $2}'UserParameter=mysql.Opened_tables,mysql -uroot -p123456 -e "show status like 'opened_tables';"| grep -v Value |awk '{print $2}'UserParameter=mysql.Open_tables_rate,echo $(mysql -uroot -p123456 -e "show status like 'open_tables';"| grep -v Value |awk '{print $2}') $(mysql -uroot -p123456 -e "show status like 'opened_tables';"| grep -v Value |awk '{print $2}')| awk '{printf("%1.4f\n",$1/($1+$2)*100)}'UserParameter=mysql.Table_open_cache_used_rate,echo $(mysql -uroot -p123456 -e "show status like 'open_tables';"| grep -v Value |awk '{print $2}') $(mysql -uroot -p123456 -e "show variables like 'table_open_cache';"| grep -v Value |awk '{print $2}')| awk '{printf("%1.4f\n",$1/($1+$2)*100)}'
UserParameter=mysql.Thread_cache_size,mysql -uroot -p123456 -e "show variables like 'thread_cache_size';"| grep -v Value |awk '{print $2}'UserParameter=mysql.Threads_cached,mysql -uroot -p123456 -e "show status like 'Threads_cached';"| grep -v Value |awk '{print $2}'UserParameter=mysql.Threads_connected,mysql -uroot -p123456 -e "show status like 'Threads_connected';"| grep -v Value |awk '{print $2}'UserParameter=mysql.Threads_created,mysql -uroot -p123456 -e "show status like 'Threads_created';"| grep -v Value |awk '{print $2}'UserParameter=mysql.Threads_running,mysql -uroot -p123456 -e "show status like 'Threads_running';"| grep -v Value |awk '{print $2}'
UserParameter=mysql.Qcache_free_blocks,mysql -uroot -p123456 -e "show status like 'Qcache_free_blocks';"| grep -v Value |awk '{print $2}'UserParameter=mysql.Qcache_free_memory,mysql -uroot -p123456 -e "show status like 'Qcache_free_memory';"| grep -v Value |awk '{print $2}'UserParameter=mysql.Qcache_hits,mysql -uroot -p123456 -e "show status like 'Qcache_hits';"| grep -v Value |awk '{print $2}'UserParameter=mysql.Qcache_inserts,mysql -uroot -p123456 -e "show status like 'Qcache_inserts';"| grep -v Value |awk '{print $2}'UserParameter=mysql.Qcache_lowmem_prunes,mysql -uroot -p123456 -e "show status like 'Qcache_lowmem_prunes';"| grep -v Value |awk '{print $2}'UserParameter=mysql.Qcache_not_cached,mysql -uroot -p123456 -e "show status like 'Qcache_not_cached';"| grep -v Value |awk '{print $2}'UserParameter=mysql.Qcache_queries_in_cache,mysql -uroot -p123456 -e "show status like 'Qcache_queries_in_cache';"| grep -v Value |awk '{print $2}'UserParameter=mysql.Qcache_total_blocks,mysql -uroot -p123456 -e "show status like 'Qcache_total_blocks';"| grep -v Value |awk '{print $2}'UserParameter=mysql.Qcache_fragment_rate,echo $(mysql -uroot -p123456 -e "show status like 'Qcache_free_blocks';"| grep -v Value |awk '{print $2}') $(mysql -uroot -p123456 -e "show status like 'Qcache_total_blocks';"| grep -v Value |awk '{print $2}')| awk '{printf("%1.4f\n",$1/$2*100)}'UserParameter=mysql.Qcache_used_rate,echo $(mysql -uroot -p123456 -e "show variables like 'query_cache_size';"| grep -v Value |awk '{print $2}') $(mysql -uroot -p123456 -e "show status like 'Qcache_free_memory';"| grep -v Value |awk '{print $2}')| awk '{printf("%1.4f\n",($1-$2)/$1*100)}'UserParameter=mysql.Qcache_hits_rate,echo $(mysql -uroot -p123456 -e "show status like 'Qcache_hits';"| grep -v Value |awk '{print $2}') $(mysql -uroot -p123456 -e "show status like 'Qcache_inserts';"| grep -v Value |awk '{print $2}')| awk '{printf("%1.4f\n",($1-$2)/$1*100)}'
UserParameter=mysql.Query_cache_limit,mysql -uroot -p123456 -e "show variables like 'query_cache_limit';"| grep -v Value |awk '{print $2}'UserParameter=mysql.Query_cache_min_res_unit,mysql -uroot -p123456 -e "show variables like 'query_cache_min_res_unit';"| grep -v Value |awk '{print $2}'UserParameter=mysql.Query_cache_size,mysql -uroot -p123456 -e "show variables like 'query_cache_size';"| grep -v Value |awk '{print $2}'
UserParameter=mysql.Sort_merge_passes,mysql -uroot -p123456 -e "show status like 'Sort_merge_passes';"| grep -v Value |awk '{print $2}'UserParameter=mysql.Sort_range,mysql -uroot -p123456 -e "show status like 'Sort_range';"| grep -v Value |awk '{print $2}'UserParameter=mysql.Sort_rows,mysql -uroot -p123456 -e "show status like 'Sort_rows';"| grep -v Value |awk '{print $2}'UserParameter=mysql.Sort_scan,mysql -uroot -p123456 -e "show status like 'Sort_scan';"| grep -v Value |awk '{print $2}'
UserParameter=mysql.Handler_read_first,mysql -uroot -p123456 -e "show status like 'Handler_read_first';"| grep -v Value |awk '{print $2}'UserParameter=mysql.Handler_read_key,mysql -uroot -p123456 -e "show status like 'Handler_read_key';"| grep -v Value |awk '{print $2}'UserParameter=mysql.Handler_read_next,mysql -uroot -p123456 -e "show status like 'Handler_read_next';"| grep -v Value |awk '{print $2}'UserParameter=mysql.Handler_read_prev,mysql -uroot -p123456 -e "show status like 'Handler_read_prev';"| grep -v Value |awk '{print $2}'UserParameter=mysql.Handler_read_rnd,mysql -uroot -p123456 -e "show status like 'Handler_read_rnd';"| grep -v Value |awk '{print $2}'UserParameter=mysql.Handler_read_rnd_next,mysql -uroot -p123456 -e "show status like 'Handler_read_rnd_next';"| grep -v Value |awk '{print $2}'
UserParameter=mysql.Com_select,mysql -uroot -p123456 -e "show status like 'com_select';"| grep -v Value |awk '{print $2}'UserParameter=mysql.Com_insert,mysql -uroot -p123456 -e "show status like 'com_insert';"| grep -v Value |awk '{print $2}'UserParameter=mysql.Com_insert_select,mysql -uroot -p123456 -e "show status like 'com_insert_select';"| grep -v Value |awk '{print $2}'UserParameter=mysql.Com_update,mysql -uroot -p123456 -e "show status like 'com_update';"| grep -v Value |awk '{print $2}'UserParameter=mysql.Com_replace,mysql -uroot -p123456 -e "show status like 'com_replace';"| grep -v Value |awk '{print $2}'UserParameter=mysql.Com_replace_select,mysql -uroot -p123456 -e "show status like 'com_replace_select';"| grep -v Value |awk '{print $2}'UserParameter=mysql.Table_scan_rate,echo $(mysql -uroot -p123456 -e "show status like 'Handler_read_rnd_next';"| grep -v Value |awk '{print $2}') $(mysql -uroot -p123456 -e "show status like 'com_select';"| grep -v Value |awk '{print $2}')| awk '{printf("%1.4f\n",$1/$2*100)}'
UserParameter=mysql.Open_files,mysql -uroot -p123456 -e "show status like 'open_files';"| grep -v Value |awk '{print $2}'UserParameter=mysql.Open_files_limit,mysql -uroot -p123456 -e "show variables like 'open_files_limit';"| grep -v Value |awk '{print $2}'UserParameter=mysql.Open_files_rate,echo $(mysql -uroot -p123456 -e "show status like 'open_files';"| grep -v Value |awk '{print $2}') $(mysql -uroot -p123456 -e "show variables like 'open_files_limit';"| grep -v Value |awk '{print $2}')| awk '{printf("%1.4f\n",$1/$2*100)}'
UserParameter=mysql.Created_tmp_disk_tables,mysql -uroot -p123456 -e "show status like 'created_tmp_disk_tables';"| grep -v Value |awk '{print $2}'UserParameter=mysql.Created_tmp_tables,mysql -uroot -p123456 -e "show status like 'created_tmp_tables';"| grep -v Value |awk '{print $2}'UserParameter=mysql.Created_tmp_disk_tables_rate,echo $(mysql -uroot -p123456 -e "show status like 'created_tmp_disk_tables';"| grep -v Value |awk '{print $2}') $(mysql -uroot -p123456 -e "show status like 'created_tmp_tables';"| grep -v Value |awk '{print $2}')| awk '{printf("%1.4f\n",$1/$2*100)}'
UserParameter=mysql.Max_connections,mysql -uroot -p123456 -e "show variables like 'max_connections';"| grep -v Value |awk '{print $2}'UserParameter=mysql.Max_used_connections,mysql -uroot -p123456 -e "show status like 'Max_used_connections';"| grep -v Value |awk '{print $2}'UserParameter=mysql.Max_connections_used_rate,echo $(mysql -uroot -p123456 -e "show status like 'Max_used_connections';"| grep -v Value |awk '{print $2}') $(mysql -uroot -p123456 -e "show variables like 'max_connections';"| grep -v Value |awk '{print $2}')| awk '{printf("%1.4f\n",$1/$2*100)}'
UserParameter=mysql.Table_locks_immediate,mysql -uroot -p123456 -e "show status like 'Table_locks_immediate';"| grep -v Value |awk '{print $2}'UserParameter=mysql.Table_locks_waited,mysql -uroot -p123456 -e "show status like 'table_locks_waited';"| grep -v Value |awk '{print $2}'UserParameter=mysql.Engine_select,echo $(mysql -uroot -p123456 -e "show status like 'Table_locks_immediate';"| grep -v Value |awk '{print $2}') $(mysql -uroot -p123456 -e "show status like 'table_locks_waited';"| grep -v Value |awk '{print $2}')| awk '{printf("%5.4f\n",$1/$2)}'
-------------------
二.访问zabbix web后台导入模板
1.访问zabbix-配置-模板,点击右上角的载入:
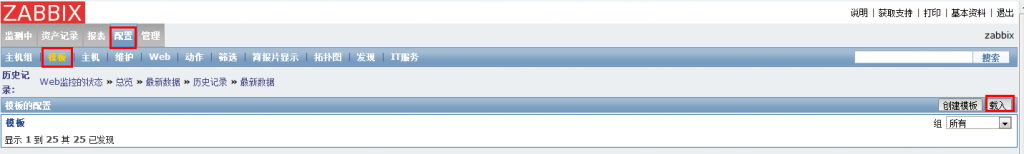
2.本地导入文件:下载本博附件mysql_template.xml文件导入zabbix模板,点击载入保存

3.访问zabbix-配置-模板,查看模板:

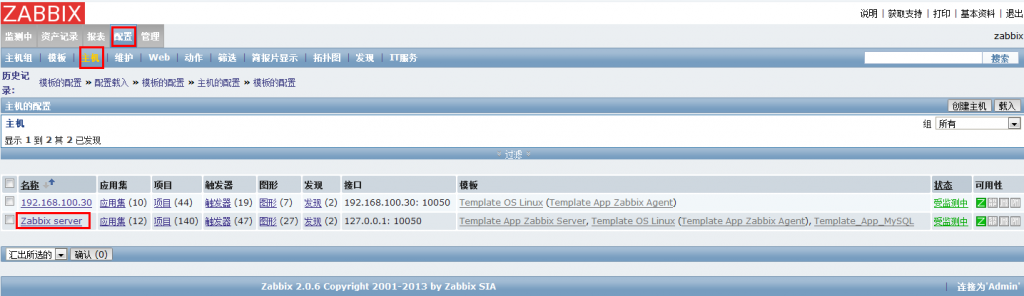
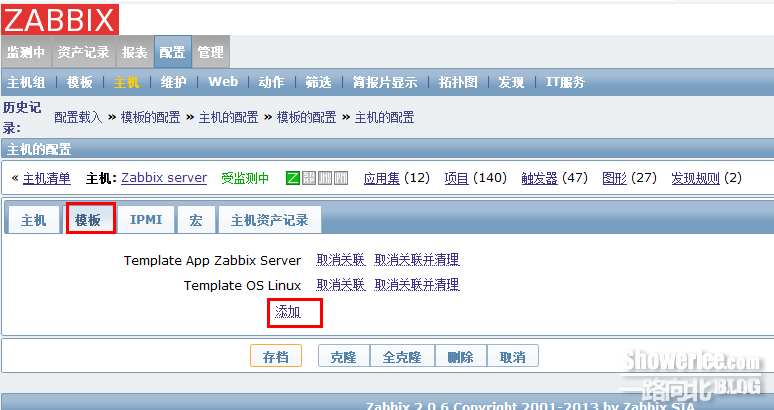
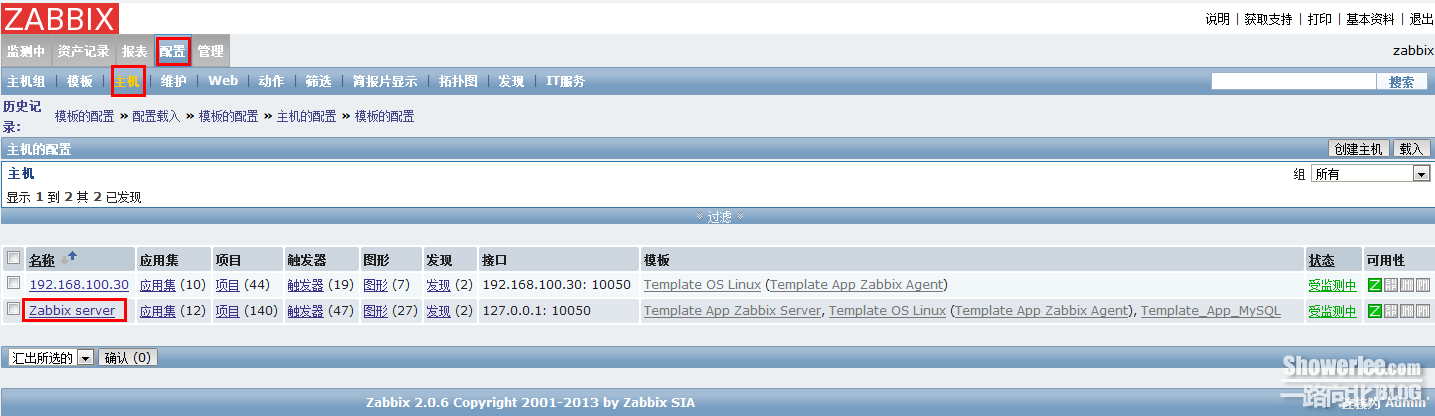
4.访问zabbix-配置-主机-Zabbix server,找到mysql客户端关联mysql_template.xml模版:

重启zabbix_agentd服务# /etc/init.d/zabbix_agentd restart
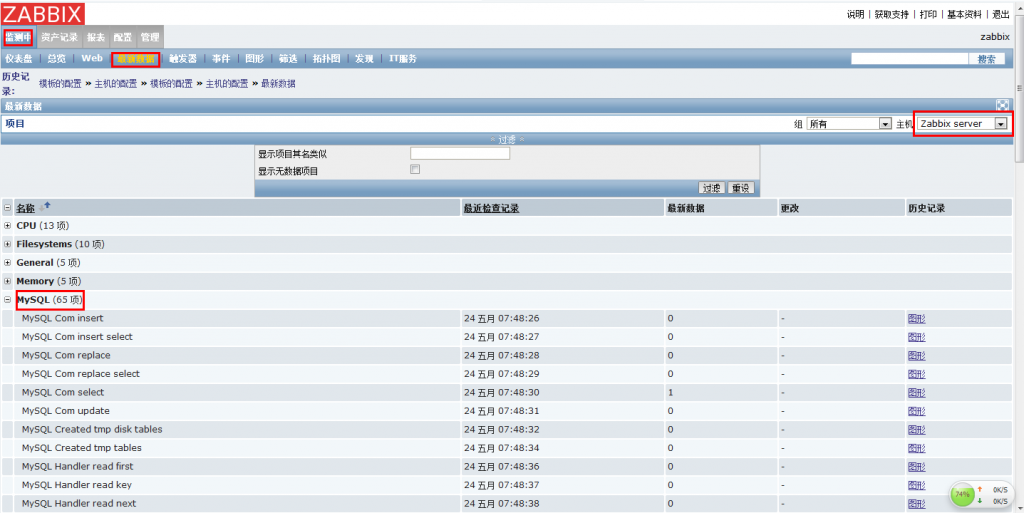
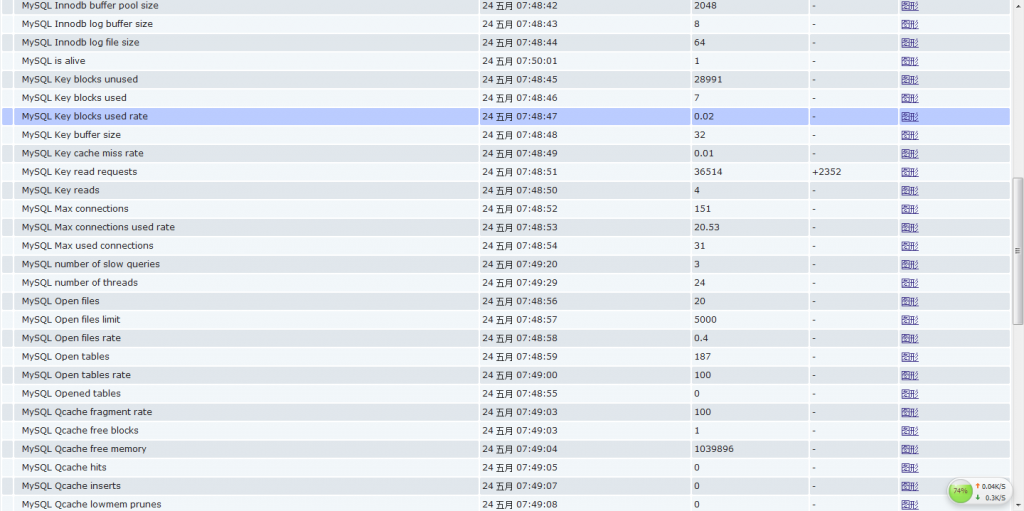
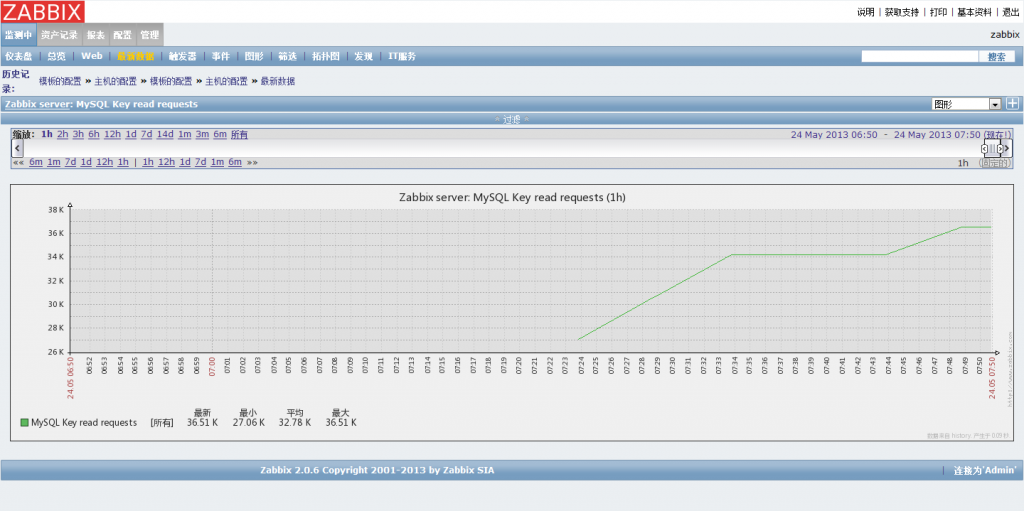
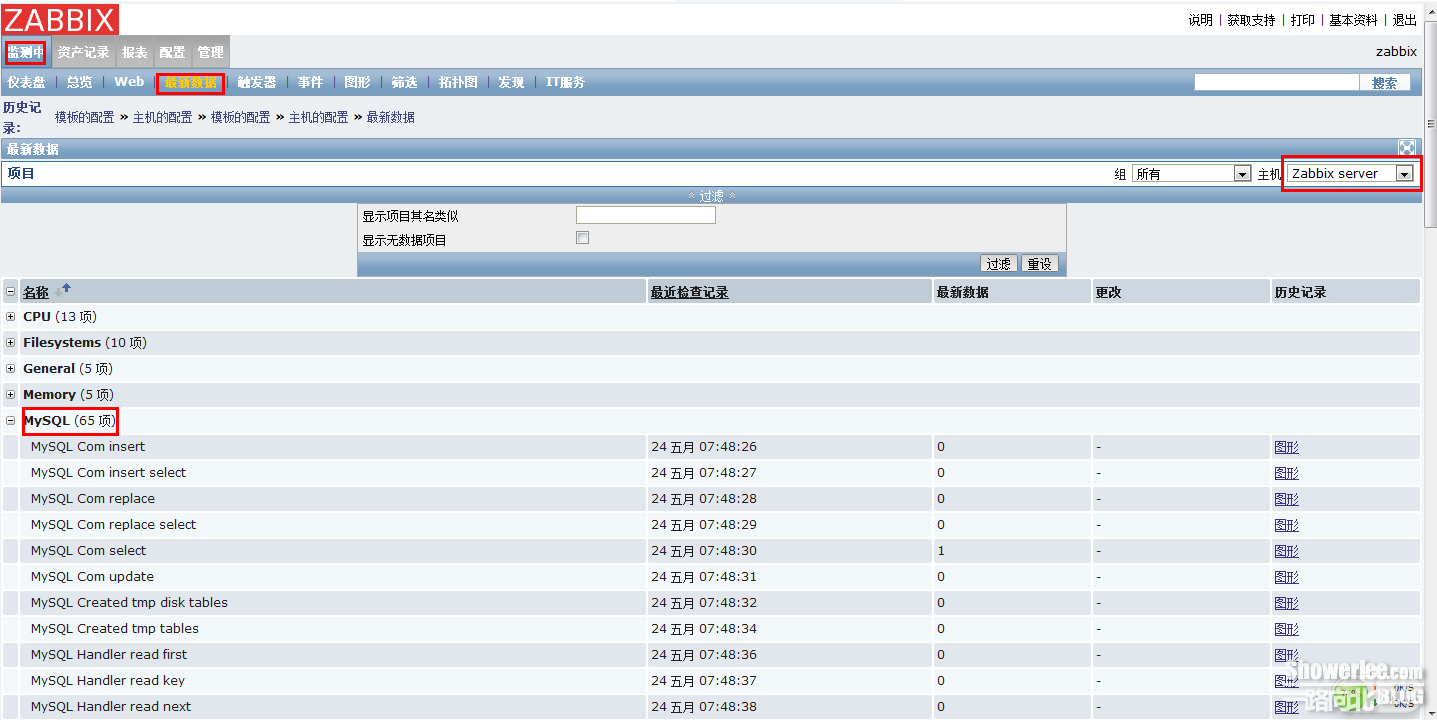
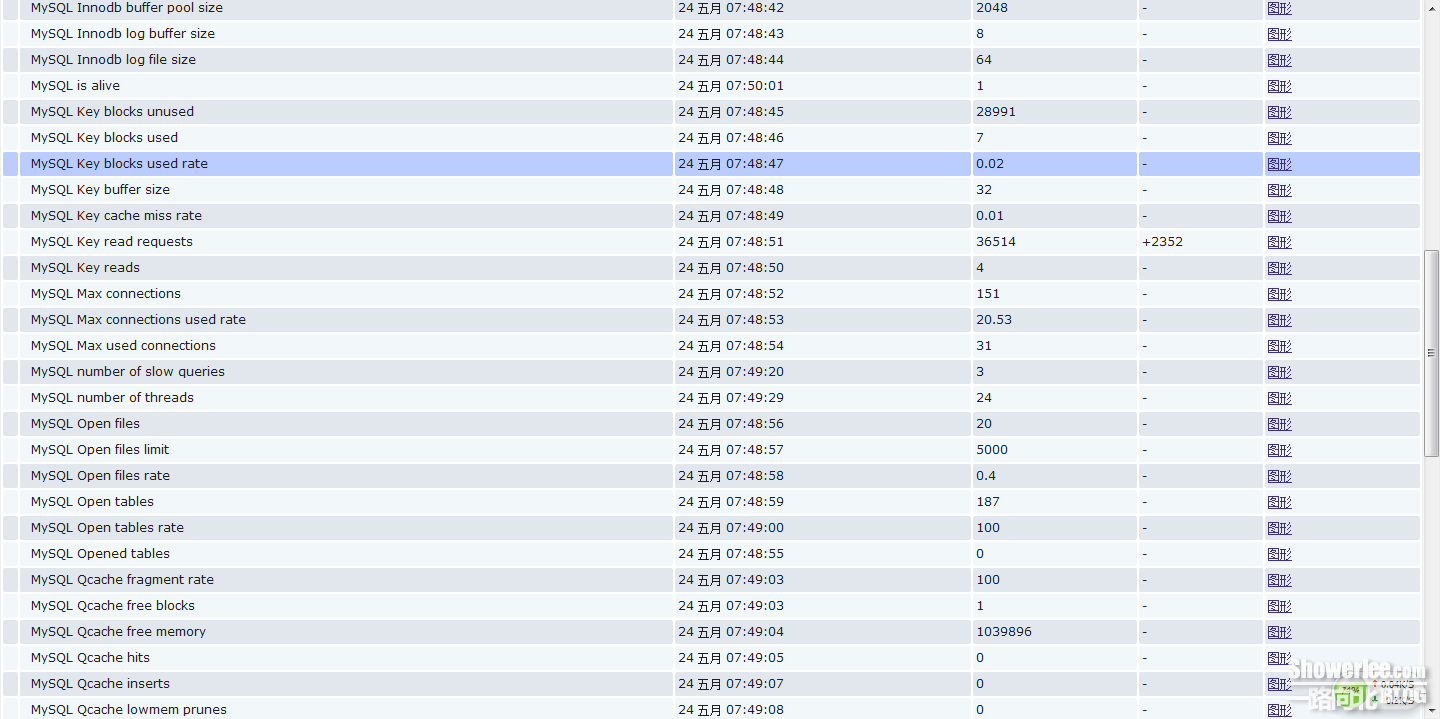
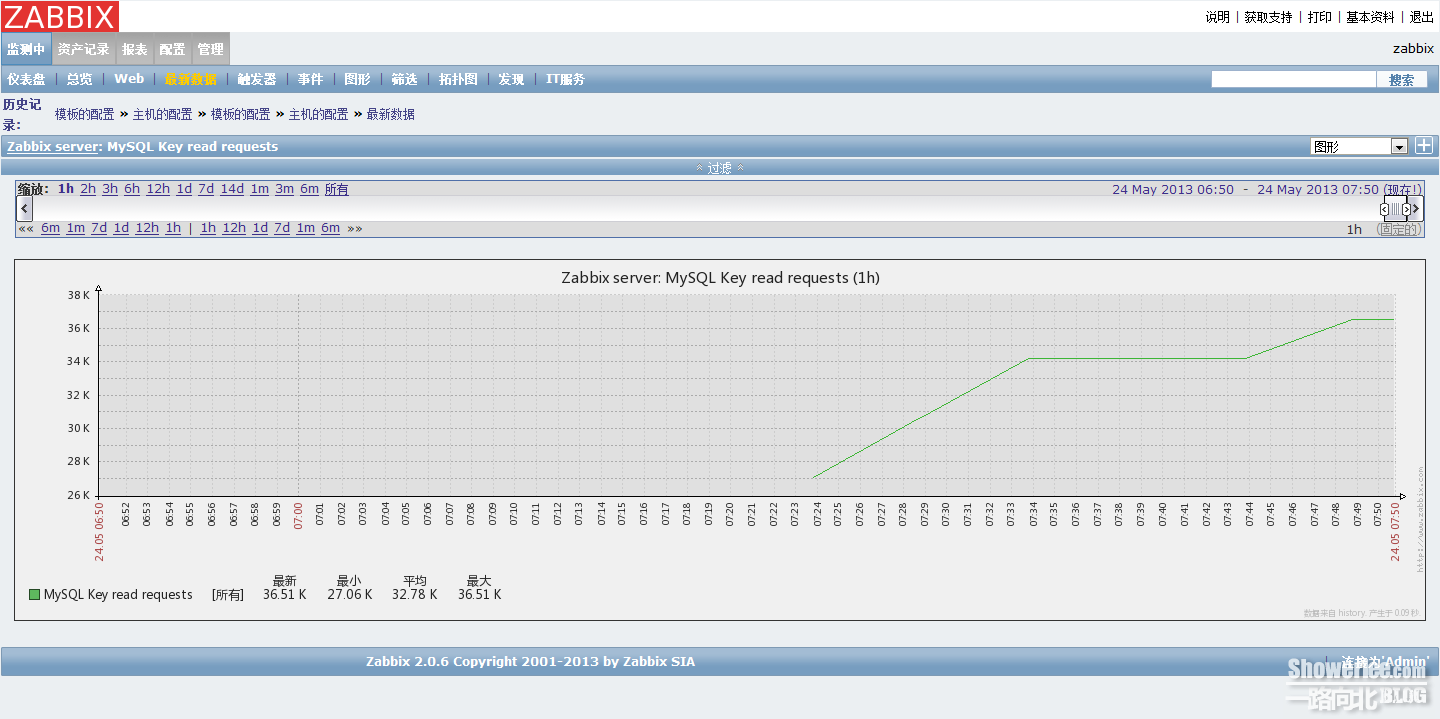
添加完毕,查看效果
附件下载:mysql模板 zabbix agent配置文件
一.修改mysql客户端zabbix_agentd.conf配置:# vi /usr/local/etc/zabbix_agentd.conf这里注意mysql账号密码与你的数据库账户需对应,还有本脚本获取的是zabbix服务端本地mysql数据库信息,若要获取zabbix客户端信息,请在每行语句mysql或mysqladmin后加 -h"IP"参数,否则无法获取客户端mysql参数信息。例如:UserParameter=mysql.Ping,mysqladmin -uroot -h192.168.7.10 -p123456 ping|grep alive|wc -l末行添加如下内容:-----------------UserParameter=mysql.Ping,mysqladmin -uroot -p123456 ping|grep alive|wc -lUserParameter=mysql.Threads,mysqladmin -uroot -p123456 status|cut -f3 -d":"|cut -f1 -d"Q"UserParameter=mysql.Questions,mysqladmin -uroot -p123456 status|cut -f4 -d":"|cut -f1 -d"S"UserParameter=mysql.Slowqueries,mysqladmin -uroot -p123456 status|cut -f5 -d":"|cut -f1 -d"O"UserParameter=mysql.Qps,mysqladmin -uroot -p123456 status|cut -f9 -d":"
UserParameter=mysql.Slave_IO_State,if [ "$(mysql -uroot -p123456 -e "show slave status\G"| grep Slave_IO_Running|awk '{print $2}')" == "Yes" ];then echo 1; else echo 0;fiUserParameter=mysql.Slave_SQL_State,if [ "$(mysql -uroot -p123456 -e "show slave status\G"| grep Slave_SQL_Running|awk '{print $2}')" == "Yes" ];then echo 1; else echo 0;fi
UserParameter=mysql.Key_buffer_size,mysql -uroot -p123456 -e "show variables like 'key_buffer_size';"| grep -v Value |awk '{print $2/1024^2}'UserParameter=mysql.Key_reads,mysql -uroot -p123456 -e "show status like 'key_reads';"| grep -v Value |awk '{print $2}'UserParameter=mysql.Key_read_requests,mysql -uroot -p123456 -e "show status like 'key_read_requests';"| grep -v Value |awk '{print $2}'UserParameter=mysql.Key_cache_miss_rate,echo $(mysql -uroot -p123456 -e "show status like 'key_reads';"| grep -v Value |awk '{print $2}') $(mysql -uroot -p123456 -e "show status like 'key_read_requests';"| grep -v Value |awk '{print $2}')| awk '{printf("%1.4f\n",$1/$2*100)}'
UserParameter=mysql.Key_blocks_used,mysql -uroot -p123456 -e "show status like 'key_blocks_used';"| grep -v Value |awk '{print $2}'UserParameter=mysql.Key_blocks_unused,mysql -uroot -p123456 -e "show status like 'key_blocks_unused';"| grep -v Value |awk '{print $2}'UserParameter=mysql.Key_blocks_used_rate,echo $(mysql -uroot -p123456 -e "show status like 'key_blocks_used';"| grep -v Value |awk '{print $2}') $(mysql -uroot -p123456 -e "show status like 'key_blocks_unused';"| grep -v Value |awk '{print $2}')| awk '{printf("%1.4f\n",$1/($1+$2)*100)}'
UserParameter=mysql.Innodb_buffer_pool_size,mysql -uroot -p123456 -e "show variables like 'innodb_buffer_pool_size';"| grep -v Value |awk '{print $2/1024^2}'UserParameter=mysql.Innodb_log_file_size,mysql -uroot -p123456 -e "show variables like 'innodb_log_file_size';"| grep -v Value |awk '{print $2/1024^2}'UserParameter=mysql.Innodb_log_buffer_size,mysql -uroot -p123456 -e "show variables like 'innodb_log_buffer_size';"| grep -v Value |awk '{print $2/1024^2}'
UserParameter=mysql.Table_open_cache,mysql -uroot -p123456 -e "show variables like 'table_open_cache';"| grep -v Value |awk '{print $2}'UserParameter=mysql.Open_tables,mysql -uroot -p123456 -e "show status like 'open_tables';"| grep -v Value |awk '{print $2}'UserParameter=mysql.Opened_tables,mysql -uroot -p123456 -e "show status like 'opened_tables';"| grep -v Value |awk '{print $2}'UserParameter=mysql.Open_tables_rate,echo $(mysql -uroot -p123456 -e "show status like 'open_tables';"| grep -v Value |awk '{print $2}') $(mysql -uroot -p123456 -e "show status like 'opened_tables';"| grep -v Value |awk '{print $2}')| awk '{printf("%1.4f\n",$1/($1+$2)*100)}'UserParameter=mysql.Table_open_cache_used_rate,echo $(mysql -uroot -p123456 -e "show status like 'open_tables';"| grep -v Value |awk '{print $2}') $(mysql -uroot -p123456 -e "show variables like 'table_open_cache';"| grep -v Value |awk '{print $2}')| awk '{printf("%1.4f\n",$1/($1+$2)*100)}'
UserParameter=mysql.Thread_cache_size,mysql -uroot -p123456 -e "show variables like 'thread_cache_size';"| grep -v Value |awk '{print $2}'UserParameter=mysql.Threads_cached,mysql -uroot -p123456 -e "show status like 'Threads_cached';"| grep -v Value |awk '{print $2}'UserParameter=mysql.Threads_connected,mysql -uroot -p123456 -e "show status like 'Threads_connected';"| grep -v Value |awk '{print $2}'UserParameter=mysql.Threads_created,mysql -uroot -p123456 -e "show status like 'Threads_created';"| grep -v Value |awk '{print $2}'UserParameter=mysql.Threads_running,mysql -uroot -p123456 -e "show status like 'Threads_running';"| grep -v Value |awk '{print $2}'
UserParameter=mysql.Qcache_free_blocks,mysql -uroot -p123456 -e "show status like 'Qcache_free_blocks';"| grep -v Value |awk '{print $2}'UserParameter=mysql.Qcache_free_memory,mysql -uroot -p123456 -e "show status like 'Qcache_free_memory';"| grep -v Value |awk '{print $2}'UserParameter=mysql.Qcache_hits,mysql -uroot -p123456 -e "show status like 'Qcache_hits';"| grep -v Value |awk '{print $2}'UserParameter=mysql.Qcache_inserts,mysql -uroot -p123456 -e "show status like 'Qcache_inserts';"| grep -v Value |awk '{print $2}'UserParameter=mysql.Qcache_lowmem_prunes,mysql -uroot -p123456 -e "show status like 'Qcache_lowmem_prunes';"| grep -v Value |awk '{print $2}'UserParameter=mysql.Qcache_not_cached,mysql -uroot -p123456 -e "show status like 'Qcache_not_cached';"| grep -v Value |awk '{print $2}'UserParameter=mysql.Qcache_queries_in_cache,mysql -uroot -p123456 -e "show status like 'Qcache_queries_in_cache';"| grep -v Value |awk '{print $2}'UserParameter=mysql.Qcache_total_blocks,mysql -uroot -p123456 -e "show status like 'Qcache_total_blocks';"| grep -v Value |awk '{print $2}'UserParameter=mysql.Qcache_fragment_rate,echo $(mysql -uroot -p123456 -e "show status like 'Qcache_free_blocks';"| grep -v Value |awk '{print $2}') $(mysql -uroot -p123456 -e "show status like 'Qcache_total_blocks';"| grep -v Value |awk '{print $2}')| awk '{printf("%1.4f\n",$1/$2*100)}'UserParameter=mysql.Qcache_used_rate,echo $(mysql -uroot -p123456 -e "show variables like 'query_cache_size';"| grep -v Value |awk '{print $2}') $(mysql -uroot -p123456 -e "show status like 'Qcache_free_memory';"| grep -v Value |awk '{print $2}')| awk '{printf("%1.4f\n",($1-$2)/$1*100)}'UserParameter=mysql.Qcache_hits_rate,echo $(mysql -uroot -p123456 -e "show status like 'Qcache_hits';"| grep -v Value |awk '{print $2}') $(mysql -uroot -p123456 -e "show status like 'Qcache_inserts';"| grep -v Value |awk '{print $2}')| awk '{printf("%1.4f\n",($1-$2)/$1*100)}'
UserParameter=mysql.Query_cache_limit,mysql -uroot -p123456 -e "show variables like 'query_cache_limit';"| grep -v Value |awk '{print $2}'UserParameter=mysql.Query_cache_min_res_unit,mysql -uroot -p123456 -e "show variables like 'query_cache_min_res_unit';"| grep -v Value |awk '{print $2}'UserParameter=mysql.Query_cache_size,mysql -uroot -p123456 -e "show variables like 'query_cache_size';"| grep -v Value |awk '{print $2}'
UserParameter=mysql.Sort_merge_passes,mysql -uroot -p123456 -e "show status like 'Sort_merge_passes';"| grep -v Value |awk '{print $2}'UserParameter=mysql.Sort_range,mysql -uroot -p123456 -e "show status like 'Sort_range';"| grep -v Value |awk '{print $2}'UserParameter=mysql.Sort_rows,mysql -uroot -p123456 -e "show status like 'Sort_rows';"| grep -v Value |awk '{print $2}'UserParameter=mysql.Sort_scan,mysql -uroot -p123456 -e "show status like 'Sort_scan';"| grep -v Value |awk '{print $2}'
UserParameter=mysql.Handler_read_first,mysql -uroot -p123456 -e "show status like 'Handler_read_first';"| grep -v Value |awk '{print $2}'UserParameter=mysql.Handler_read_key,mysql -uroot -p123456 -e "show status like 'Handler_read_key';"| grep -v Value |awk '{print $2}'UserParameter=mysql.Handler_read_next,mysql -uroot -p123456 -e "show status like 'Handler_read_next';"| grep -v Value |awk '{print $2}'UserParameter=mysql.Handler_read_prev,mysql -uroot -p123456 -e "show status like 'Handler_read_prev';"| grep -v Value |awk '{print $2}'UserParameter=mysql.Handler_read_rnd,mysql -uroot -p123456 -e "show status like 'Handler_read_rnd';"| grep -v Value |awk '{print $2}'UserParameter=mysql.Handler_read_rnd_next,mysql -uroot -p123456 -e "show status like 'Handler_read_rnd_next';"| grep -v Value |awk '{print $2}'
UserParameter=mysql.Com_select,mysql -uroot -p123456 -e "show status like 'com_select';"| grep -v Value |awk '{print $2}'UserParameter=mysql.Com_insert,mysql -uroot -p123456 -e "show status like 'com_insert';"| grep -v Value |awk '{print $2}'UserParameter=mysql.Com_insert_select,mysql -uroot -p123456 -e "show status like 'com_insert_select';"| grep -v Value |awk '{print $2}'UserParameter=mysql.Com_update,mysql -uroot -p123456 -e "show status like 'com_update';"| grep -v Value |awk '{print $2}'UserParameter=mysql.Com_replace,mysql -uroot -p123456 -e "show status like 'com_replace';"| grep -v Value |awk '{print $2}'UserParameter=mysql.Com_replace_select,mysql -uroot -p123456 -e "show status like 'com_replace_select';"| grep -v Value |awk '{print $2}'UserParameter=mysql.Table_scan_rate,echo $(mysql -uroot -p123456 -e "show status like 'Handler_read_rnd_next';"| grep -v Value |awk '{print $2}') $(mysql -uroot -p123456 -e "show status like 'com_select';"| grep -v Value |awk '{print $2}')| awk '{printf("%1.4f\n",$1/$2*100)}'
UserParameter=mysql.Open_files,mysql -uroot -p123456 -e "show status like 'open_files';"| grep -v Value |awk '{print $2}'UserParameter=mysql.Open_files_limit,mysql -uroot -p123456 -e "show variables like 'open_files_limit';"| grep -v Value |awk '{print $2}'UserParameter=mysql.Open_files_rate,echo $(mysql -uroot -p123456 -e "show status like 'open_files';"| grep -v Value |awk '{print $2}') $(mysql -uroot -p123456 -e "show variables like 'open_files_limit';"| grep -v Value |awk '{print $2}')| awk '{printf("%1.4f\n",$1/$2*100)}'
UserParameter=mysql.Created_tmp_disk_tables,mysql -uroot -p123456 -e "show status like 'created_tmp_disk_tables';"| grep -v Value |awk '{print $2}'UserParameter=mysql.Created_tmp_tables,mysql -uroot -p123456 -e "show status like 'created_tmp_tables';"| grep -v Value |awk '{print $2}'UserParameter=mysql.Created_tmp_disk_tables_rate,echo $(mysql -uroot -p123456 -e "show status like 'created_tmp_disk_tables';"| grep -v Value |awk '{print $2}') $(mysql -uroot -p123456 -e "show status like 'created_tmp_tables';"| grep -v Value |awk '{print $2}')| awk '{printf("%1.4f\n",$1/$2*100)}'
UserParameter=mysql.Max_connections,mysql -uroot -p123456 -e "show variables like 'max_connections';"| grep -v Value |awk '{print $2}'UserParameter=mysql.Max_used_connections,mysql -uroot -p123456 -e "show status like 'Max_used_connections';"| grep -v Value |awk '{print $2}'UserParameter=mysql.Max_connections_used_rate,echo $(mysql -uroot -p123456 -e "show status like 'Max_used_connections';"| grep -v Value |awk '{print $2}') $(mysql -uroot -p123456 -e "show variables like 'max_connections';"| grep -v Value |awk '{print $2}')| awk '{printf("%1.4f\n",$1/$2*100)}'
UserParameter=mysql.Table_locks_immediate,mysql -uroot -p123456 -e "show status like 'Table_locks_immediate';"| grep -v Value |awk '{print $2}'UserParameter=mysql.Table_locks_waited,mysql -uroot -p123456 -e "show status like 'table_locks_waited';"| grep -v Value |awk '{print $2}'UserParameter=mysql.Engine_select,echo $(mysql -uroot -p123456 -e "show status like 'Table_locks_immediate';"| grep -v Value |awk '{print $2}') $(mysql -uroot -p123456 -e "show status like 'table_locks_waited';"| grep -v Value |awk '{print $2}')| awk '{printf("%5.4f\n",$1/$2)}'
-------------------
二.访问zabbix web后台导入模板
1.访问zabbix-配置-模板,点击右上角的载入:

2.本地导入文件:下载本博附件mysql_template.xml文件导入zabbix模板,点击载入保存
3.访问zabbix-配置-模板,查看模板:

4.访问zabbix-配置-主机-Zabbix server,找到mysql客户端关联mysql_template.xml模版:
重启zabbix_agentd服务# /etc/init.d/zabbix_agentd restart
添加完毕,查看效果
附件下载:mysql模板 zabbix agent配置文件

相关文章推荐
- Centos6.3下zabbix监控mysql数据库参数
- Centos6.3下zabbix监控mysql数据库参数
- Centos6.3下zabbix监控apache server-status
- Centos6.3下zabbix监控apache server-status来明白zabbix原理
- RHEL6.3下Zabbix监控实践之Zabbix的安装
- CENTOS6.3下zabbix安装部署
- CentOS6.6安装Zabbix2.4监控系统
- Centos 7安装Grafana 4及结合Zabbix3.2实现可视化监控图形
- zabbix监控之Centos基于LNMP环境安装
- CentOS7.2部署Zabbix Server及Agent进行平台监控
- 开发人员学Linux(13):CentOS7安装配置IT设备监控系统Zabbix
- centos 快速搭建lnmp、lamp+zabbix3.2监控系统
- zabbix监控mysql数据库参数
- centos7.2 安装Zabbix3.2.6 监控系统安装
- RHEL6.3下Zabbix监控实践之Zabbix的安装
- Centos 7.0 下安装 Zabbix server 3.0服务器的安装及 监控主机的加入(1)
- Centos6.5 zabbix3.2.6监控mysql
- CentOS 7上安装Zabbix(快速安装监控工具Zabbix)
- Centos下搭建zabbix监控服务
- centos7源码编译 安装部署zabbix监控服务端和常见安装错误