<Debugging Techniques> LDD3 学习笔记
2014-09-01 23:28
337 查看
Debugging Techniques
内核debug的挑战:Kernel programming brings its own, unique debugging challenges. Kernel code can not be easily executed under a debugger, nor can it be easily traced, because it is a set of functionalities
not related to a specific process. Kernel code errors can also be exceedingly hard to reproduce and can bring down the entire system with them, thus destroying much of the evidence that could be used to track them down.
-------------------------------------------------------------------- Cut line -------------------------------------------------------------------------
Debugging by Printing
The most common debugging technique is monitoring, which in applications programming is done by calling printf at suitable points. When you are debugging kernel code, you can accomplish the same goal with printk.Debugging by Printing
Printk lets you classify messages according to their severity by associating different loglevels, or priorities, with the messages. You usually indicate the loglevel with a macro. For example, KERN_INFO , which we saw
prepended to some of the earlier print statements, is one of the possible loglevels of the message. The loglevel macro expands to a string, which is concatenated to the message text at compile time; that’s why there is no comma between the priority and the
format string in the following examples. Here are two examples of printk commands, a debug message and a critical message:
printk(KERN_DEBUG "Here I am: %s:%i\n", __FILE__, __LINE__);
printk(KERN_CRIT "I'm trashed; giving up on %p\n", ptr);
There are eight possible loglevel strings, defined in the header <linux/kernel.h>; we list them in order of decreasing severity:
KERN_EMERG
Used for emergency messages, usually those that precede a crash.
KERN_ALERT
A situation requiring immediate action.
KERN_CRIT
Critical conditions, often related to serious hardware or software failures.
KERN_ERR
Used to report error conditions; device drivers often use KERN_ERR to report hard-
ware difficulties.
KERN_WARNING
Warnings about problematic situations that do not, in themselves, create seri-
ous problems with the system.
KERN_NOTICE
Situations that are normal, but still worthy of note. A number of security-related
conditions are reported at this level.
KERN_INFO
Informational messages. Many drivers print information about the hardware
they find at startup time at this level.
KERN_DEBUG
Used for debugging messages.
Each string (in the macro expansion) represents an integer in angle brackets. Integers range from 0 to 7,with smaller values representing higher priorities.
Redirecting Console Messages
To select a different virtual terminal to receive messages, you can issue ioctl(TIOCLINUX) on any console device. The following program,setconsole, can be used to choose whichconsole receives kernel messages; it must be run by the superuser and is available in the misc-progs directory.
setconsole.c
/*
* setconsole.c -- choose a console to receive kernel messages
*
* Copyright (C) 1998,2000,2001 Alessandro Rubini
*
*   This program is free software; you can redistribute it and/or modify
*   it under the terms of the GNU General Public License as published by
*   the Free Software Foundation; either version 2 of the License, or
*   (at your option) any later version.
*
*   This program is distributed in the hope that it will be useful,
*   but WITHOUT ANY WARRANTY; without even the implied warranty of
*   MERCHANTABILITY or FITNESS FOR A PARTICULAR PURPOSE.  See the
*   GNU General Public License for more details.
*
*   You should have received a copy of the GNU General Public License
*   along with this program; if not, write to the Free Software
*   Foundation, Inc., 59 Temple Place, Suite 330, Boston, MA 02111-1307, USA.
*/

#include <stdio.h>
#include <stdlib.h>
#include <string.h>
#include <errno.h>
#include <unistd.h>
#include <sys/ioctl.h>

int main(int argc, char **argv)
{
char bytes[2] = {11,0}; /* 11 is the TIOCLINUX cmd number */

if (argc==2) bytes[1] = atoi(argv[1]); /* the chosen console */
else {
fprintf(stderr, "%s: need a single arg\n",argv[0]); exit(1);
}
if (ioctl(STDIN_FILENO, TIOCLINUX, bytes)<0) {    /* use stdin */
fprintf(stderr,"%s: ioctl(stdin, TIOCLINUX): %s\n",
argv[0], strerror(errno));
exit(1);
}
exit(0);
}
关于setconsole.c 测试的问题这里我耽搁了好久...
给出测试链接
http://blog.csdn.net/cinmyheart/article/details/38960967
Rate Limiting
If you are not careful, you can find yourself generating thousands of messages with printk, overwhelming the console and, possibly, overflowing the system log file. When using a slow console device (e.g., a serial port), an excessive message ratecan also slow down the system or just make it unresponsive.
Therefore, you should be very careful about what you print, especially in production versions of drivers and especially once initialization is complete.In general, production
code should never print anything during normal operation; printed out-put should be an indication of an exceptional situation requiring attention.
The kernel has provided a function that can be helpful in such cases:
int printk_ratelimit(void);
This function should be called before you consider printing a message that could be repeated often. If the function returns a nonzero value, go ahead and print your message, otherwise skip it. Thus, typical calls look like this:
if (printk_ratelimit( ))
printk(KERN_NOTICE "The printer is still on fire\n");
printk_ratelimit works by tracking how many messages are sent to the console. When the level of output exceeds a threshold, printk_ratelimit starts returning 0 and causing messages to be dropped.
Printing Device Numbers
Occasionally, when printing a message from a driver, you will want to print the device number associated with the hardware of interest. It is not particularly hard to print the major and minor numbers, but, in the interest of consistency,the kernel provides a couple of utility macros (defined in <linux/kdev_t.h>) for this purpose:、
int print_dev_t(char *buffer, dev_t dev);
char *format_dev_t(char *buffer, dev_t dev);
Both macros encode the device number into the given buffer ; the only difference is that print_dev_t returns the number of characters printed, while format_dev_t returns buffer ; therefore, it can be used as a parameter to a printk call directly,
although one must remember that printk doesn’t flush until a trailing newline is provided. The buffer should be large enough to hold a device number; given that 64-bit device numbers are a distinct possibility in future kernel releases, the buffer should probably
be at least 20 bytes long.
上述宏的实现
#define print_dev_t(buffer, dev)					\
sprintf((buffer), "%u:%u\n", MAJOR(dev), MINOR(dev))

#define format_dev_t(buffer, dev)					\
({								\
sprintf(buffer, "%u:%u", MAJOR(dev), MINOR(dev));	\
buffer;							\
})
Using the /proc Filesystem
The /proc filesystem is a special, software-created filesystem that is used by the kernel to export information to the world. Each file under /proc is tied to a kernel function that generates the file’s “contents” on the fly when the file
is read. We have already seen some of these files in action; /proc/modules, for example, always returns a list of the currently loaded modules.
关于proc的学习笔记
Introduction to “procfs”
Debugging by Watching
Sometimes minor problems can be tracked down by watching the behavior of an application in user space. Watching programs can also help in building confidence that a driver is working correctly. For example, we were able to feel confident about scullafter looking at how its read implementation reacted to read requests for different amounts of data.
There are various ways to watch a user-space program working. You can run a debugger on it to step through its functions, add print statements, or run the program under strace. Here we’ll
discuss just the last technique, which is most interesting when the real goal is examining kernel code.
Thestrace
command is a powerful tool that shows all the system calls issued by a user-space program. Not only does it show the calls, but it can also show the arguments to the calls and their return values in symbolic form. When a system call fails, both the
symbolic value of the error (e.g., ENOMEM ) and the corresponding string ( Out of memory ) are displayed. strace has many command-line options; the most useful of which are -t to display the time when each call is executed, -T to display the time spent in
the call, -e to limit the types of calls traced, and -o to redirect the output to a file. By default, strace prints tracing information on stderr .
下面我demo一下strace的效果

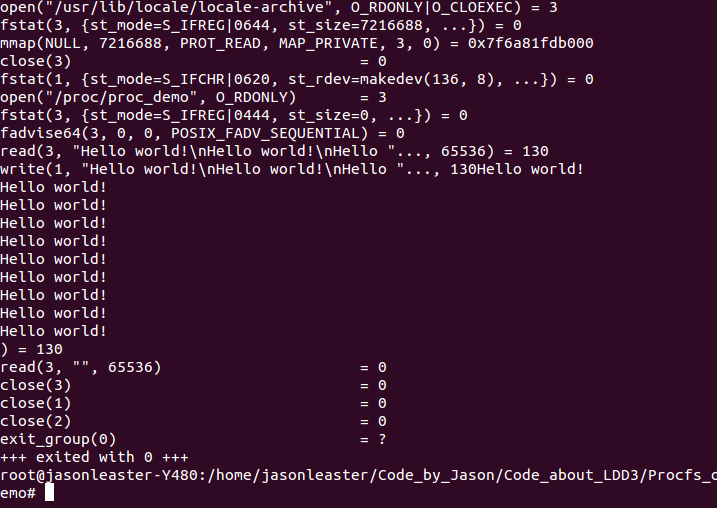
strace是一个很爽的命令,能够一步步跟踪命令触发之后发生了什么。上面这个starce跟踪了cat /proc/proc_demo
发生了什么
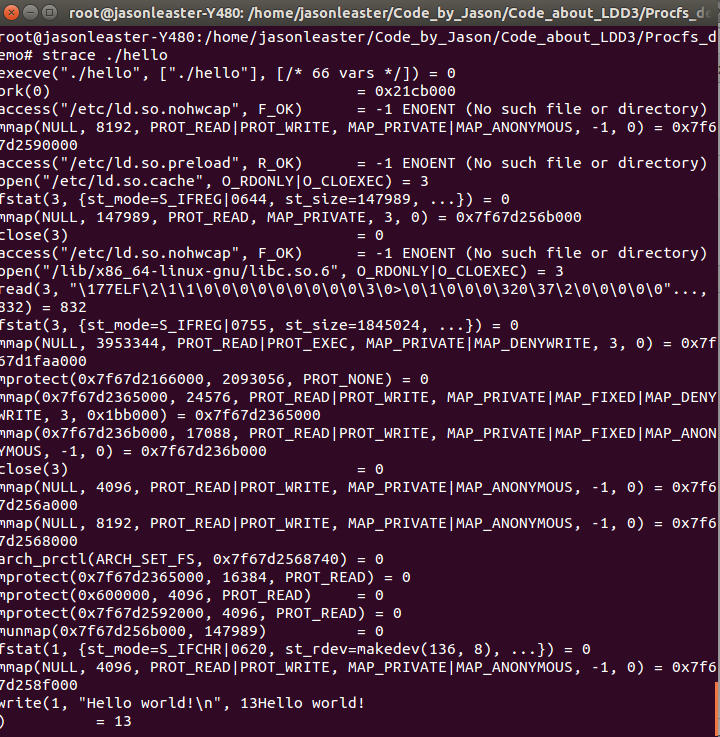
下面尝试跟踪最漂亮的代码——hello world!
#include <stdio.h>

int main()
{
printf("Hello world!\n");

return 0;
}
可以见得,一开始先调用了execve(),去执行./hello这个可执行程序
然后去open了libc.so.6这个库,最后write()把“hello world”字符串写入到标准输出

Debuggers and Related Tools
Many readers may be wondering why the kernel does not have any more advanced debugging features built into it. The answer, quite simply, is that Linus does not believe in interactive
debuggers. He fears that they lead to poor fixes, those which patch up symptoms rather than addressing the real cause of problems. Thus, no
built-in debuggers.
Linus 不希望有内置的调试器,不信任交互式的调试器,于是,kernel driver 对于单步调试,就别想了
关于kernel debug的技巧笔记终于~告一段落了
“山河百战归民主” ——徐悲鸿


相关文章推荐
- tiny_tty.c 在3.X 内核版本上不能运行 的解决办法 <LDD3 学习笔记>
- s3c6410 RTC driver——读取实时时间信息 <LDD3 & ELDD 学习笔记>
- Data Types in the Kernel <LDD3 学习笔记>
- Data Types in the Kernel <LDD3 学习笔记>
- 计算机专业的大学生课外该如何学习&lt;转自左飞的笔记&gt;
- C++学习笔记之对文件的操作<2>
- C++学习笔记之对文件的操作<1>
- <<SQL Server 2005 高级程序设计>> 学习笔记(3)
- <<SQL Server 2005 高级程序设计>> 学习笔记(4)
- <学习笔记-杂>上传下 这20天的学习笔记以免以后丢失。。。
- XSL学习笔记3 XSLT的模板规则<xsl:value-of>和<xsl:for-each>
- <<SQL Server 2005 高级程序设计>> 学习笔记(1)
- C语言中的位运算&结构体浅析 — <编程之美>1.2学习笔记
- Spring2.5学习笔记2-AOP-利用<aop>
- 【应用篇】WCF学习笔记(二):ServiceContract、DataContract <第一部分>
- linux 学习心得笔记<初级>第二篇
- 我的JavaScript学习笔记<续>
- ubuntu学习笔记<二>
- linux 学习心得笔记<primary> 第四篇
- 11/7/8 STL 映射容器 map< K , T > 学习笔记