运维日志管理系统
2014-07-18 17:41
253 查看
因公司数据安全和分析的需要,故调研了一下
Nohup java –jar logstash-1.2.1-flatjar.jar agent –f /etc/ logstash_shipper.conf &
过十秒后,输出如下信息:
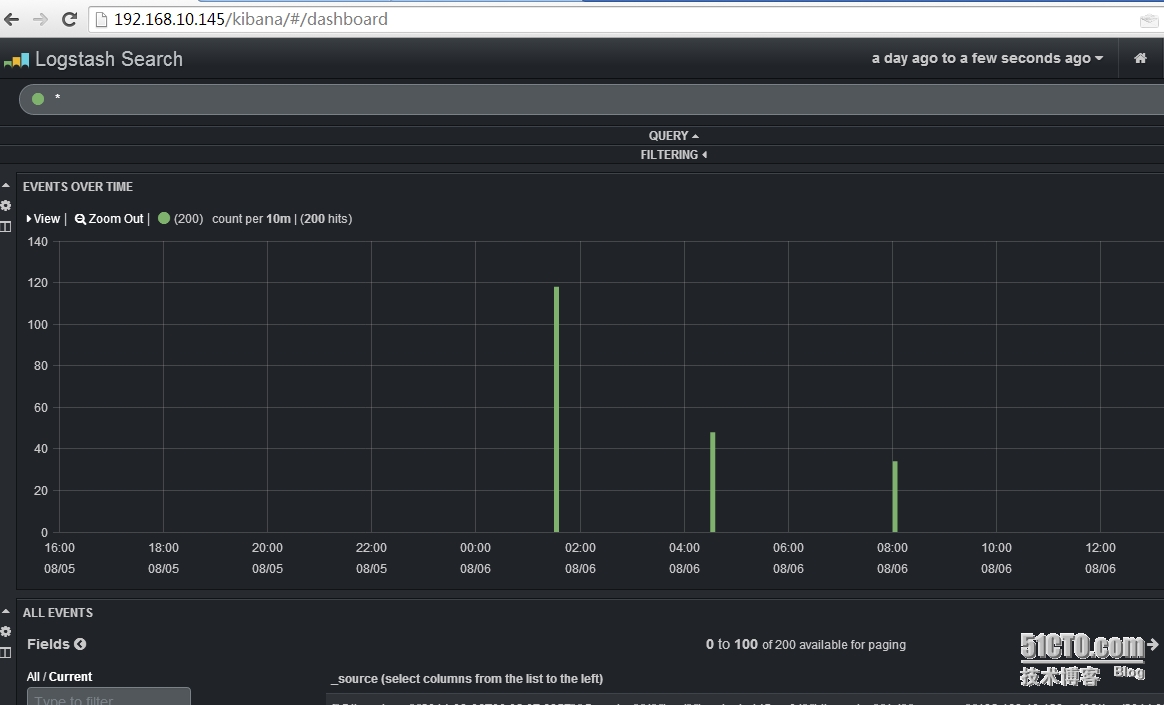
Using milestone 2input plugin 'file'. This plugin should be stable, but if you see strangebehavior, please let us know! For more information on plugin milestones, seehttp://logstash.net/docs/1.2.2/plugin-milestones {:level=>:warn}Using milestone 2 output plugin 'redis'.This plugin should be stable, but if you see strange behavior, please let usknow! For more information on plugin milestones, see http://logstash.net/docs/1.2.2/plugin-milestones{:level=>:warn} 192.168.10.144 logstash indexer 配置如下:Vim /etc/logstash_indexer.conf input{ redis { host => "192.168.10.144" data_type =>"list" port => "6379" key => "syslog" type => "redis-input" } } output { elasticsearch { host => "192.168.10.145" port => "9300" }} 启动logstash indexer Nohup java –jar logstash-1.2.1-flatjar.jar agent –f /etc/ logstash_indexer.conf & 输出同上。 7. 登录 http://192.168.10.145/kibana 访问如下
三,整合分布式文件存储和日志收集系统逻辑图如下:
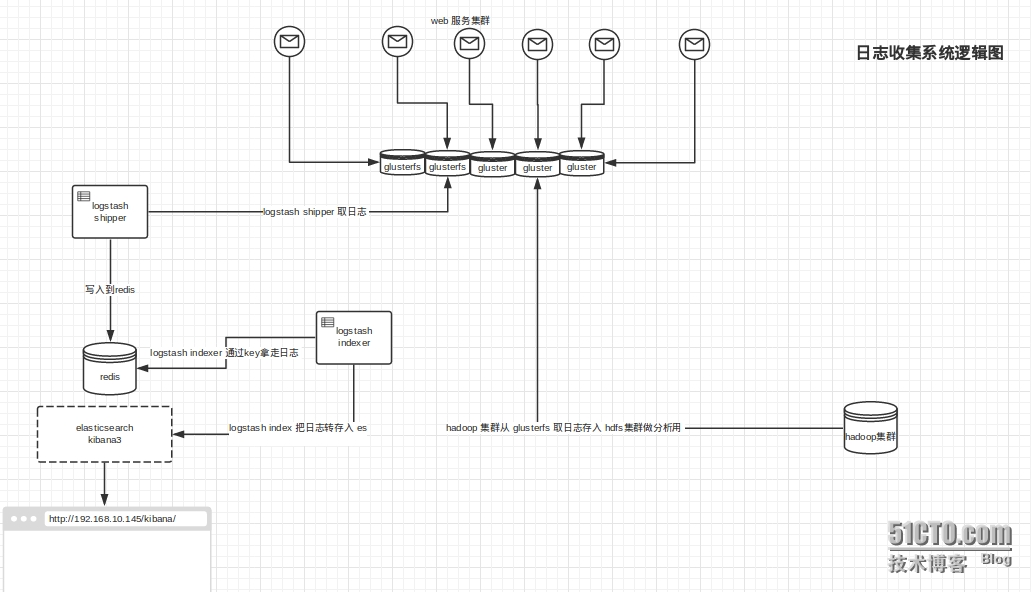
把glusterfs 挂载到web服务器端,具体需要编写日志结构化程序配合日志写到glusterfs存储上。
本文出自 “知易行难大道至简” 博客,谢绝转载!
GlusterFS + lagstash + elasticsearch + kibana 3 + redis 整合在一起的日志管理应用:
安装,配置过程,使用情况等续一,glusterfs分布式文件系统部署:
说明:公司想做网站业务日志及系统日志统一收集和管理,经过对mfs, fastdfs 等分布式文件系统的调研,最后选择了 glusterfs,因为Gluster具有高扩展性、高性能、高可用性、可横向扩展的弹性特点,无元数据服务器设计使glusterfs没有单点故障隐患,官网:www.gluster.org 1. 系统环境准备:Centos 6.4 服务端: 192.168.10.101 192.168.10.102 192.168.10.188 192.168.10.189 客户端: 192.168.10.103 EPEL源和GlusterFS源 增加EPEL源和GLusterFS源,EPEL源中包含GLusterFS,版本比较旧,相对稳定,本次测试采用最新的3.5.0版本。 rpm -Uvh http://dl.fedoraproject.org/pub/epel/6/x86_64/epel-release-6-8.noarch.rpm wget -P /etc/yum.repos.dhttp://download.gluster.org/pub/gluster/glusterfs/LATEST/CentOS/glusterfs-epel.repo 2. 部署过程 服务端安装: yum -y install glusterfs glusterfs-fuseglusterfs-server chkconfig glusterd on service glusterd start 服务端配置: 将4个存储节点组成一集群,本文在第一个节点执行,只需要在任意节点执行就ok。 [root@db1 ~]# gluster peer probe192.168.10.102 probe successful [root@db1 ~]# gluster peer probe192.168.10.188 probe successful [root@db1 ~]# gluster peer probe 192.168.10.189 probe successful 查看集群的节点信息: [root@db1 ~]# gluster peer status number of peers: 3 hostname: 192.168.10.102 uuid:b9437089-b2a1-4848-af2a-395f702adce8 state: peer in cluster (connected) hostname: 192.168.10.188 uuid: ce51e66f-7509-4995-9531-4c1a7dbc2893 state: peer in cluster (connected) hostname: 192.168.10.189 uuid:66d7fd67-e667-4f9b-a456-4f37bcecab29 state: peer in cluster (connected) 以/data/gluster为共享目录,创建名为test-volume的卷,副本数为2: sh cmd.sh "mkdir /data/gluster" [root@db1 ~]# gluster volume create test-volume replica 2192.168.10.101:/data/gluster 192.168.10.102:/data/gluster192.168.10.188:/data/gluster 192.168.10.189:/data/gluster creation of volume test-volume has beensuccessful. please start the volume to access data. 启动卷: [root@db1 ~]# gluster volume starttest-volume starting volume test-volume has beensuccessful 查看卷状态: [root@db1 ~]# gluster volume info volume name: test-volume type: distributed-replicate status: started number of bricks: 2 x 2 = 4 transport-type: tcp bricks: brick1: 192.168.10.101:/data/gluster brick2: 192.168.10.102:/data/gluster brick3: 192.168.10.188:/data/gluster brick4: 192.168.10.189:/data/gluster3. 客户端安装配置: 安装: yum -y installglusterfs glusterfs-fuse 挂载: mount -t glusterfs 192.168.10.102:/test-volume/mnt/ (挂载任意一个节点即可)推荐用这种方式。 mount -t nfs -o mountproto=tcp,vers=3192.168.10.102:/test-volume /log/mnt/ (使用nfs挂载,注意远端的rpcbind服务必须开启) echo "192.168.10.102:/test-volume/mnt/ glusterfs defaults,_netdev 0 0" >> /etc/fstab (开机自动挂载)4. 测试 检查文件正确性 dd if=/dev/zero of=/mnt/1.img bs=1Mcount=1000 # 在挂载客户端生成测试文件 cp /data/navy /mnt/ # 文件拷贝到存储上 宕机测试。 使用glusterfs-fuse挂载,即使目标服务器故障,也完全不影响使用。用NFS则要注意挂载选项,否则服务端故障容易导致文件系统halt住而影响服务! # 将其中一个节点停止存储服务service glusterd stop service glusterfsd stop# 在挂载客户端删除测试文件 rm -fv /mnt/navy# 此时在服务端查看,服务被停止的节点上navy并未被删除。此时启动服务:serviceglusterd start# 数秒后,navy就被自动删除了。新增文件效果相同!5. 运维常用命令: 删除卷 gluster volume stop test-volume gluster volume delete test-volume 将机器移出集群 gluster peer detach 192.168.10.102 只允许172.28.0.0的网络访问glusterfs gluster volume set test-volumeauth.allow 192.168.10.* 加入新的机器并添加到卷里(由于副本数设置为2,至少要添加2(4、6、8..)台机器) gluster peer probe 192.168.10.105 gluster peer probe 192.168.10.106 gluster volume add-brick test-volume192.168.10.105:/data/gluster 192.168.10.106:/data/gluster 收缩卷 # 收缩卷前gluster需要先移动数据到其他位置 gluster volume remove-brick test-volume192.168.10.101:/data/gluster/test-volume192.168.10.102:/data/gluster/test-volume start # 查看迁移状态 gluster volume remove-brick test-volume192.168.10.101:/data/gluster/test-volume192.168.10.102:/data/gluster/test-volume status # 迁移完成后提交 gluster volume remove-brick test-volume192.168.10.101:/data/gluster/test-volume192.168.10.102:/data/gluster/test-volume commit 迁移卷 # 将192.168.10.101的数据迁移到,先将192.168.10.107加入集群 gluster peer probe 192.168.10.107 gluster volume replace-bricktest-volume 192.168.10.101:/data/gluster/test-volume192.168.10.107:/data/gluster/test-volume start # 查看迁移状态gluster volume replace-brick test-volume192.168.10.101:/data/gluster/test-volume192.168.10.107:/data/gluster/test-volume status # 数据迁移完毕后提交gluster volume replace-brick test-volume192.168.10.101:/data/gluster/test-volume192.168.10.107:/data/gluster/test-volume commit # 如果机器192.168.10.101出现故障已经不能运行,执行强制提交然后要求gluster马上执行一次同步 gluster volume replace-bricktest-volume 192.168.10.101:/data/gluster/test-volume192.168.10.102:/data/gluster/test-volume commit -force gluster volume heal test-volumes full 24007二.日志收集系统部署
说明简解:系统各部分应用介绍Logstash:做系统log收集,转载的工具。同时集成各类日志插件,对日志查询和分析的效率有很大的帮助.一般使用shipper作为log收集、indexer作为log转载.Logstash shipper收集log 并将log转发给redis 存储Logstash indexer从redis中读取数据并转发给elasticsearchredis:是一个db,logstash shipper将log转发到redis数据库中存储。Logstash indexer从redis中读取数据并转发给elasticsearch。Elasticsearch:开源的搜索引擎框架,前期部署简单,使用也简单,但后期需要做必要的优化具体请参照博客http://chenlinux.com/categories.html#logstash-ref 中logstash部分.可进行多数据集群,提高效率。从redis中读取数据,并转发到kibana中Kibana: 开源web展现。 虚拟服务器准备:192.168.10.143 logstash shipper192.168.10.144 logstash indexer redis192.168.10.145 elasticsearch kibana31.三台主机都要安装jdk 1.7推荐oracle jdk 1.7+版本java -version设置java的环境变量,比如 vim~/.bashrc >> JAVA_HOME=/usr/java/jdk1.7.0_55PATH=$PATH:/$JAVA_HOME/binCLASSPATH=.:$JAVA_HOME/libJRE_HOME=$JAVA_HOME/jreexport JAVA_HOME PATH CLASSPATH JRE_HOME>> source ~/.bashrc2.安装redis(192.168.10.144)wgethttp://download.redis.io/releases/redis-2.6.16.tar.gztar -zxf redis-2.6.16.tar.gzcd redis-2.6.16make && make install./src/redis-server ../redis.conf 启动redis客户端来验证安装./src/redis-cli> keys * #列出所有的key 3.安装Elasticsearch(192.168.10.145)wgethttp://download.elasticsearch.org/elasticsearch/elasticsearch/elasticsearch-0.90.13.zip unzipelasticsearch-0.90.13.zipelasticsearch解压即可使用非常方便,接下来我们看一下效果,首先启动ES服务,切换到elasticsearch目录,运行bin下的elasticsearchcd elasticsearch-0.90.13bin/elasticsearch -f访问默认的9200端口 curl -X GET http://localhost:9200 4.安装logstash (192.168.10.143 ,192.168.10.144)wgethttp://download.elasticsearch.org/logstash/logstash/logstash-1.2.1-flatjar.jarlogstash下载即可使用,命令行参数可以参考logstash flags,主要有agent #运行Agent模式-f CONFIGFILE #指定配置文件web #自动Web服务-p PORT #指定端口,默认9292 5. 安装kibana(192.168.10.145)logstash的最新版已经内置kibana,你也可以单独部署kibana。kibana3是纯粹JavaScript+html的客户端,所以可以部署到任意http服务器上。wgethttp://download.elasticsearch.org/kibana/kibana/kibana-latest.zip unzip kibana-latest.zip cp-r kibana-latest /var/www/html可以修改config.js来配置elasticsearch的地址和索引。 修改以下行。 elasticsearch:"http://192.168.10.145:9200", 6. 整合配置:192.168.10.143 logstash shipper 配置收集日志Vim /etc/logstash_shipper.conf input{ file { type => "linux-syslog" path => [ "/var/log/lastlog", "/var/log/syslog","/var/log/lastlog" ] } } output { redis { host => "192.168.10.144" port => “6379” data_type =>"list" key => "syslog" }} 启动logstash shipperNohup java –jar logstash-1.2.1-flatjar.jar agent –f /etc/ logstash_shipper.conf &
过十秒后,输出如下信息:
Using milestone 2input plugin 'file'. This plugin should be stable, but if you see strangebehavior, please let us know! For more information on plugin milestones, seehttp://logstash.net/docs/1.2.2/plugin-milestones {:level=>:warn}Using milestone 2 output plugin 'redis'.This plugin should be stable, but if you see strange behavior, please let usknow! For more information on plugin milestones, see http://logstash.net/docs/1.2.2/plugin-milestones{:level=>:warn} 192.168.10.144 logstash indexer 配置如下:Vim /etc/logstash_indexer.conf input{ redis { host => "192.168.10.144" data_type =>"list" port => "6379" key => "syslog" type => "redis-input" } } output { elasticsearch { host => "192.168.10.145" port => "9300" }} 启动logstash indexer Nohup java –jar logstash-1.2.1-flatjar.jar agent –f /etc/ logstash_indexer.conf & 输出同上。 7. 登录 http://192.168.10.145/kibana 访问如下
三,整合分布式文件存储和日志收集系统逻辑图如下:
把glusterfs 挂载到web服务器端,具体需要编写日志结构化程序配合日志写到glusterfs存储上。
本文出自 “知易行难大道至简” 博客,谢绝转载!

相关文章推荐
- 运维学习之系统日志的管理及时间的信息同步
- 运维日记017 -- RHEL6之系统日志的管理
- 运维之系统服务篇------ RAID磁盘阵列 、 进程管理 、 日志管理 、 systemctl控制
- Log4j日志管理系统简单使用说明
- Log4j日志管理系统简单使用说明
- Log4j日志管理系统简单使用说明
- Log4j日志管理系统简单使用说明
- Log4j日志管理系统简单使用说明(转)
- ITIL提升中国电信运维管理系统建设
- Log4j日志管理系统简单使用说明
- 管理Linux系统日志文件工具:logrotate简介
- Log4j日志管理系统简单使用说明
- qmail邮件系统(六)日志和管理
- 自己动手做博客之日志管理-3.2 编码实现系统首页
- IT系统运维初探――中石化齐鲁分公司储运厂网络管理
- Log4j日志管理系统简单使用说明
- Log4j日志管理系统简单使用说明
- 值班日志管理系统更新记录
- [原创]今天开发日志管理系统,全选,多项删除功能。
- aix学习日志(四)之系统管理!