zabbix value type导致的断图一例 推荐
2014-03-15 03:17
429 查看
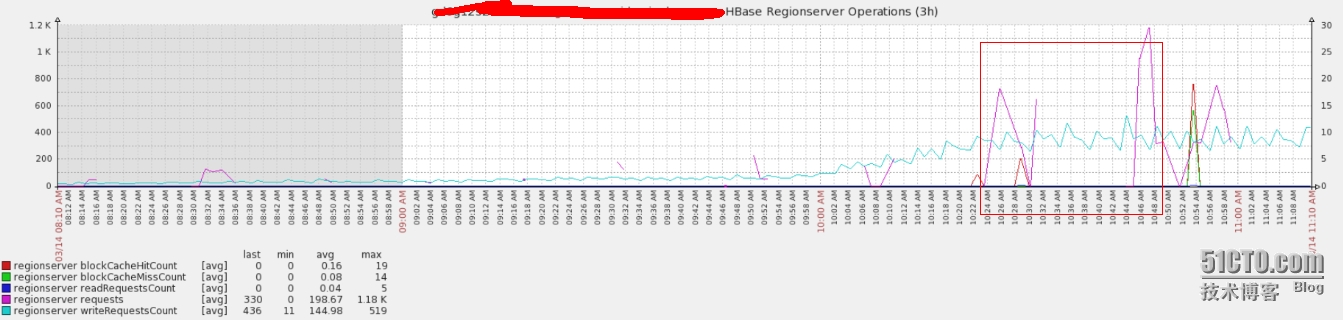
最近老毕在加hbase的监控,发现生成的graph有断图的情况。。因为之前有次zabbix断图定位到了是proxy的性能问题,通过调整相应的参数解决掉了。。再看这次的情况,发现有些item的graph是ok的,也就排除了proxy性能问题。。看来还是和item相关。
整个数据链路是agent---proxy(db)----server(db),从上游数据库开始入手:
1.找出正常的和断图的item做对比
3.在server端的数据库中查看item的lastvalue的同步时间,发现出问题的item lastclock存在些问题,有问题的item有时候会很长时间都不会更新。
问题rc找到了,为了方便可以直接通过update 数据库来fix这个问题。
agent端对应日志:
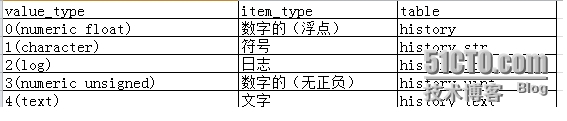
再附一个value type和history的对应关系:
整个数据链路是agent---proxy(db)----server(db),从上游数据库开始入手:
1.找出正常的和断图的item做对比
select i.itemid,h.host from items i,hosts h where i.hostid=h.hostid and h.host='xxxx' and i.name in ('regionserver writeRequestsCount','regionserver requests');
+--------+----------------------------------------------+
| itemid | host                                         |
+--------+----------------------------------------------+
|  53855 | xxxx |
|  53895 | xxxx |
+--------+----------------------------------------------+2.首先看server端和proxy端item的interval同步的情况(都是60s),没有异常。。3.在server端的数据库中查看item的lastvalue的同步时间,发现出问题的item lastclock存在些问题,有问题的item有时候会很长时间都不会更新。
select current_timestamp();
+---------------------+
| current_timestamp() |
+---------------------+
| 2014-03-14 11:22:23 |
+---------------------+
select itemid,key_,delay,lastvalue,from_unixtime(lastclock,'%Y%m%d %H:%i:%S') from items where itemid in ('53855','53895');
+--------+-----------------------------------------------+-------+-----------+--------------------------------------------+
| itemid | key_                                          | delay | lastvalue | from_unixtime(lastclock,'%Y%m%d %H:%i:%S') |
+--------+-----------------------------------------------+-------+-----------+--------------------------------------------+
|  53855 | hadoop_stats[regionserver,requests]           |    60 | 0         | 20140314 11:15:19                          |
|  53895 | hadoop_stats[regionserver,writeRequestsCount] |    60 | 291       | 20140314 11:21:52                          |
+--------+-----------------------------------------------+-------+-----------+--------------------------------------------+4.在server的history相应的表查看断图的item一段时间值的分布情况,发现不是一分钟一条数据。select from_unixtime(clock,'%Y%m%d %H:%i:%S'),value from history_uint where itemid in ('53855');
| 20140314 11:12:02 | 0 |
| 20140314 11:26:10 | 0 |
| 20140314 11:27:11 | 0 |
| 20140314 11:28:12 | 0 |
| 20140314 11:29:13 | 10 |
| 20140314 11:30:28 | 0 |
| 20140314 11:31:29 | 0 |
| 20140314 11:32:29 | 0 |
| 20140314 11:33:30 | 0 |
| 20140314 11:34:46 | 0 |5.proxy相对应的history_proxy表中查看相关数据,发现在value字段有Received value xxx
is
not
suitable
for
value type的信息,看来和数据的类型有关系。
select id,from_unixtime(clock,'%Y%m%d %H:%i:%S'),value from proxy_history where itemid in ('53855');
+------------+----------------------------------------+--------------------------------------------------------------------------------------------------------+
| id         | from_unixtime(clock,'%Y%m%d %H:%i:%S') | value                                                                                                  |
+------------+----------------------------------------+--------------------------------------------------------------------------------------------------------+
| 4792921942 | 20140314 11:12:02                      | 0                                                                                                      |
| 4792948233 | 20140314 11:13:19                      | Received value [283.33334] is not suitablefor value type [Numeric (unsigned)] and data type [Decimal] |
| 4792967862 | 20140314 11:14:19                      | Received value [266.33334] is not suitablefor value type [Numeric (unsigned)] and data type [Decimal] |
| 4792987031 | 20140314 11:15:19                      | Received value [315.33334] is not suitablefor value type [Numeric (unsigned)] and data type [Decimal] |
| 4793199599 | 20140314 11:26:10                      | 0                                                                                                      |
| 4793219166 | 20140314 11:27:11                      | 0                                                                                                      |
| 4793239212 | 20140314 11:28:12                      | 0                                                                                                      |
| 4793258721 | 20140314 11:29:13                      | 10                                                                                                     |
| 4793283508 | 20140314 11:30:28                      | 0                                                                                                      |
| 4793303560 | 20140314 11:31:29                      | 0                                                                                                      |
| 4793322826 | 20140314 11:32:29                      | 0                                                                                                      |
| 4793342173 | 20140314 11:33:30                      | 0                                                                                                      |
+------------+----------------------------------------+--------------------------------------------------------------------------------------------------------+
6.查看item的设置,发现value type设置的是Numeric
(unsigned)的,而item的值会产生float类型的值,proxy_history的value字段是longtext类型的,而server端history_uint表的字段是bigint类型的。在类型转换存储的时候就会造成数据的丢失。其实在item表中有个error的信息字段,是记录了item获取值存在的错误的。。可以通过这个直接定位到问题。
问题rc找到了,为了方便可以直接通过update 数据库来fix这个问题。
update items set value_type=0 where value_type=3 and (key_ like 'hadoop_stats[regionserver%' or key_ like 'hadoop_stats[hmaster%');不过发现一个比较奇怪的问题,在value type不正确的时候,agent数据获取并不是根据interval来的,有时候会间隔10min左右。。这样也加剧了history表中数据丢失的严重性,不知道是不知zabbix agent内部的机制,有时间需要看看代码才行。
agent端对应日志:
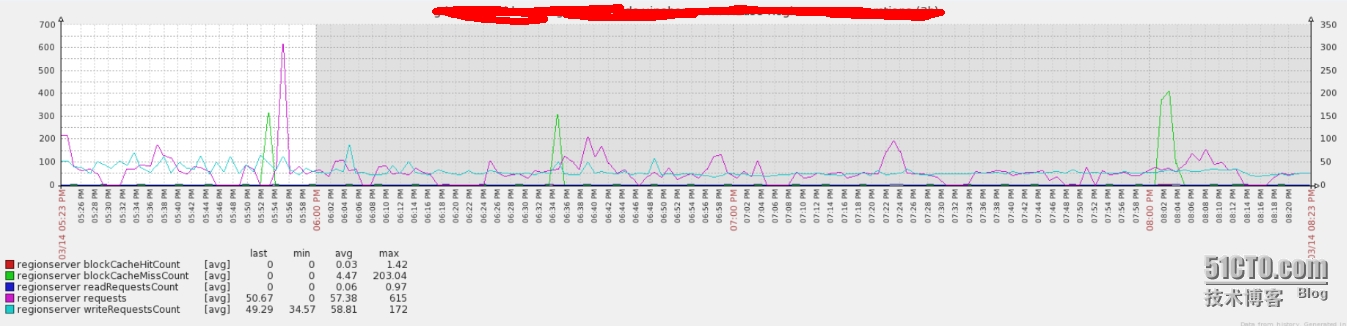
7964:20140314:111202.800 For key [hadoop_stats[regionserver,requests]] received value [0.0]
7964:20140314:111319.053 For key [hadoop_stats[regionserver,requests]] received value [283.33334]
7964:20140314:111419.454 For key [hadoop_stats[regionserver,requests]] received value [266.33334]
7964:20140314:111519.532 For key [hadoop_stats[regionserver,requests]] received value [315.33334]
#中间10分钟左右没有值产生
7964:20140314:112610.705 For key [hadoop_stats[regionserver,requests]] received value [0.0]
7964:20140314:112711.308 For key [hadoop_stats[regionserver,requests]] received value [0.0]
7964:20140314:112812.375 For key [hadoop_stats[regionserver,requests]] received value [0.0]
7964:20140314:112913.086 For key [hadoop_stats[regionserver,requests]] received value [10.0]
7964:20140314:113028.703 For key [hadoop_stats[regionserver,requests]] received value [0.0]
7964:20140314:113129.180 For key [hadoop_stats[regionserver,requests]] received value [0.0]
7964:20140314:113229.941 For key [hadoop_stats[regionserver,requests]] received value [0.0]
7964:20140314:113330.568 For key [hadoop_stats[regionserver,requests]] received value [0.0]
7964:20140314:113446.343 For key [hadoop_stats[regionserver,requests]] received value [0.0]
7964:20140314:113546.977 For key [hadoop_stats[regionserver,requests]] received value [0.0]
最后贴下更新后的graph情况:
再附一个value type和history的对应关系:

相关文章推荐
- zabbix value map导致报警失效问题一例 推荐
- resin access log导致的锁问题一例 推荐
- 系统默认分配的共享内存太小,导致zabbix_server无法启动一例
- protoc-gen-lua message之间相互引用问题 导致 upvalue 'message_type' (a nil value)
- namenode gc导致的故障一例 推荐
- redis突然掉电导致aof文件损坏修复一例 推荐
- 系统默认分配的共享内存太小,导致zabbix_server无法启动一例
- Received value [sh: /etc/zabbix/scripts/mysql: Permission denied] is not suitable for value type
- sudo bug导致的zabbix断图问题 推荐
- 【MySQL运维】解决由于中继日志报错导致主从故障一例 推荐
- puppet recurse 导致的性能问题一例 推荐
- 网站导致浏览器崩溃的原因总结(多款浏览器) 推荐
- TypeMaxValue
- Null value was assigned to a property of primitive type setter of
- 网站导致浏览器崩溃的原因总结(多款浏览器) 推荐
- JSONException: Value of type java.lang.String cannot be converted to JSONObject
- 清除信号量队列导致zabbix自动关闭
- Failed to convert property value of type [java.lang.String] to required type [java.util.Date] for pr
- 处理错误TypeError: initial_value must be unicode or None, not str
- 前置声明与C++头文件互相包含导致的error: 'xxx' does not name a type问题