如何分析python程序的性能
2014-02-24 13:54
225 查看
程序性能分析需要基本上需要搞清楚4个问题
程序到底有多快
程序的瓶颈到底在哪里
程序占用内存多少
是否存在内存泄露
下面我们使用一些工具来回答以上四个问题。
简短的来说,其输出的结果说明:
如果
为了使用我们封装的类,必须使用
可以将时间输出到文件中,已查看程序的时常运行时间。
为了使用该模块,需要将
primes.py
使用
根据上面的输出,找到运行最多的代码行或者运行时间最长的代码来优化,定会提升程序的性能。
(安装
和前面说过的一样,为了得到函数占用的内存,需要在函数头部添加
用下面的命令运行你的脚本:
你会得到像下面这样的输出:
在
执行这两个命令以后,就可以通过执行
当某个对象已经不再使用了,但是他的引用还存在,那么就会出现内存泄露。
要检测内存泄露,这里我们需要用到模块
(注意这个模块需要安装
在代码中使用一下代码打开调试模式:
执行下面命令:
输出下面的图片:
图片最底下的红色字母表示的对象是我们做所关注的,它显示了那些变量引用了这个对象。
总的来说哦,
占用内存的对象
在一段时间内对象的增加和删除
对象的所有引用
程序到底有多快
程序的瓶颈到底在哪里
程序占用内存多少
是否存在内存泄露
下面我们使用一些工具来回答以上四个问题。
获取程序运行的大概时间
在linux平台上,可以使用time命令得到程序运行的大概时间:
$ time python yourprogram.py

real    0m1.028s
user    0m0.001s
sys     0m0.003s
简短的来说,其输出的结果说明:
real- 程序实际运行的时间
user- 用户空间话费的cpu时间
sys- 内核空间话费的cpu时间
如果
sys和
user之和的时间远远小于
real的时间,那么说明程序大部分的时间很可能花费在IO等待。
获取更精确的程序运行时间
下面我们通过封装一个Timer类来实现获取更精确地程序运行时间
import time

class Timer(object):
def __init__(self, verbose=False):
self.verbose = verbose

def __enter__(self):
self.start = time.time()
return self

def __exit__(self, *args):
self.end = time.time()
self.secs = self.end - self.start
self.msecs = self.secs * 1000  # millisecs
if self.verbose:
print 'elapsed time: %f ms' % self.msecs
为了使用我们封装的类,必须使用
with来封装我们需要计算的代码块,这样当代码块开始时,计时器开始,当代码块结束时计时器停止。
from timer import Timer
from redis import Redis
rdb = Redis()

with Timer() as t:
rdb.lpush("foo", "bar")
print "=> elasped lpush: %s s" % t.secs

with Timer as t:
rdb.lpop("foo")
print "=> elasped lpop: %s s" % t.secs
可以将时间输出到文件中,已查看程序的时常运行时间。
计算每一行代码的运行时间和运行频率
这里我们需要使用line_profiler模块,首先安装该模块:
pip install line_profiler
为了使用该模块,需要将
@profile添加到你需要观察的函数头部。
primes.py
@profile
def primes(n):
if n==2:
return [2]
elif n<2:
return []
s=range(3,n+1,2)
mroot = n ** 0.5
half=(n+1)/2-1
i=0
m=3
while m <= mroot:
if s[i]:
j=(m*m-3)/2
s[j]=0
while j<half:
s[j]=0
j+=m
i=i+1
m=2*i+3
return [2]+[x for x in s if x]
primes(100)
使用
kernprof.py运行python脚本:
$ kernprof.py -l -v fib.py
-l参数是告诉
kernprof.py测试头部有
@profile的函数,
-v参数是告诉
kernprof.py当脚本运行完毕时打印出时间信息。以下是告诉
kernprof.py的输出信息样本:
Wrote profile results to primes.py.lprof
Timer unit: 1e-06 s

File: primes.py
Function: primes at line 2
Total time: 0.00019 s

Line #      Hits         Time  Per Hit   % Time  Line Contents
==============================================================
2                                           @profile
3                                           def primes(n):
4         1            2      2.0      1.1      if n==2:
5                                                   return [2]
6         1            1      1.0      0.5      elif n<2:
7                                                   return []
8         1            4      4.0      2.1      s=range(3,n+1,2)
9         1           10     10.0      5.3      mroot = n ** 0.5
10         1            2      2.0      1.1      half=(n+1)/2-1
11         1            1      1.0      0.5      i=0
12         1            1      1.0      0.5      m=3
13         5            7      1.4      3.7      while m <= mroot:
14         4            4      1.0      2.1          if s[i]:
15         3            4      1.3      2.1              j=(m*m-3)/2
16         3            4      1.3      2.1              s[j]=0
17        31           31      1.0     16.3              while j<half:
18        28           28      1.0     14.7                  s[j]=0
19        28           29      1.0     15.3                  j+=m
20         4            4      1.0      2.1          i=i+1
21         4            4      1.0      2.1          m=2*i+3
22        50           54      1.1     28.4      return [2]+[x for x in s if x
根据上面的输出,找到运行最多的代码行或者运行时间最长的代码来优化,定会提升程序的性能。
找到程序运行时占用多少内存
现在我们已经知道如何测试程序的运行时间,接下来看看如何得知程序占用的内存,我们需要安装使用到的模块memory_profiler:
$ pip install -U memory_profiler
$ pip install psutil
(安装
psutil会很大程度上提高
memory_profiler的性能。)
和前面说过的一样,为了得到函数占用的内存,需要在函数头部添加
@profile,如下:
@profile
def primes(n):
...
...
用下面的命令运行你的脚本:
$ python -m memory_profiler primes.py
你会得到像下面这样的输出:
Filename: primes.py

Line #    Mem usage  Increment   Line Contents
==============================================
2                           @profile
3    7.9219 MB  0.0000 MB   def primes(n):
4    7.9219 MB  0.0000 MB       if n==2:
5                                   return [2]
6    7.9219 MB  0.0000 MB       elif n<2:
7                                   return []
8    7.9219 MB  0.0000 MB       s=range(3,n+1,2)
9    7.9258 MB  0.0039 MB       mroot = n ** 0.5
10    7.9258 MB  0.0000 MB       half=(n+1)/2-1
11    7.9258 MB  0.0000 MB       i=0
12    7.9258 MB  0.0000 MB       m=3
13    7.9297 MB  0.0039 MB       while m <= mroot:
14    7.9297 MB  0.0000 MB           if s[i]:
15    7.9297 MB  0.0000 MB               j=(m*m-3)/2
16    7.9258 MB -0.0039 MB               s[j]=0
17    7.9297 MB  0.0039 MB               while j<half:
18    7.9297 MB  0.0000 MB                   s[j]=0
19    7.9297 MB  0.0000 MB                   j+=m
20    7.9297 MB  0.0000 MB           i=i+1
21    7.9297 MB  0.0000 MB           m=2*i+3
22    7.9297 MB  0.0000 MB       return [2]+[x for x in s if x]
line_profiler
和memory_profiler
在IPython
中的简便实用方法
在IPython中,只要你执行以下两个命令,皆可以直接实用
line_profiler和
memory_profiler了:
%load_ext memory_profiler
%load_ext line_profiler
执行这两个命令以后,就可以通过执行
%lprun和
%mprun命令来测试你需要测试的函数,而不需要在每个函数前面添加
@profile标记,如下:
In [1]: from primes import primes
In [2]: %mprun -f primes primes(1000)
In [3]: %lprun -f primes primes(1000)
找到内存泄露的地方
cPython利用对象的引用计数来维护内存的使用,当某个对象被保存一次时,该对象的引用次数就会加1,某个对象被删除一次时,该对象的引用次数就减1,当引用次数为零时,删除该对象。
当某个对象已经不再使用了,但是他的引用还存在,那么就会出现内存泄露。
要检测内存泄露,这里我们需要用到模块
objgraph,使用下面命令安装该模块
pip install objgraph
(注意这个模块需要安装
python的
xdot模块和
graphviz程序,而且需要配置
xdot和
dot的环境变量,如果在windows上提示找不到
xdot,需要重命名
xdot.exe为
xdot,
dot.exe为
dot)
在代码中使用一下代码打开调试模式:
import pdb; pdb.set_trace()
获取使用最多的前20个对象
使用下面的命令:(pdb) import objgraph (pdb) objgraph.show_most_common_types() MyBigFatObject 20000 tuple 16938 function 4310 dict 2790 wrapper_descriptor 1181 builtin_function_or_method 934 weakref 764 list 634 method_descriptor 507 getset_descriptor 451 type 439
获取增加和删除的对象
使用下面的命令:(pdb) import objgraph (pdb) objgraph.show_growth() . . . (pdb) objgraph.show_growth() # this only shows objects that has been added or deleted since last show_growth() call traceback 4 +2 KeyboardInterrupt 1 +1 frame 24 +1 list 667 +1 tuple 16969 +1
那些对象被引用
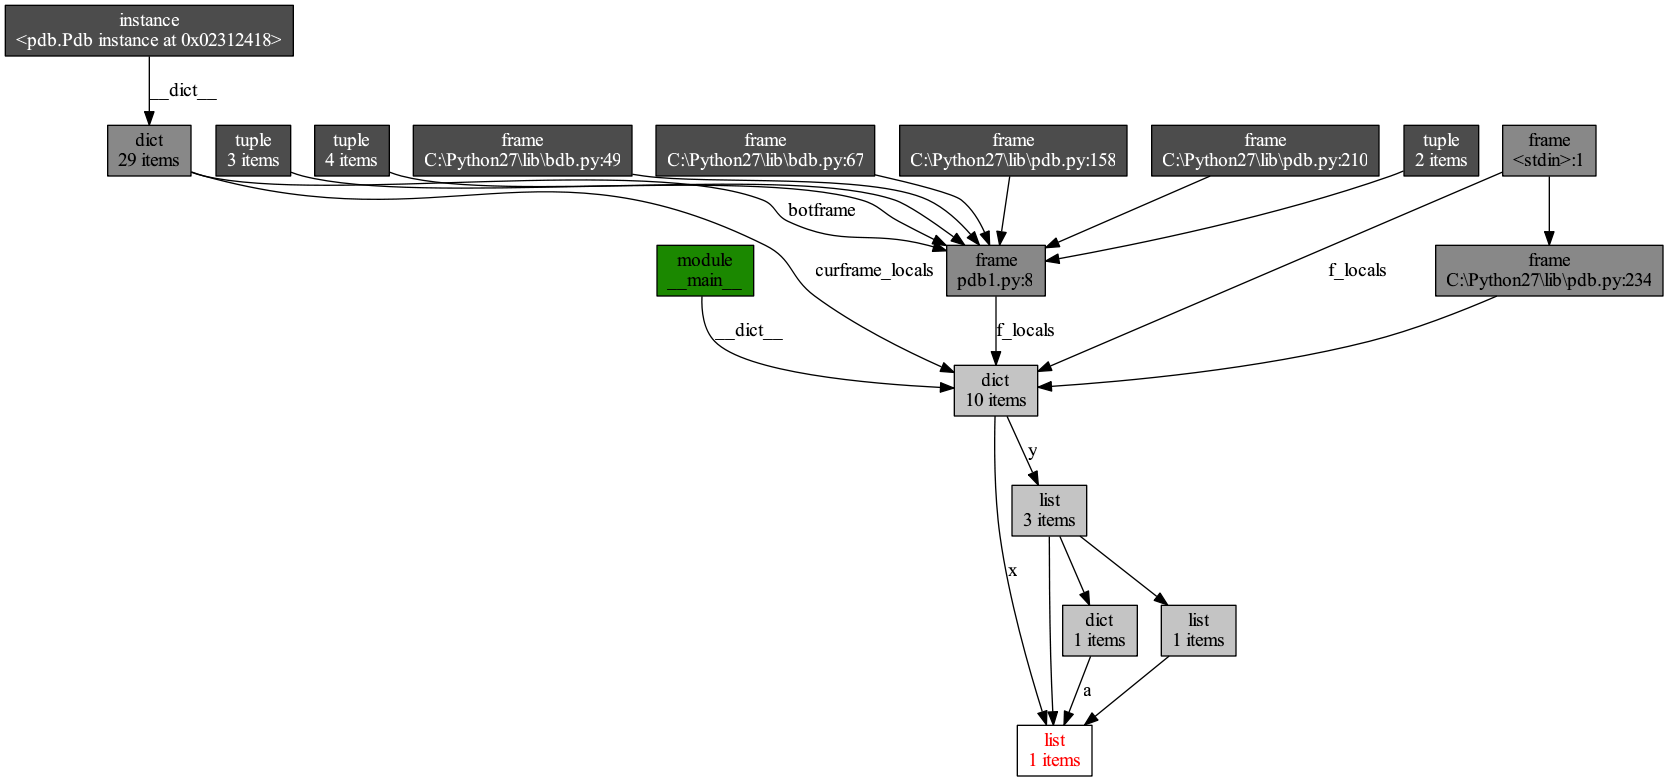
以下面代码为例:x = [1]
y = [x, [x], {"a":x}]
import pdb; pdb.set_trace()
执行下面命令:
(pdb) import objgraph
(pdb) objgraph.show_backref([x], filename="/tmp/backrefs.png")
输出下面的图片:
图片最底下的红色字母表示的对象是我们做所关注的,它显示了那些变量引用了这个对象。
总的来说哦,
objgraph会告诉我们:
占用内存的对象
在一段时间内对象的增加和删除
对象的所有引用

相关文章推荐
- 如何使用strace+pstack利器分析程序性能
- 如何进行 Python性能分析,你才能如鱼得水?
- Python程序的性能分析指南
- 如何使用strace+pstack利器分析程序性能
- 如何使用strace+pstack利器分析程序性能
- 如何使用strace+pstack利器分析程序性能
- 如何使用strace+pstack利器分析程序性能
- python 程序的性能分析优化(huffman编码程序性能分析的一个小结论)
- 一个python 服务器程序性能分析
- python程序性能分析
- 如何使用strace+pstack利器分析程序性能
- Python程序的性能分析指南
- 如何使用strace+pstack利器分析程序性能
- 如何使用strace+pstack利器分析程序性能
- 如何使用strace+pstack利器分析程序性能
- 如何使用strace+pstack利器分析程序性能
- 如何让程序跑得更快些?——试试Visual Studio中的性能分析工具 (By Jun Guo)
- Python程序的性能分析指南
- Python程序的性能分析指南
- 使用cProfiler对Python程序进行性能分析