Matlab中线性空间滤波实析
2013-12-17 13:27
537 查看
基本知识
imfilter函数Multidimensional image filtering
格式:
B = imfilter(A,H)
B = imfilter(A,H,option1,option2,...)参数:
B = imfilter(A,H)filters the multidimensional array
Awith the multidimensional filter
H. The array,
A,can be a non-sparse numeric array of any class and dimension. The result,
B, has the same size and class as
A.
Each element of the output,
B, is computed using double-precision floating point. If
Ais an integer array, then output elements that exceed the range of the integer type are truncated, and fractional values are rounded.
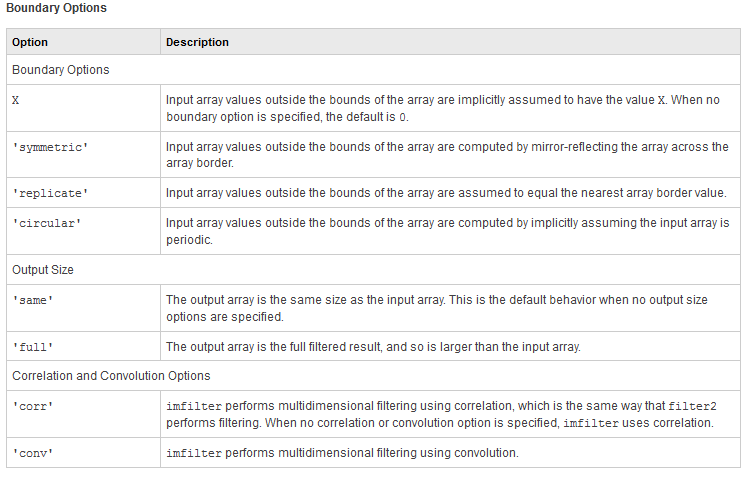
B = imfilter(A,H,option1,option2,...)performs multidimensional filtering according to the specified options. Option arguments can have the following values.
参数说明:
参数X(无引号),'replicate','symmetric','circular' 这个参数其实就是如何补外边界的数字
调用方法及其效果(红色为原来的矩阵t,黄色的为补上的外圈,因为w是3*3的矩阵,所以外围加两圈,这里只对左上角进行分析,其他区域完全类似。
imfilter(t,w,3)如图1所示,简单得在外围加上数字;imfilter(t,w,'symmetric')如图2所示,对称的时候需要注意,左右(2,3)上下(4,7)要对称,斜边也要对称(如5,9,8,6); imfilter(t,w,'replicate')如图3所示,可以先加外围一圈(1,4,7,1,2,3)斜边上的(1)就和红色区域的左上角一致.而circular待于理解(注:图1~图7中图片均来网络中)。

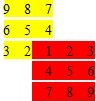

图1 图2 图3
参数“full”和“same”
假设1-D:x=[1 1 1 1 1]和h = [1 1 1];那么,imfilter(x, h, 'full')的结果是 ans1 = [1 2 3 3 3 2 1] 其大小size(x)+size(h)-1。而参数是full,对齐的位置如图4(黄色区域)所示。imfilter(x, h, 'same') 的结果是 ans2=[2 3 3 3 2 ] 其大小和x是一样的. 参数是same,对齐的位置如图5 (黄色区域)所示。而2-D:x = ones[5,5] 和h=[3,3];那么imfilter(x, h, 'full')中参数是"full"对齐的样子(黄色区域)如图6所示。imfilter(x, h, 'same')中参数是same,对齐的位置如图7(黄色区域)所示。
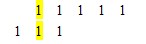

图4 图5

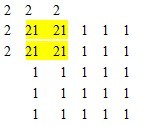
图6 图7
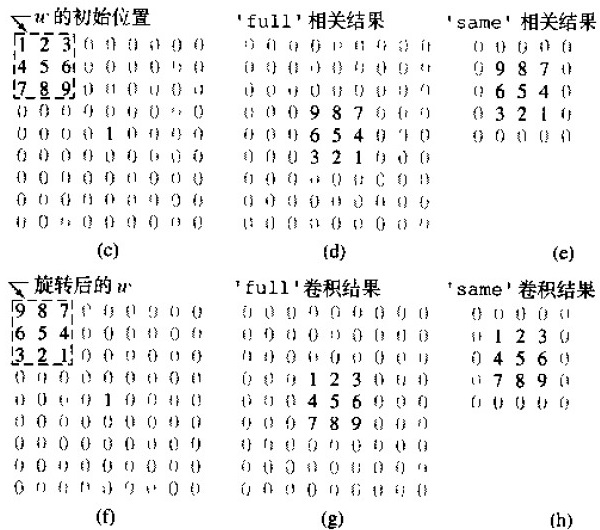
参数‘corr’和“conv”
卷积和相关是这些参数中,最好理解的。卷积就是会将h转180度。而相关是不对h最任何操作的。如下图所示(此图片来自冈萨雷斯所著作的<<图像处理>>一书中):
参考代码
clear all;
close all;
clc;
rgb=imread('test.jpg');
subplot(2,3,1),imshow(rgb)
title('Original Image');
%w = ones(3);
%w =[1 4 1;1 0 1;1 0 1];
w =ones(4);
gd =imfilter(rgb,w);
subplot(2,3,2),imshow(gd);
title('Filtered Image');
gr =imfilter(rgb,w,'replicate');
subplot(2,3,3),imshow(gr);
title('Filtered with boundary replicate');
gs =imfilter(rgb,w,'symmetric');
subplot(2,3,4),imshow(gs);
title('Filtered with boundary symmetric');
gc =imfilter(rgb,w,'circular');
subplot(2,3,5),imshow(gc);
title('Filtered with boundary circular');
f8= im2uint8(rgb);
g8r =imfilter(f8,w,'replicate');
subplot(2,3,6),imshow(g8r);
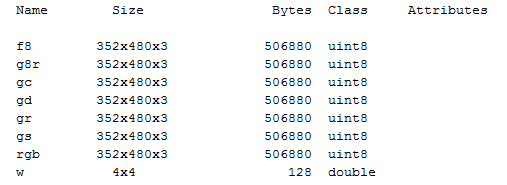
title('Filtered with boundary replicate& im2unint8');实验结果
图像数据输出结果如下所示:
参考资料
[1] MathMorks Documentation Center :Imfilterhttp://www.mathworks.cn/cn/help/images/ref/imfilter.html关于Image Engineering & Computer Vision的更多讨论与交流,敬请关注本博和新浪微博songzi_tea

相关文章推荐
- Matlab中常用的空间域滤波和频率域滤波
- MATLAB中实现图像的空间域滤波和频率域滤波
- 用matlab实现视频的空间滤波和直方图均衡化
- Matlab fspecial和imfilter对图像进行空间滤波
- 有关线性代数的Matlab代码笔记(2)——行空间、零空间
- 【matlab】空间滤波
- MATLAB中实现图像的空间域滤波和频率域滤波
- 空间滤波_MATLAB
- 用matlab实现视频的空间滤波和直方图均衡化
- 【图像处理】MATLAB:仅有噪声的复原(空间滤波)
- 彩色图像空间滤波(MATLAB)
- MATLAB中实现图像的空间域滤波和频率域滤波
- Matlab数字图像 空间滤波
- 有关线性代数的Matlab代码笔记(3)——左零空间、二维图像绘制
- MatLab 均值滤波、中值滤波、高斯滤波
- 数字图像处理-空间域增强(四)(空间域滤波)
- Matlab图像增强——空间域图像增强之基础
- matlab 实现数字图像的傅立叶变换及滤波锐化
- 灰度变换与空间滤波
- MyMathLib系列(线性空间)