Linux下利用Valgrind工具进行内存泄露检测和性能分析
2013-10-21 00:08
741 查看
Valgrind通常用来成分析程序性能及程序中的内存泄露错误
一 Valgrind工具集简绍
Valgrind包含下列工具:
1、memcheck:检查程序中的内存问题,如泄漏、越界、非法指针等。
2、callgrind:检测程序代码的运行时间和调用过程,以及分析程序性能。
3、cachegrind:分析CPU的cache命中率、丢失率,用于进行代码优化。
4、helgrind:用于检查多线程程序的竞态条件。
5、massif:堆栈分析器,指示程序中使用了多少堆内存等信息。
6、lackey:
7、nulgrind:
这几个工具的使用是通过命令:valgrand --tool=name 程序名来分别调用的,当不指定tool参数时默认是 --tool=memcheck
二 Valgrind工具详解
1.Memcheck
最常用的工具,用来检测程序中出现的内存问题,所有对内存的读写都会被检测到,一切对malloc、free、new、delete的调用都会被捕获。所以,它能检测以下问题:
1、对未初始化内存的使用;
2、读/写释放后的内存块;
3、读/写超出malloc分配的内存块;
4、读/写不适当的栈中内存块;
5、内存泄漏,指向一块内存的指针永远丢失;
6、不正确的malloc/free或new/delete匹配;
7、memcpy()相关函数中的dst和src指针重叠。
这些问题往往是C/C++程序员最头疼的问题,Memcheck能在这里帮上大忙。
例如:
#include <stdlib.h>
#include <malloc.h>
#include <string.h>
void test()
{
int *ptr = malloc(sizeof(int)*10);
ptr[10] = 7; // 内存越界
memcpy(ptr +1, ptr, 5); // 踩内存
free(ptr);
free(ptr);// 重复释放
int *p1;
*p1 = 1; // 非法指针
}
int main(void)
{
test();
return 0;
}
将程序编译生成可执行文件后执行:valgrind
--leak-check=full ./程序名
输出结果如下:
==4832== Memcheck, a memory error detector
==4832== Copyright (C) 2002-2010, and GNU GPL'd, by Julian Seward et al.
==4832== Using Valgrind-3.6.1 and LibVEX; rerun with -h for copyright info
==4832== Command: ./tmp
==4832==
==4832== Invalid write of size 4 // 内存越界
==4832== at 0x804843F: test (in /home/yanghao/Desktop/testC/testmem/tmp)
==4832== by 0x804848D: main (in /home/yanghao/Desktop/testC/testmem/tmp)
==4832== Address 0x41a6050 is 0 bytes after a block of size 40 alloc'd
==4832== at 0x4026864: malloc (vg_replace_malloc.c:236)
==4832== by 0x8048435: test (in /home/yanghao/Desktop/testC/testmem/tmp)
==4832== by 0x804848D: main (in /home/yanghao/Desktop/testC/testmem/tmp)
==4832==
==4832== Source and destination overlap in memcpy(0x41a602c, 0x41a6028, 5) // 踩内存
==4832== at 0x4027BD6: memcpy (mc_replace_strmem.c:635)
==4832== by 0x8048461: test (in /home/yanghao/Desktop/testC/testmem/tmp)
==4832== by 0x804848D: main (in /home/yanghao/Desktop/testC/testmem/tmp)
==4832==
==4832== Invalid free() / delete / delete[] // 重复释放
==4832== at 0x4025BF0: free (vg_replace_malloc.c:366)
==4832== by 0x8048477: test (in /home/yanghao/Desktop/testC/testmem/tmp)
==4832== by 0x804848D: main (in /home/yanghao/Desktop/testC/testmem/tmp)
==4832== Address 0x41a6028 is 0 bytes inside a block of size 40 free'd
==4832== at 0x4025BF0: free (vg_replace_malloc.c:366)
==4832== by 0x804846C: test (in /home/yanghao/Desktop/testC/testmem/tmp)
==4832== by 0x804848D: main (in /home/yanghao/Desktop/testC/testmem/tmp)
==4832==
==4832== Use of uninitialised value of size 4 // 非法指针
==4832== at 0x804847B: test (in /home/yanghao/Desktop/testC/testmem/tmp)
==4832== by 0x804848D: main (in /home/yanghao/Desktop/testC/testmem/tmp)
==4832==
==4832==
==4832== Process terminating with default action of signal 11 (SIGSEGV) //由于非法指针赋值导致的程序崩溃
==4832== Bad permissions for mapped region at address 0x419FFF4
==4832== at 0x804847B: test (in /home/yanghao/Desktop/testC/testmem/tmp)
==4832== by 0x804848D: main (in /home/yanghao/Desktop/testC/testmem/tmp)
==4832==
==4832== HEAP SUMMARY:
==4832== in use at exit: 0 bytes in 0 blocks
==4832== total heap usage: 1 allocs, 2 frees, 40 bytes allocated
==4832==
==4832== All heap blocks were freed -- no leaks are possible
==4832==
==4832== For counts of detected and suppressed errors, rerun with: -v
==4832== Use --track-origins=yes to see where uninitialised values come from
==4832== ERROR SUMMARY: 4 errors from 4 contexts (suppressed: 11 from 6)
Segmentation fault
从valgrind的检测输出结果看,这几个错误都找了出来。
2.Callgrind
和gprof类似的分析工具,但它对程序的运行观察更是入微,能给我们提供更多的信息。和gprof不同,它不需要在编译源代码时附加特殊选项,但加上调试选项是推荐的。Callgrind收集程序运行时的一些数据,建立函数调用关系图,还可以有选择地进行cache模拟。在运行结束时,它会把分析数据写入一个文件。callgrind_annotate可以把这个文件的内容转化成可读的形式。
生成可视化的图形需要下载gprof2dot:http://http://jrfonseca.googlecode.com/svn/trunk/gprof2dot/gprof2dot.py
这是个python脚本,把它下载之后修改其权限chmod +7 gprof2dot.py ,并把这个脚本添加到$PATH路径中的任一文件夹下,我是将它放到了/usr/bin目录下,这样就可以直接在终端下执行gprof2dot.py了。
Callgrind可以生成程序性能分析的图形,首先来说说程序性能分析的工具吧,通常可以使用gnu自带的gprof,它的使用方法是:在编译程序时添加-pg参数,例如:
#include <stdio.h>
#include <malloc.h>
void test()
{
sleep(1);
}
void f()
{
int i;
for( i = 0; i < 5; i ++)
test();
}
int main()
{
f();
printf("process is over!\n");
return 0;
}
首先执行 gcc -pg -o tmp tmp.c,然后运行该程序./tmp,程序运行完成后会在当前目录下生成gmon.out文件(这个文件gprof在分析程序时需要),
再执行gprof ./tmp | gprof2dot.py |dot -Tpng -o report.png,打开report.png结果:
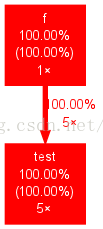
显示test被调用了5次,程序中耗时所占百分比最多的是test函数。
再来看 Callgrind的生成调用图过程吧,执行:valgrind --tool=callgrind ./tmp,执行完成后在目录下生成"callgrind.out.XXX"的文件这是分析文件,可以直接利用:callgrind_annotate callgrind.out.XXX 打印结果,也可以使用:gprof2dot.py -f callgrind callgrind.out.XXX |dot -Tpng -o report.png
来生成图形化结果:
它生成的结果非常详细,甚至连函数入口,及库函数调用都标识出来了。
一 Valgrind工具集简绍
Valgrind包含下列工具:
1、memcheck:检查程序中的内存问题,如泄漏、越界、非法指针等。
2、callgrind:检测程序代码的运行时间和调用过程,以及分析程序性能。
3、cachegrind:分析CPU的cache命中率、丢失率,用于进行代码优化。
4、helgrind:用于检查多线程程序的竞态条件。
5、massif:堆栈分析器,指示程序中使用了多少堆内存等信息。
6、lackey:
7、nulgrind:
这几个工具的使用是通过命令:valgrand --tool=name 程序名来分别调用的,当不指定tool参数时默认是 --tool=memcheck
二 Valgrind工具详解
1.Memcheck
最常用的工具,用来检测程序中出现的内存问题,所有对内存的读写都会被检测到,一切对malloc、free、new、delete的调用都会被捕获。所以,它能检测以下问题:
1、对未初始化内存的使用;
2、读/写释放后的内存块;
3、读/写超出malloc分配的内存块;
4、读/写不适当的栈中内存块;
5、内存泄漏,指向一块内存的指针永远丢失;
6、不正确的malloc/free或new/delete匹配;
7、memcpy()相关函数中的dst和src指针重叠。
这些问题往往是C/C++程序员最头疼的问题,Memcheck能在这里帮上大忙。
例如:
#include <stdlib.h>
#include <malloc.h>
#include <string.h>
void test()
{
int *ptr = malloc(sizeof(int)*10);
ptr[10] = 7; // 内存越界
memcpy(ptr +1, ptr, 5); // 踩内存
free(ptr);
free(ptr);// 重复释放
int *p1;
*p1 = 1; // 非法指针
}
int main(void)
{
test();
return 0;
}
将程序编译生成可执行文件后执行:valgrind
--leak-check=full ./程序名
输出结果如下:
==4832== Memcheck, a memory error detector
==4832== Copyright (C) 2002-2010, and GNU GPL'd, by Julian Seward et al.
==4832== Using Valgrind-3.6.1 and LibVEX; rerun with -h for copyright info
==4832== Command: ./tmp
==4832==
==4832== Invalid write of size 4 // 内存越界
==4832== at 0x804843F: test (in /home/yanghao/Desktop/testC/testmem/tmp)
==4832== by 0x804848D: main (in /home/yanghao/Desktop/testC/testmem/tmp)
==4832== Address 0x41a6050 is 0 bytes after a block of size 40 alloc'd
==4832== at 0x4026864: malloc (vg_replace_malloc.c:236)
==4832== by 0x8048435: test (in /home/yanghao/Desktop/testC/testmem/tmp)
==4832== by 0x804848D: main (in /home/yanghao/Desktop/testC/testmem/tmp)
==4832==
==4832== Source and destination overlap in memcpy(0x41a602c, 0x41a6028, 5) // 踩内存
==4832== at 0x4027BD6: memcpy (mc_replace_strmem.c:635)
==4832== by 0x8048461: test (in /home/yanghao/Desktop/testC/testmem/tmp)
==4832== by 0x804848D: main (in /home/yanghao/Desktop/testC/testmem/tmp)
==4832==
==4832== Invalid free() / delete / delete[] // 重复释放
==4832== at 0x4025BF0: free (vg_replace_malloc.c:366)
==4832== by 0x8048477: test (in /home/yanghao/Desktop/testC/testmem/tmp)
==4832== by 0x804848D: main (in /home/yanghao/Desktop/testC/testmem/tmp)
==4832== Address 0x41a6028 is 0 bytes inside a block of size 40 free'd
==4832== at 0x4025BF0: free (vg_replace_malloc.c:366)
==4832== by 0x804846C: test (in /home/yanghao/Desktop/testC/testmem/tmp)
==4832== by 0x804848D: main (in /home/yanghao/Desktop/testC/testmem/tmp)
==4832==
==4832== Use of uninitialised value of size 4 // 非法指针
==4832== at 0x804847B: test (in /home/yanghao/Desktop/testC/testmem/tmp)
==4832== by 0x804848D: main (in /home/yanghao/Desktop/testC/testmem/tmp)
==4832==
==4832==
==4832== Process terminating with default action of signal 11 (SIGSEGV) //由于非法指针赋值导致的程序崩溃
==4832== Bad permissions for mapped region at address 0x419FFF4
==4832== at 0x804847B: test (in /home/yanghao/Desktop/testC/testmem/tmp)
==4832== by 0x804848D: main (in /home/yanghao/Desktop/testC/testmem/tmp)
==4832==
==4832== HEAP SUMMARY:
==4832== in use at exit: 0 bytes in 0 blocks
==4832== total heap usage: 1 allocs, 2 frees, 40 bytes allocated
==4832==
==4832== All heap blocks were freed -- no leaks are possible
==4832==
==4832== For counts of detected and suppressed errors, rerun with: -v
==4832== Use --track-origins=yes to see where uninitialised values come from
==4832== ERROR SUMMARY: 4 errors from 4 contexts (suppressed: 11 from 6)
Segmentation fault
从valgrind的检测输出结果看,这几个错误都找了出来。
2.Callgrind
和gprof类似的分析工具,但它对程序的运行观察更是入微,能给我们提供更多的信息。和gprof不同,它不需要在编译源代码时附加特殊选项,但加上调试选项是推荐的。Callgrind收集程序运行时的一些数据,建立函数调用关系图,还可以有选择地进行cache模拟。在运行结束时,它会把分析数据写入一个文件。callgrind_annotate可以把这个文件的内容转化成可读的形式。
生成可视化的图形需要下载gprof2dot:http://http://jrfonseca.googlecode.com/svn/trunk/gprof2dot/gprof2dot.py
这是个python脚本,把它下载之后修改其权限chmod +7 gprof2dot.py ,并把这个脚本添加到$PATH路径中的任一文件夹下,我是将它放到了/usr/bin目录下,这样就可以直接在终端下执行gprof2dot.py了。
Callgrind可以生成程序性能分析的图形,首先来说说程序性能分析的工具吧,通常可以使用gnu自带的gprof,它的使用方法是:在编译程序时添加-pg参数,例如:
#include <stdio.h>
#include <malloc.h>
void test()
{
sleep(1);
}
void f()
{
int i;
for( i = 0; i < 5; i ++)
test();
}
int main()
{
f();
printf("process is over!\n");
return 0;
}
首先执行 gcc -pg -o tmp tmp.c,然后运行该程序./tmp,程序运行完成后会在当前目录下生成gmon.out文件(这个文件gprof在分析程序时需要),
再执行gprof ./tmp | gprof2dot.py |dot -Tpng -o report.png,打开report.png结果:
显示test被调用了5次,程序中耗时所占百分比最多的是test函数。
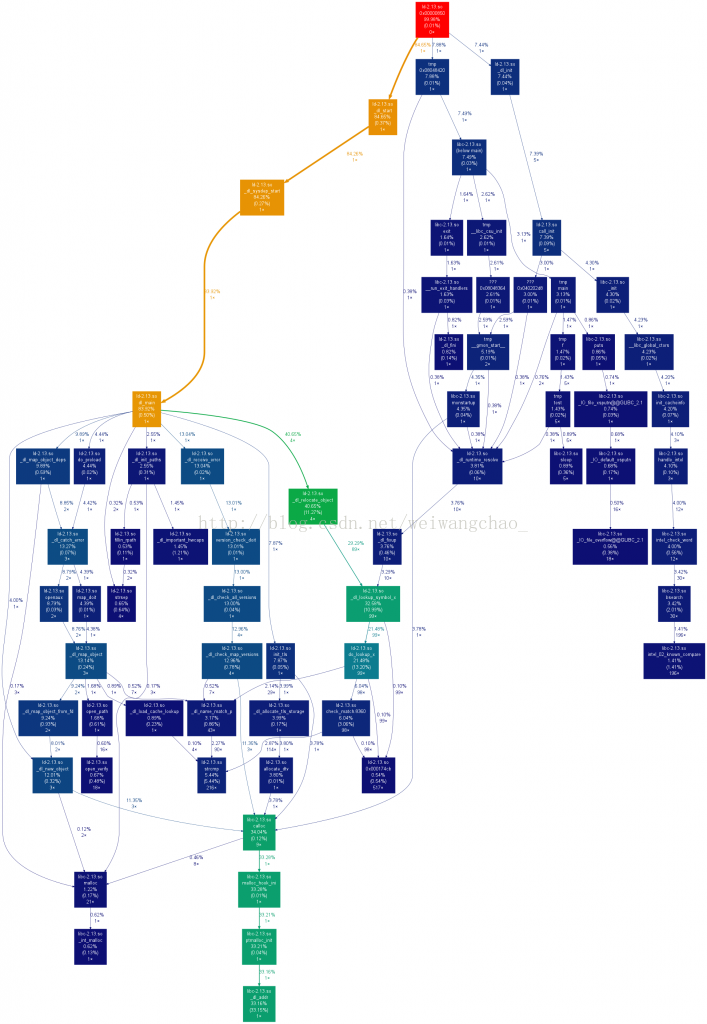
再来看 Callgrind的生成调用图过程吧,执行:valgrind --tool=callgrind ./tmp,执行完成后在目录下生成"callgrind.out.XXX"的文件这是分析文件,可以直接利用:callgrind_annotate callgrind.out.XXX 打印结果,也可以使用:gprof2dot.py -f callgrind callgrind.out.XXX |dot -Tpng -o report.png
来生成图形化结果:
它生成的结果非常详细,甚至连函数入口,及库函数调用都标识出来了。

相关文章推荐
- linux下利用valgrind工具进行内存泄露检测和性能分析
- linux下利用valgrind工具进行内存泄露检测和性能分析
- linux下利用valgrind工具进行内存泄露检测和性能分析
- linux下利用valgrind工具进行内存泄露检测和性能分析
- linux下利用valgrind工具进行内存泄露检测和性能分析
- <2012 12 02> linux下利用valgrind工具进行内存泄露检测和性能分析
- Linux下利用Valgrind工具进行内存泄露检测和性能分析
- linux下利用valgrind工具进行内存泄露检测和性能分析
- Linux下利用Valgrind工具进行内存泄露检测和性能分析
- Linux下利用Valgrind工具进行内存泄露检测和性能分析
- linux下利用valgrind工具进行内存泄露检测和性能分析
- linux下利用valgrind工具进行内存泄露检测和性能分析
- linux下利用valgrind工具进行内存泄露检测和性能分析
- Linux下利用Valgrind工具进行内存泄露检测和性能分析
- arm linux下交叉编译valgrind工具进行内存泄露检测和性能分析
- Linux下性能分析工具和内存泄露检测工具的简介(Valgrind和gprof)
- valgrind: 一款用于内存调试、内存泄漏检测以及性能分析的软件开发工具
- Valgrind ---内存调试,内存泄漏检测以及性能分析的软件开发工具
- 使用valgrind的callgrind工具进行多线程性能分析
- Unix/Linux下C程序内存泄露检测工具Valgrind的安装和使用