【D3.js数据可视化系列教程】--(十五)SVG基本图形绘制
2013-09-17 19:04
826 查看
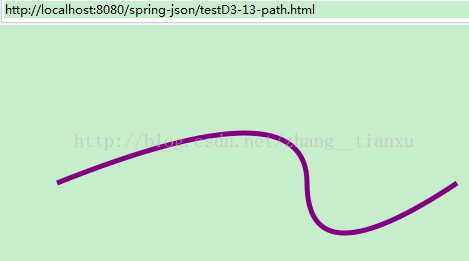
1. 路径
// 在 body 中插入一個 svg
var svg = d3.select('body').append('svg');

// 在 svg 中插入一個 path
svg.append('path').attr({
d: 'M50 150Q300 50 300 150T450 150'
}).style({
fill: 'none',
stroke: 'purple',
'stroke-width': 5
});
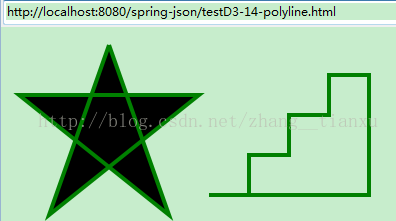
2. 折线
// 在 body 中插入一個 svg
var svg = d3.select('body').append('svg');

// 在 svg 中插入 polyline
svg.append('polyline').attr({
points: '100,10 40,180 190,60 10,60 160,180 100,10'
}).style({
fill: 'black',
stroke: 'green',
'stroke-width': 4
});

// 在 svg 中插入 polyline
svg.append('polyline').attr({
points: '200,160 240,160 240,120 280,120 280,80 320,80 320,40 360,40 360,160 240,160'
}).style({
fill: 'none',
stroke: 'green',
'stroke-width': 4
});
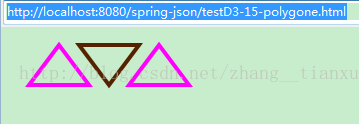
3. 多边形
// 在 body 中插入一個 svg
var svg = d3.select('body').append('svg');
// 在 svg 中插入 polygon
svg.append('polygon').attr({
points: '50,10 20,50 80,50'
}).style({
fill: 'none',
stroke: '#f0f',
'stroke-width': 4
});

// 在 svg 中插入 polygon
svg.append('polygon').attr({
points: '70,10 130,10 100,50 '
}).style({
fill: 'none',
stroke: '#520',
'stroke-width': 4
});

// 在 svg 中插入 polygon
svg.append('polygon').attr({
points: '150,10 120,50 180,50'
}).style({
fill: 'none',
stroke: '#f0f',
'stroke-width': 4
});
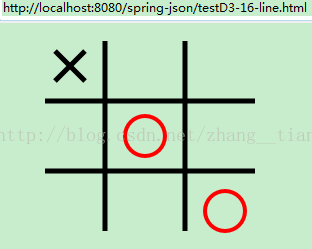
4. 直线
// 在 body 中插入一個 svg
var svg = d3.select('body').append('svg');

// 在 svg 中插入 line
svg.append('line').attr({
x1: 40,
y1: 70,
x2: 250,
y2: 70
}).style({
stroke: 'black',
'stroke-width': 5
});

// 在 svg 中插入 line
svg.append('line').attr({
x1: 40,
y1: 140,
x2: 250,
y2: 140
}).style({
stroke: 'black',
'stroke-width': 5
});

// 在 svg 中插入 line
svg.append('line').attr({
x1: 100,
y1: 10,
x2: 100,
y2: 200
}).style({
stroke: 'black',
'stroke-width': 5
});

// 在 svg 中插入 line
svg.append('line').attr({
x1: 180,
y1: 10,
x2: 180,
y2: 200
}).style({
stroke: 'black',
'stroke-width': 5
});

// 在 svg 中插入 circle
svg.append('circle').attr({
cx: 140,
cy: 105,
r: 20
}).style({
fill: 'none',
stroke: 'red',
'stroke-width': 4
});

// 在 svg 中插入 line
svg.append('line').attr({
x1: 50,
y1: 20,
x2: 80,
y2: 50
}).style({
stroke: 'black',
'stroke-width': 5
});

// 在 svg 中插入 line
svg.append('line').attr({
x1: 80,
y1: 20,
x2: 50,
y2: 50
}).style({
stroke: 'black',
'stroke-width': 5
});

// 在 svg 中插入 circle
svg.append('circle').attr({
cx: 220,
cy: 180,
r: 20
}).style({
fill: 'none',
stroke: 'red',
'stroke-width': 4
});
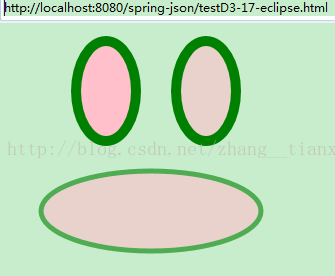
5. 椭圆
// 在 body 中插入一個 svg
var svg = d3.select('body').append('svg');

// 在 svg 中插入 ellipse
svg.append('ellipse').attr({
cx: 100,
cy: 60,
rx: 30,
ry: 50
}).style({
fill: 'pink',
stroke: 'green',
'stroke-width': 10
});

// 在 svg 中插入 ellipse
svg.append('ellipse').attr({
cx: 200,
cy: 60,
rx: 30,
ry: 50
}).style({
fill: 'pink',
stroke: 'green',
'stroke-width': 10,
'fill-opacity': .6
});

// 在 svg 中插入 ellipse
svg.append('ellipse').attr({
cx: 145,
cy: 180,
rx: 110,
ry: 40
}).style({
fill: 'pink',
stroke: 'green',
'stroke-width': 5,
opacity: .6
});

相关文章推荐
- 【D3.V3.js系列教程】--(十五)SVG基本图形绘制
- 【D3.V3.js系列教程】--(十五)SVG基本图形绘制
- 【D3.js数据可视化系列教程】--(八)使用D3绘制SVG
- Android游戏开发系列教程第二讲(基本图形绘制)
- 【D3.V3.js数据可视化系列教程】--(八)绘制SVG
- 【D3.js数据可视化系列教程】(二十六)--加载SVG文件
- 利用SVG path绘制图形--基本图形
- 【D3.js数据可视化系列教程】--(四)使用数据
- 【D3.js数据可视化系列教程】--(九)D3的数据类型
- CSS 魔法系列:纯 CSS 绘制基本图形(圆、椭圆等)
- HTML5之Canvas绘图——使用Canvas绘制图形的基本教程
- 【D3.js数据可视化系列教程】--(五)用层画条形图
- Android OpenGL ES2.0编程教程系列之绘制图形(三)
- Android绘图系列(二)——自定义View绘制基本图形
- 【D3.js数据可视化系列教程】(二十三)--饼图圆环图
- 【D3.js数据可视化系列教程】(三十)--力导向图之带文字
- 【D3.js数据可视化系列教程】(三十三)-- 力导向图之图片和提示
- d3 svg 基本图形绘制
- 使用HTML5进行SVG矢量图形绘制的入门教程
- 使用Canvas绘制图形的基本教程