linux环境下 C++性能测试工具 gprof + kprof + gprof2dot
2013-05-21 09:08
162 查看
1.gprof
很有名了,google下很多教程
g++ -pg -g -o test test.cc
./test //会生成gmon.out
gprof ./test > prof.log
看一下对于我前面提到的huffman编码压缩+解码解压缩全部过程的一个程序
对于生成的prof.log ,wow, 很有用处的但是看起来有点累,不是吗:)


Code
Flat profile:
Each sample counts as 0.01 seconds.
% cumulative self self total
time seconds seconds calls s/call s/call name
32.51 1.71 1.71 13127166 0.00 0.00 glzip::HuffTree<unsigned char, glzip::decode_hufftree>::decode_byte(unsigned char, glzip::Buffer&, glzip::HuffNode<unsigned char>*&, int)
18.73 2.69 0.98 105017328 0.00 0.00 glzip::Buffer::write_bit(int)
16.63 3.57 0.88 24292128 0.00 0.00 glzip::Buffer::write_string(std::string const&)
7.22 3.95 0.38 61711820 0.00 0.00 glzip::Buffer::read_byte(unsigned char&)
5.80 4.25 0.30 37419691 0.00 0.00 glzip::Buffer::write_byte(unsigned char)
5.51 4.54 0.29 1 0.29 2.48 glzip::Encoder<unsigned char>::do_encode_file(glzip::char_tag)
5.13 4.82 0.27 105017721 0.00 0.00 glzip::HuffNode<unsigned char>::is_leaf()
3.04 4.97 0.16 1 0.16 0.31 glzip::Encoder<unsigned char>::do_caculate_frequency(glzip::char_tag)
2.47 5.11 0.13 1 0.13 2.42 glzip::HuffTree<unsigned char, glzip::decode_hufftree>::decode_file()
1.14 5.17 0.06 24292227 0.00 0.00 std::vector<std::string, std::allocator<std::string> >::operator[](unsigned int)
0.95 5.21 0.05 1 0.05 0.05 glzip::HuffTree<unsigned char, glzip::encode_hufftree>::do_serialize_tree(glzip::HuffNode<unsigned char>*, glzip::Buffer&)
0.29 5.23 0.01 24292133 0.00 0.00 glzip::HuffTreeBase<unsigned char>::root() const
0.29 5.25 0.01 574 0.00 0.00 glzip::Buffer::flush_buf()
0.19 5.25 0.01 6 0.00 0.00 glzip::Buffer::~Buffer()
0.10 5.26 0.01 unsigned int const& std::min<unsigned int>(unsigned int const&, unsigned int const&)
0.00 5.26 0.00 12901 0.00 0.00 std::_Deque_iterator<glzip::HuffNode<unsigned char>*, glzip::HuffNode<unsigned char>*&, glzip::HuffNode<unsigned char>**>::_Deque_iterator(std::_Deque_iterator<glzip::HuffNode<unsigned char>*, glzip::HuffNode<unsigned char>*&,
glzip::HuffNode<unsigned char>**> const&)
0.00 5.26 0.00 6065 0.00 0.00 std::__deque_buf_size(unsigned int)
0.00 5.26 0.00 6056 0.00 0.00 std::_Deque_iterator<glzip::HuffNode<unsigned char>*, glzip::HuffNode<unsigned char>*&, glzip::HuffNode<unsigned char>**>::_S_buffer_size()
0.00 5.26 0.00 5656 0.00 0.00 std::_Deque_iterator<glzip::HuffNode<unsigned char>*, glzip::HuffNode<unsigned char>*&, glzip::HuffNode<unsigned char>**>::operator*() const
0.00 5.26 0.00 5656 0.00 0.00 std::_Deque_iterator<glzip::HuffNode<unsigned char>*, glzip::HuffNode<unsigned char>*&, glzip::HuffNode<unsigned char>**>::operator+=(int)
0.00 5.26 0.00 4871 0.00 0.00 std::_Deque_iterator<glzip::HuffNode<unsigned char>*, glzip::HuffNode<unsigned char>*&, glzip::HuffNode<unsigned char>**>::operator+(int) const
0.00 5.26 0.00 3126 0.00 0.00 glzip::HuffNode<unsigned char>::weight() const
0.00 5.26 0.00 1465 0.00 0.00 glzip::HuffTree<unsigned char, glzip::encode_hufftree>::HuffNodePtrGreater::operator()(glzip::HuffNode<unsigned char> const*, glzip::HuffNode<unsigned char> const*)
0.00 5.26 0.00 946 0.00 0.00 glzip::Buffer::fill_buf()
0.00 5.26 0.00 785 0.00 0.00 std::_Deque_iterator<glzip::HuffNode<unsigned char>*, glzip::HuffNode<unsigned char>*&, glzip::HuffNode<unsigned char>**>::operator-(int) const
0.00 5.26 0.00 785 0.00 0.00 std::_Deque_iterator<glzip::HuffNode<unsigned char>*, glzip::HuffNode<unsigned char>*&, glzip::HuffNode<unsigned char>**>::operator-=(int)
0.00 5.26 0.00 590 0.00 0.00 glzip::HuffNode<unsigned char>::left() const
0.00 5.26 0.00 590 0.00 0.00 glzip::HuffNode<unsigned char>::right() const
0.00 5.26 0.00 453 0.00 0.00 operator new(unsigned int, void*)

.
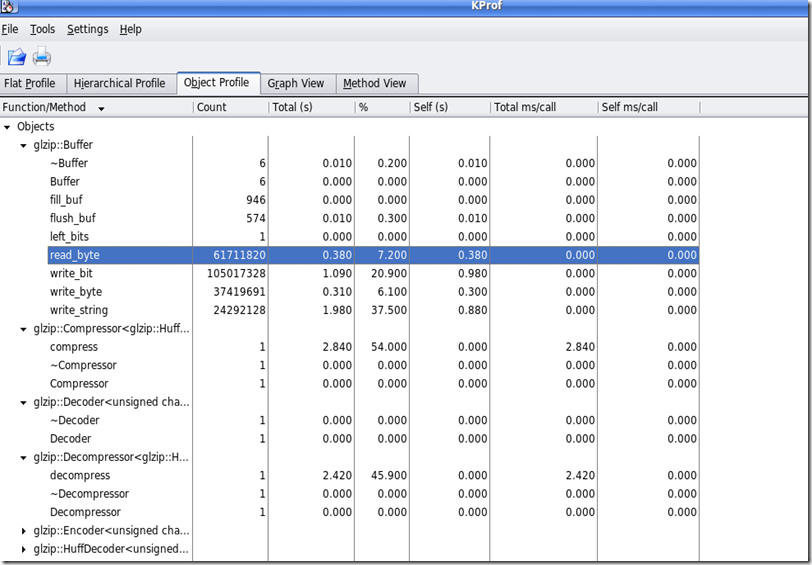
2.Kprof
sudo apt-get install kprof
kprof -f ./test //注意已经按照前面的用gprof生成 gmont.out 了。
将gprof , GUI化了,更加友好,还是很方便的,它也利用而来graphviz绘制了运行时流程图,但是对于大的程序,
似乎效果不太好,流程图感觉完全乱掉了,而且对于大程序,kprof运行的有点慢,在我的破机器上跑半天才出来。
总的来说它的object profile还是很方便有用的。
object profile 示意图
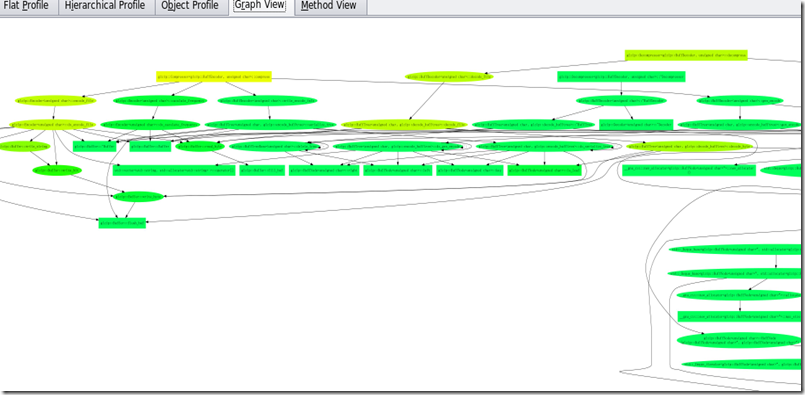
graph view 示意图,这个仅作参考吧,同样是用graphviz怎么和gprof2dot差距这么大呢?:)对比下下面gprof2dot的生成图吧!
3.gprof2dot.py
这个脚本太TMD的牛X了,速度快效果好,怪不得底下评论一片叫好,这就是life_saving的工具啊!
首先就是运行时的程序流程图,网上有很多工具有些就是利用gprof的,有很多文章介绍,都不用看了,就用这个吧。
然后很直观的看出每个步骤的占用时间百分比,函数调用次数,颜色能直观的表示出瓶颈所在。
gprof2dot安装看这里吧
http://www.51testing.com/?uid-13997-action-viewspace-itemid-79952
gprof ./test | gprof2dot.py | xdot
恩 去下载那个xdot.py吧 看dot文件,太方便了,不需要先生成图像了。
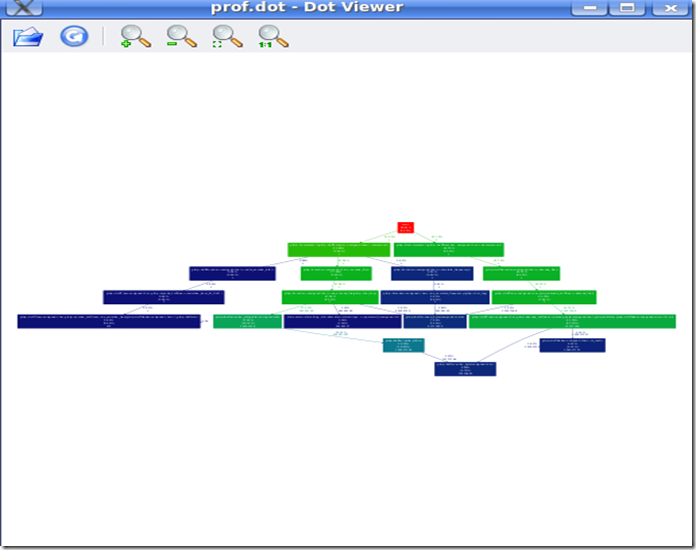
直接看效果图吧!
1.整体图
清晰多了吧,上面那么多冗余的东西。
2.局部图
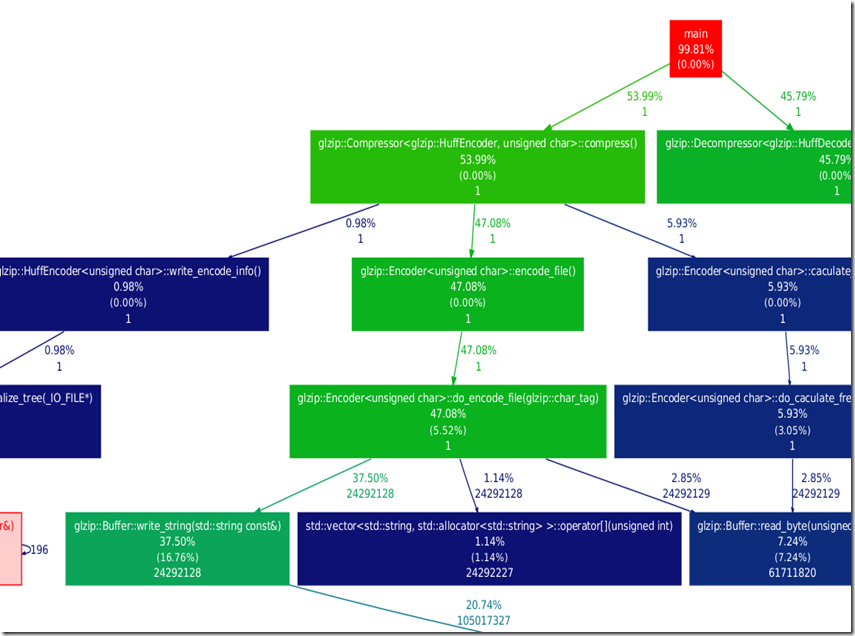
和我的程序执行过程完全对应,清晰明了,太赞了!
每个方框内部显示函数名称,函数整体包括内部子函数占用时间%比,函数自身,不包括内部子函数占用时间%比,函数执行次数。
边表示父函数调用该子函数占用的时间%比,调用次数。
之所以清晰是因为,gprof2dot默认是部分函数调用图,对性能影响不大的函数调用都不显示,例如上图中没有出现类的构造,析构函数,
如果想要显示全部的函数调用,可以 gprof2dot -n0 -e0 ,默认是n0.5即影响小于5%的函数就不显示了。
当然这样图片会很乱,因为显示内容很多,可以 gprof2dot -n0 -e0 -s #-s表示不显示诸如模板,函数入口参数等等,使得
函数名称显示更加精简。
恩,如果用户能决定只输出某个函数及其关联函数的显示信息图就更好了,例如上面有两个
独立的过程compress()和decompress()如果用户能够决定只是显示compress()就好了,
不过考虑到模板之类的稍微有点麻烦,但是应该也是能实现的!
4. google 还有一个开源的能测试工具
以后尝试一下
http://code.google.com/p/google-perftools/wiki/GooglePerformanceTools
很有名了,google下很多教程
g++ -pg -g -o test test.cc
./test //会生成gmon.out
gprof ./test > prof.log
看一下对于我前面提到的huffman编码压缩+解码解压缩全部过程的一个程序
对于生成的prof.log ,wow, 很有用处的但是看起来有点累,不是吗:)
Code
Flat profile:
Each sample counts as 0.01 seconds.
% cumulative self self total
time seconds seconds calls s/call s/call name
32.51 1.71 1.71 13127166 0.00 0.00 glzip::HuffTree<unsigned char, glzip::decode_hufftree>::decode_byte(unsigned char, glzip::Buffer&, glzip::HuffNode<unsigned char>*&, int)
18.73 2.69 0.98 105017328 0.00 0.00 glzip::Buffer::write_bit(int)
16.63 3.57 0.88 24292128 0.00 0.00 glzip::Buffer::write_string(std::string const&)
7.22 3.95 0.38 61711820 0.00 0.00 glzip::Buffer::read_byte(unsigned char&)
5.80 4.25 0.30 37419691 0.00 0.00 glzip::Buffer::write_byte(unsigned char)
5.51 4.54 0.29 1 0.29 2.48 glzip::Encoder<unsigned char>::do_encode_file(glzip::char_tag)
5.13 4.82 0.27 105017721 0.00 0.00 glzip::HuffNode<unsigned char>::is_leaf()
3.04 4.97 0.16 1 0.16 0.31 glzip::Encoder<unsigned char>::do_caculate_frequency(glzip::char_tag)
2.47 5.11 0.13 1 0.13 2.42 glzip::HuffTree<unsigned char, glzip::decode_hufftree>::decode_file()
1.14 5.17 0.06 24292227 0.00 0.00 std::vector<std::string, std::allocator<std::string> >::operator[](unsigned int)
0.95 5.21 0.05 1 0.05 0.05 glzip::HuffTree<unsigned char, glzip::encode_hufftree>::do_serialize_tree(glzip::HuffNode<unsigned char>*, glzip::Buffer&)
0.29 5.23 0.01 24292133 0.00 0.00 glzip::HuffTreeBase<unsigned char>::root() const
0.29 5.25 0.01 574 0.00 0.00 glzip::Buffer::flush_buf()
0.19 5.25 0.01 6 0.00 0.00 glzip::Buffer::~Buffer()
0.10 5.26 0.01 unsigned int const& std::min<unsigned int>(unsigned int const&, unsigned int const&)
0.00 5.26 0.00 12901 0.00 0.00 std::_Deque_iterator<glzip::HuffNode<unsigned char>*, glzip::HuffNode<unsigned char>*&, glzip::HuffNode<unsigned char>**>::_Deque_iterator(std::_Deque_iterator<glzip::HuffNode<unsigned char>*, glzip::HuffNode<unsigned char>*&,
glzip::HuffNode<unsigned char>**> const&)
0.00 5.26 0.00 6065 0.00 0.00 std::__deque_buf_size(unsigned int)
0.00 5.26 0.00 6056 0.00 0.00 std::_Deque_iterator<glzip::HuffNode<unsigned char>*, glzip::HuffNode<unsigned char>*&, glzip::HuffNode<unsigned char>**>::_S_buffer_size()
0.00 5.26 0.00 5656 0.00 0.00 std::_Deque_iterator<glzip::HuffNode<unsigned char>*, glzip::HuffNode<unsigned char>*&, glzip::HuffNode<unsigned char>**>::operator*() const
0.00 5.26 0.00 5656 0.00 0.00 std::_Deque_iterator<glzip::HuffNode<unsigned char>*, glzip::HuffNode<unsigned char>*&, glzip::HuffNode<unsigned char>**>::operator+=(int)
0.00 5.26 0.00 4871 0.00 0.00 std::_Deque_iterator<glzip::HuffNode<unsigned char>*, glzip::HuffNode<unsigned char>*&, glzip::HuffNode<unsigned char>**>::operator+(int) const
0.00 5.26 0.00 3126 0.00 0.00 glzip::HuffNode<unsigned char>::weight() const
0.00 5.26 0.00 1465 0.00 0.00 glzip::HuffTree<unsigned char, glzip::encode_hufftree>::HuffNodePtrGreater::operator()(glzip::HuffNode<unsigned char> const*, glzip::HuffNode<unsigned char> const*)
0.00 5.26 0.00 946 0.00 0.00 glzip::Buffer::fill_buf()
0.00 5.26 0.00 785 0.00 0.00 std::_Deque_iterator<glzip::HuffNode<unsigned char>*, glzip::HuffNode<unsigned char>*&, glzip::HuffNode<unsigned char>**>::operator-(int) const
0.00 5.26 0.00 785 0.00 0.00 std::_Deque_iterator<glzip::HuffNode<unsigned char>*, glzip::HuffNode<unsigned char>*&, glzip::HuffNode<unsigned char>**>::operator-=(int)
0.00 5.26 0.00 590 0.00 0.00 glzip::HuffNode<unsigned char>::left() const
0.00 5.26 0.00 590 0.00 0.00 glzip::HuffNode<unsigned char>::right() const
0.00 5.26 0.00 453 0.00 0.00 operator new(unsigned int, void*)
.
2.Kprof
sudo apt-get install kprof
kprof -f ./test //注意已经按照前面的用gprof生成 gmont.out 了。
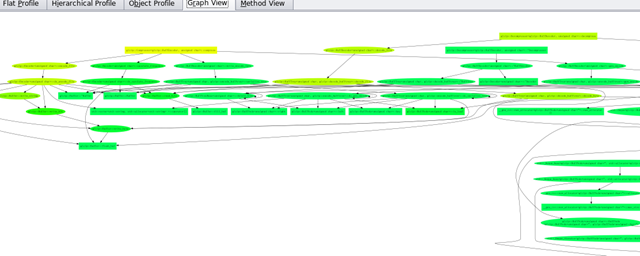
将gprof , GUI化了,更加友好,还是很方便的,它也利用而来graphviz绘制了运行时流程图,但是对于大的程序,
似乎效果不太好,流程图感觉完全乱掉了,而且对于大程序,kprof运行的有点慢,在我的破机器上跑半天才出来。
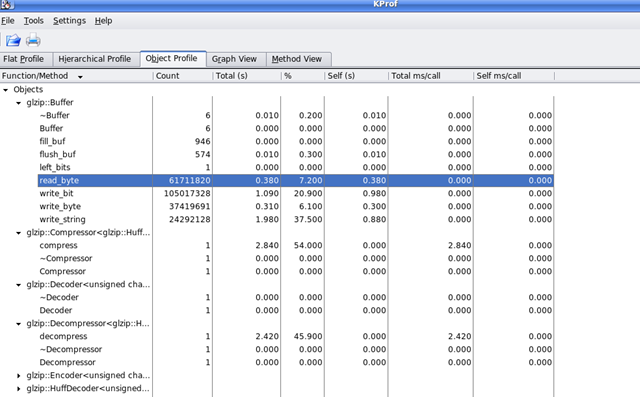
总的来说它的object profile还是很方便有用的。
object profile 示意图
graph view 示意图,这个仅作参考吧,同样是用graphviz怎么和gprof2dot差距这么大呢?:)对比下下面gprof2dot的生成图吧!
3.gprof2dot.py
这个脚本太TMD的牛X了,速度快效果好,怪不得底下评论一片叫好,这就是life_saving的工具啊!
首先就是运行时的程序流程图,网上有很多工具有些就是利用gprof的,有很多文章介绍,都不用看了,就用这个吧。
然后很直观的看出每个步骤的占用时间百分比,函数调用次数,颜色能直观的表示出瓶颈所在。
gprof2dot安装看这里吧
http://www.51testing.com/?uid-13997-action-viewspace-itemid-79952
gprof ./test | gprof2dot.py | xdot
恩 去下载那个xdot.py吧 看dot文件,太方便了,不需要先生成图像了。
直接看效果图吧!
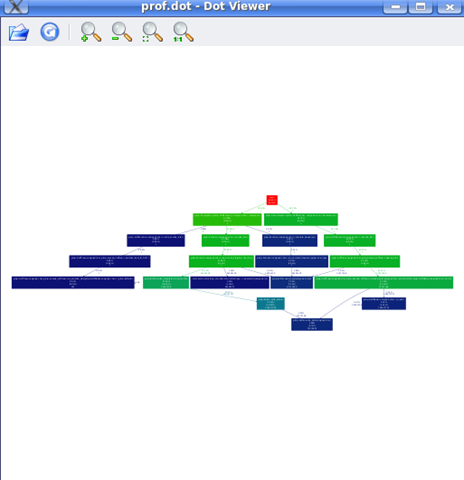
1.整体图
清晰多了吧,上面那么多冗余的东西。
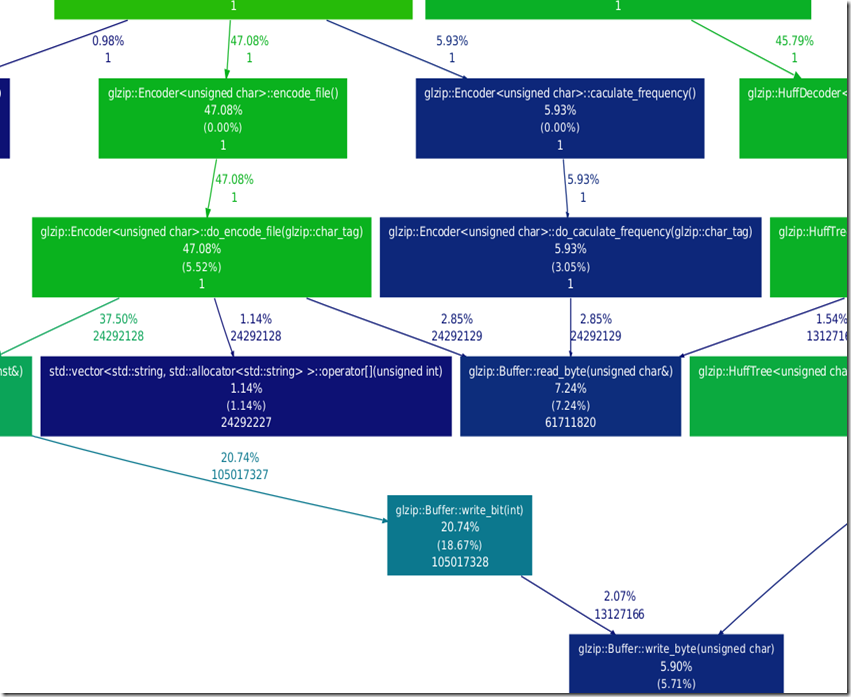
2.局部图


和我的程序执行过程完全对应,清晰明了,太赞了!
每个方框内部显示函数名称,函数整体包括内部子函数占用时间%比,函数自身,不包括内部子函数占用时间%比,函数执行次数。
边表示父函数调用该子函数占用的时间%比,调用次数。
之所以清晰是因为,gprof2dot默认是部分函数调用图,对性能影响不大的函数调用都不显示,例如上图中没有出现类的构造,析构函数,
如果想要显示全部的函数调用,可以 gprof2dot -n0 -e0 ,默认是n0.5即影响小于5%的函数就不显示了。
当然这样图片会很乱,因为显示内容很多,可以 gprof2dot -n0 -e0 -s #-s表示不显示诸如模板,函数入口参数等等,使得
函数名称显示更加精简。
恩,如果用户能决定只输出某个函数及其关联函数的显示信息图就更好了,例如上面有两个
独立的过程compress()和decompress()如果用户能够决定只是显示compress()就好了,
不过考虑到模板之类的稍微有点麻烦,但是应该也是能实现的!
4. google 还有一个开源的能测试工具
以后尝试一下
http://code.google.com/p/google-perftools/wiki/GooglePerformanceTools

相关文章推荐
- linux环境下 C++性能测试工具 gprof + kprof + gprof2dot【转】
- linux环境下 C++性能测试工具 gprof + kprof + gprof2dot
- linux环境下 C++性能测试工具 gprof + kprof + gprof2dot
- linux环境下 C++性能测试工具 gprof 和gprof2dot
- linux环境下 C++性能测试工具 gprof 和gprof2dot
- linux环境下C/C++性能测试工具 gprof 和gprof2dot
- linux环境下 C++性能测试工具 gprof 和gprof2dot
- linux环境下 C++性能测试工具 gprof + kprof + gprof2dot
- linux环境下 C++性能测试工具 gprof 和gprof2dot
- linux环境下 C++性能测试工具 gprof + kprof + gprof2dot
- linux环境下 C++性能测试工具 gprof 和gprof2dot
- linux环境下 C++性能测试工具 gprof + kprof + gprof2dot
- linux环境下 C++ 性能测试工具 gprof 和 gprof2dot
- Linux下C++ 性能测试工具GPROF()入门教程
- Linux下C++性能测试工具valgrind的使用
- Linux环境下apache性能测试工具ab使用详解
- 简谈linux环境下网络性能测试工具iperf
- 在生产环境中使用 php 性能测试工具 xhprof
- 三张图看遍Linux 性能监控、测试、优化工具
- Linux性能测试工具之Lmbench特性、安装及使用