OpenCV矩阵可视化工具包
2013-03-31 16:22
459 查看
在用opencv编程时,经常需要可视化地查看某个矩阵在运算过程中的状态如何,而opencv中的imshow函数只能以灰度显示单通道uchar或float类型的图像,其可视化效果不尽人意,为此,我写了一个矩阵可视化工具包,其中包含了一个类似于matlab中的imagesc的函数,能够以不同的颜色显示矩阵中不同大小的值,这个函数在查看矩阵时非常方便,这里贡大家参考。
VisualizationTool.h
View Code
注意:由于博客园的bug, cpp文件中的kmeans函数会复制不全,复制以后可能会少一个参数,请仔细检查
解释一下文件中的几个函数:
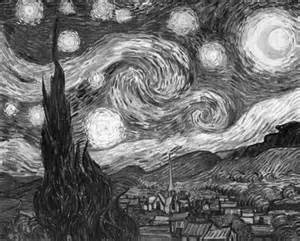
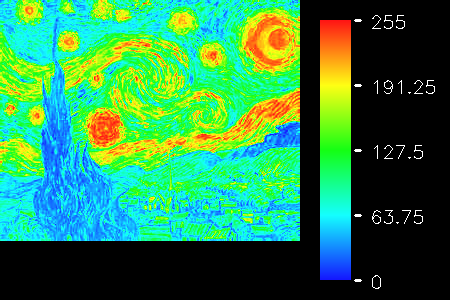
1. void imageSC(std::string windowName, const cv::Mat imgC1)
深度显示单通道uchar,float, int类型图像,类似于matlab的imagesc函数,本函数还自带颜色表和矩阵的值域分布
例:
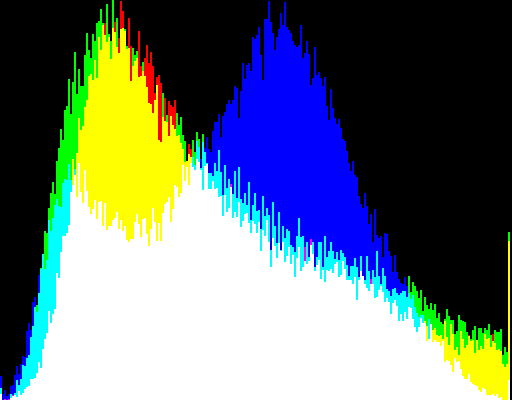
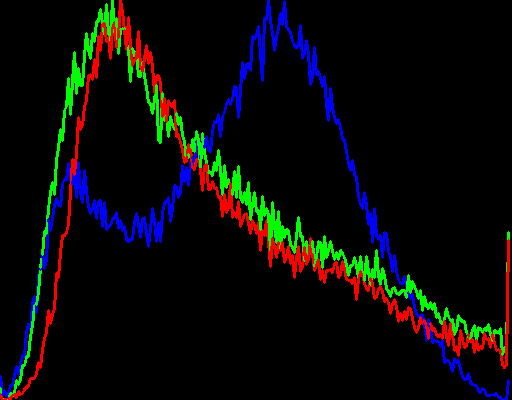
2. void showImageHistogram(const std::string windowName, const cv::Mat src, const cv::Mat mask = cv::Mat(), int histType = HIST_TYPE_MIX, cv::Size windowSize = cv::Size(256, 200));
显示一幅图像的直方图,histType为显示方式,HIST_TYPE_MIX表示三通道混合显示,HIST_TYPE_CONTOUR表示以轮廓显示,窗口的宽度最好是256的倍数。
例:
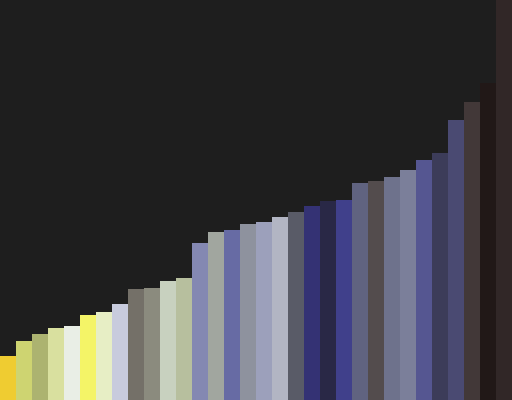
3.void showImageColorDistribution(const std::string windowName, const cv::Mat src_3u, int nBins = 32, const cv::Mat mask = cv::Mat(), cv::Size windowSize = cv::Size(256, 200));
显示一幅图像的颜色分布图,这个函数有点慢,结果也有一定的不确定性,因为用到了k-means,函数的速度取决于nBins的大小,窗口的宽度最好是256的倍数。
例:
4. void ShowArrayHistogram(std::string title, cv::Mat array, cv::Size size = cv::Size(400,400));
以柱状图显示一维数组,array必须为 CV_32F,CV_32S,CV_8U中的一种,且rows == 1,这个函数就不贴图了~
VisualizationTool.h
View Code
#include "stdafx.h"
#include "VisualizationTool.h"

namespace VisualizationTool
{

void imageSC(std::string windowName, const cv::Mat imgC1)
{
assert(imgC1.channels() == 1 && !imgC1.empty());

//get min max value of the mat
double minPixelValue, maxPixelValue;
cv::minMaxIdx(imgC1, &minPixelValue, &maxPixelValue);
double valueRange = maxPixelValue - minPixelValue;

//init color table
const int minSaturation = 20;
const int colorTableLength = (255 - minSaturation) * 4;    // r -> g -> b
cv::Scalar colorTable[colorTableLength];

int i,j;
for (i = 0, j = minSaturation; i < colorTableLength / 4; i++, j++)
colorTable[i] = CV_RGB(255, j, minSaturation);
for (i = colorTableLength / 4, j=1; i < colorTableLength / 2; i++, j++)
colorTable[i] = CV_RGB(255 - j, 255, minSaturation);
for (i = colorTableLength/2, j=minSaturation; i < colorTableLength/4*3; i++, j++)
colorTable[i] = CV_RGB(minSaturation, 255, j);
for (i = colorTableLength/4*3, j=1; i < colorTableLength; i++, j++)
colorTable[i] = CV_RGB(minSaturation, 255 - j, 255);

//draw color table
const int margin = 20;
const int tableHeight = 300;;
const int tableWidth = 150;
const int barWidth = 30;
const int barHeight = tableHeight - margin * 2;
float scale = (float)barHeight / colorTableLength;

int imageHeight = cv::max(imgC1.rows, tableHeight);
int imageWidth = imgC1.cols + tableWidth;
cv::Mat img3u( imageHeight, imageWidth, CV_8UC3, cv::Scalar::all(0));

for (int i=0; i<barHeight; i++)
{
cv::Point pt1(imgC1.cols + margin, margin + i);
cv::Point pt2(imgC1.cols + margin + barWidth, margin + i);
cv::line(img3u, pt1, pt2, colorTable[cvRound(i/scale)], 1);
}

//illustration
for (int i=0; i<5; i++)
{
float value = minPixelValue + i / 4.0 * valueRange;
std::stringstream s;
s<<value;
int bx = imgC1.cols + margin + barWidth;
int by = tableHeight - margin - barHeight / 4 * i ;
cv::line(img3u, cv::Point(bx+5, by), cv::Point(bx+10, by), cvScalarAll(255), 2);
cv::putText(img3u, s.str(), cv::Point(bx + 20, by + 8),
CV_FONT_HERSHEY_SIMPLEX, 0.6, cvScalarAll(255), 1);
}

//show image
cv::Mat tim(imgC1.size(), CV_32F);
imgC1.convertTo(tim, CV_32F);

for (int y = 0; y < imgC1.rows; y++)
{
const float* srcData = tim.ptr<float>(y);
cv::Vec3b* dstData = img3u.ptr<cv::Vec3b>(y);
for (int x = 0; x<imgC1.cols; x++)
{
double pixel = (srcData[x] - minPixelValue) / valueRange;
cv::Scalar color = colorTable[cvRound(pixel * (colorTableLength-1))];
dstData[x] =cv::Vec3b(color.val[2], color.val[1], color.val[0]);
}
}
cv::imshow(windowName, img3u);
}

void ShowArrayHistogram(std::string title, cv::Mat hist, cv::Size size)
{
CV_Assert(hist.rows == 1);
cv::Mat imHist = cv::Mat::zeros(size, CV_8UC3);
int nBins = hist.rows*hist.cols;
double min, max;
cv::minMaxLoc(hist, &min, &max);
double bin_width=(double)size.width/nBins;
double bin_unith=(double)size.height/max;

if(hist.type() == CV_32F)
{
float * ptr = hist.ptr<float>(0);
for(int i=0;i<nBins;i++)
{
cv::Point p0=cv::Point(i*bin_width,size.height);
cv::Point p1=cv::Point((i+1)*bin_width,size.height-ptr[i]*bin_unith);
cv::rectangle(imHist, p0, p1, cv::Scalar::all(255), -1, 0, 0);
}
}
if(hist.type() == CV_32S)
{
int* ptr = hist.ptr<int>(0);
for(int i=0;i<nBins;i++)
{
cv::Point p0=cv::Point(i*bin_width,size.height);
cv::Point p1=cv::Point((i+1)*bin_width,size.height-ptr[i]*bin_unith);
cv::rectangle(imHist, p0, p1, cv::Scalar::all(255), -1, 0, 0);
}
}
if(hist.type() == CV_8U)
{
uchar* ptr = hist.ptr<uchar>(0);
for(int i=0;i<nBins;i++)
{
cv::Point p0=cv::Point(i*bin_width,size.height);
cv::Point p1=cv::Point((i+1)*bin_width,size.height-ptr[i]*bin_unith);
cv::rectangle(imHist, p0, p1, cv::Scalar::all(255), -1, 0, 0);
}
}

cv::namedWindow(title);
cv::imshow(title, imHist);
}

void showImageHistogram(const std::string windowName, const cv::Mat src,  const cv::Mat mask, int histType, cv::Size windowSize)
{
CV_Assert(!src.empty());
if (!mask.empty())
{
CV_Assert(mask.type() == CV_8U && src.size() == mask.size());
}

cv::Mat src_3u;
if(src.channels()==1)
cv::cvtColor(src, src_3u, CV_GRAY2RGB);
else
src_3u = src;

//shrink the src to save time
float th_maxSide = 300.0;
int maxSide = cv::max(src_3u.cols , src_3u.rows);
cv::Mat zoom_3u, zoomMask_1u;

if (maxSide > th_maxSide)
{
float scale = maxSide / th_maxSide;
zoom_3u.create(src_3u.rows / scale, src_3u.cols / scale, CV_8UC3);
cv::resize(src_3u, zoom_3u, zoom_3u.size(), 0, 0, cv::INTER_LANCZOS4 );

if(!mask.empty())
{
zoomMask_1u.create(mask.rows / scale, mask.cols / scale, CV_8U);
cv::resize(mask, zoomMask_1u, zoomMask_1u.size(), 0, 0, cv::INTER_LANCZOS4 );
}
}
else
{
zoom_3u = src_3u;
if(!mask.empty())
zoomMask_1u = mask;
}

std::vector<cv::Mat> rgb_planes;
cv::split(zoom_3u, rgb_planes );

int nBins = 255;

/// 设定取值范围 ( R,G,B) )
float range[] = { 0, 256 } ;
const float* histRange = { range };

bool uniform = true; bool accumulate = false;

cv::Mat r_hist, g_hist, b_hist;

/// 计算直方图:
cv::calcHist( &rgb_planes[0], 1, 0, zoomMask_1u, r_hist, 1, &nBins, &histRange, uniform, accumulate );
cv::calcHist( &rgb_planes[1], 1, 0, zoomMask_1u, g_hist, 1, &nBins, &histRange, uniform, accumulate );
cv::calcHist( &rgb_planes[2], 1, 0, zoomMask_1u, b_hist, 1, &nBins, &histRange, uniform, accumulate );

// 创建直方图画布
int canvasWidth = windowSize.width;
int canvasHeight = windowSize.height;
int binWidth = cvRound( (double) canvasWidth / nBins );

cv::Mat histImage(canvasHeight, canvasWidth,  CV_8UC3, cv::Scalar( 0,0,0) );

/// 将直方图归一化到范围 [ 0, histImage.rows ]
cv::normalize(r_hist, r_hist, 0, histImage.rows, cv::NORM_MINMAX, -1, cv::Mat() );
cv::normalize(g_hist, g_hist, 0, histImage.rows, cv::NORM_MINMAX, -1, cv::Mat() );
cv::normalize(b_hist, b_hist, 0, histImage.rows, cv::NORM_MINMAX, -1, cv::Mat() );

/// 在直方图画布上画出直方图
if (histType == HIST_TYPE_CONTOUR)
{
for( int i = 1; i < nBins; i++ )
{
cv::line( histImage, cv::Point( binWidth*(i-1), canvasHeight - cvRound(r_hist.at<float>(i-1)) ) ,
cv::Point( binWidth*(i), canvasHeight - cvRound(r_hist.at<float>(i)) ),
cv::Scalar(255, 0, 0), 2, 8, 0  );
cv::line( histImage, cv::Point( binWidth*(i-1), canvasHeight - cvRound(g_hist.at<float>(i-1)) ) ,
cv::Point( binWidth*(i), canvasHeight - cvRound(g_hist.at<float>(i)) ),
cv::Scalar( 0, 255, 0), 2, 8, 0  );
cv::line( histImage, cv::Point( binWidth*(i-1), canvasHeight - cvRound(b_hist.at<float>(i-1)) ) ,
cv::Point( binWidth*(i), canvasHeight - cvRound(b_hist.at<float>(i)) ),
cv::Scalar( 0, 0, 255), 2, 8, 0  );
}
}
else if (histType == HIST_TYPE_MIX)
{
for (int iBin=0; iBin<nBins; iBin++)
{
for (int iValue=1; iValue < r_hist.at<float>(iBin); iValue++)
{
for (int j=0; j<binWidth; j++)
{
cv::Vec3b& pixel = histImage.at<cv::Vec3b>(canvasHeight - iValue, iBin * binWidth + j);
pixel.val[0] = 255;
}
}
for (int iValue=1; iValue < g_hist.at<float>(iBin); iValue++)
{
for (int j=0; j<binWidth; j++)
{
cv::Vec3b& pixel = histImage.at<cv::Vec3b>(canvasHeight - iValue, iBin * binWidth + j);
pixel.val[1] = 255;
}
}
for (int iValue=1; iValue < b_hist.at<float>(iBin); iValue++)
{
for (int j=0; j<binWidth; j++)
{
cv::Vec3b& pixel = histImage.at<cv::Vec3b>(canvasHeight - iValue, iBin * binWidth + j);
pixel.val[2] = 255;
}
}
}
}
cv::imshow(windowName, histImage );
}

bool histCompare(std::pair<cv::Scalar,int> v1, std::pair<cv::Scalar,int> v2)
{
return v1.second < v2.second;
}

int countValueAppearTimes(const cv::Mat srcC1, double value)
{
CV_Assert(!srcC1.empty() && srcC1.channels()==1);

cv::Mat r = srcC1 - value;
int times = cv::countNonZero(r);
return srcC1.cols * srcC1.rows - times;
}

void showImageColorDistribution(const std::string windowName, const cv::Mat src_3u, int nBins,
const cv::Mat mask, cv::Size windowSize)
{
CV_Assert(!src_3u.empty() );
if (!mask.empty())
{
CV_Assert(mask.type() == CV_8U && src_3u.size() == mask.size());
}

//shrink the src to save time
float th_maxSide = 300.0;
int maxSide = cv::max(src_3u.cols , src_3u.rows);
cv::Mat zoom_3u, zoomMask_1u;

if (maxSide > th_maxSide)
{
float scale = maxSide / th_maxSide;
zoom_3u.create(src_3u.rows / scale, src_3u.cols / scale, CV_8UC3);
cv::resize(src_3u, zoom_3u, zoom_3u.size(), 0, 0, cv::INTER_LANCZOS4 );

if(!mask.empty())
{
zoomMask_1u.create(mask.rows / scale, mask.cols / scale, CV_8U);
cv::resize(mask, zoomMask_1u, zoomMask_1u.size(), 0, 0, cv::INTER_LANCZOS4 );
}
}
else
{
zoom_3u = src_3u;
if(!mask.empty())
zoomMask_1u = mask;
}
int maskNonZero = countNonZero(zoomMask_1u);

//k-means cluster
cv::Mat clusterMat;
cv::Mat bestLabels, centers;
cv::Vec3b* data = zoom_3u.ptr<cv::Vec3b>(0);
if(mask.empty())
{
clusterMat.create(zoom_3u.cols * zoom_3u.rows, 3, CV_32F);
for (int i=0; i<zoom_3u.cols * zoom_3u.rows; i++)
{
cv::Vec3b pixel = data[i];
clusterMat.at<float>(i, 0) = pixel.val[0];
clusterMat.at<float>(i, 1) = pixel.val[1];
clusterMat.at<float>(i, 2) = pixel.val[2];
}
}
else
{
clusterMat.create(maskNonZero, 3, CV_32F);
const uchar* maskData = zoomMask_1u.ptr<uchar>(0);
for (int i=0, j=0; i<zoomMask_1u.cols * zoomMask_1u.rows; i++)
{
if(maskData[i] > 0)
{
cv::Vec3b pixel = data[i];
clusterMat.at<float>(j, 0) = pixel.val[0];
clusterMat.at<float>(j, 1) = pixel.val[1];
clusterMat.at<float>(j, 2) = pixel.val[2];
j++;
}
}
}

cv::kmeans(clusterMat, nBins, bestLabels, cv::TermCriteria( CV_TERMCRIT_EPS+CV_TERMCRIT_ITER, 10, 1.0),
3, cv::KMEANS_PP_CENTERS, centers);

//statistics
std::vector<std::pair<cv::Scalar,int>> hist(nBins);
for (int i=0; i<nBins; i++)
{
cv::Scalar color( centers.at<float>(i,0), centers.at<float>(i,1), centers.at<float>(i,2));
int val = countValueAppearTimes(bestLabels, i);
hist.at(i) = std::pair<cv::Scalar,int>(color, val);
}
std::sort(hist.begin(), hist.end(), histCompare);
int maxValue = hist[nBins-1].second;

//canvas
float scale = (float)windowSize.height / maxValue;
int binWidth = windowSize.width / nBins;
cv::Mat canvas(windowSize, CV_8UC3, cv::Scalar::all(30));

for (int i=0; i<nBins; i++)
{
cv::Point pt1(  i    * binWidth, canvas.rows - 1);
cv::Point pt2( (i+1) * binWidth, canvas.rows - 1 - hist[i].second * scale);
cv::rectangle(canvas, pt1, pt2, hist[i].first, -1);
}
cv::imshow(windowName, canvas);
}

}
注意:由于博客园的bug, cpp文件中的kmeans函数会复制不全,复制以后可能会少一个参数,请仔细检查
解释一下文件中的几个函数:
1. void imageSC(std::string windowName, const cv::Mat imgC1)
深度显示单通道uchar,float, int类型图像,类似于matlab的imagesc函数,本函数还自带颜色表和矩阵的值域分布
例:
2. void showImageHistogram(const std::string windowName, const cv::Mat src, const cv::Mat mask = cv::Mat(), int histType = HIST_TYPE_MIX, cv::Size windowSize = cv::Size(256, 200));
显示一幅图像的直方图,histType为显示方式,HIST_TYPE_MIX表示三通道混合显示,HIST_TYPE_CONTOUR表示以轮廓显示,窗口的宽度最好是256的倍数。
例:
3.void showImageColorDistribution(const std::string windowName, const cv::Mat src_3u, int nBins = 32, const cv::Mat mask = cv::Mat(), cv::Size windowSize = cv::Size(256, 200));
显示一幅图像的颜色分布图,这个函数有点慢,结果也有一定的不确定性,因为用到了k-means,函数的速度取决于nBins的大小,窗口的宽度最好是256的倍数。
例:
4. void ShowArrayHistogram(std::string title, cv::Mat array, cv::Size size = cv::Size(400,400));
以柱状图显示一维数组,array必须为 CV_32F,CV_32S,CV_8U中的一种,且rows == 1,这个函数就不贴图了~

相关文章推荐
- OpenCV中对数组(矩阵)的操作的函数表
- opencv数据持久化 灰化图像矩阵存储
- OpenCv中矩阵的创建
- OpenCV 编程简介(矩阵/图像/视频的基本读写操作)
- zz:基于 OpenCV 的矩阵运算 (CvMat)
- OpenCV中矩阵类型的个人理解
- 用opencv计算棋盘格内角点坐标(通过4个内角点获得转换矩阵),并同时用halcon和opnecv对图像进行透视变换
- 【OpenCV学习】矩阵运算和操作2
- opencv:矩阵和图像操作
- opencv矩阵元素数据类型
- opencv打印二通道或三通道矩阵
- opencv CvMat矩阵学习
- OpenCV 编程简介(矩阵/图像/视频的基本读写操作)
- OpenCV: 矩阵等对象的文件存取方式
- unity 工具包代码 矩阵分解位置、旋转
- Opencv矩阵操作函数大全---分类整理
- opencv 创建一个矩阵
- OpenCV矩阵运算
- opencv 矩阵与一个常数相乘的 两种实现方法
- opencv常用图像(矩阵)操作函数