用gnuplot+web语言制作自己的系统监控平台
2013-03-09 17:26
295 查看
现在有很多著名的监控程序,比如Cacti,Nagios,Ntop,Smoking等,绘图是监控程序中最重要的组成部分,通过图像可以更加直观的反映出系统的网络流量,硬件负载等,从而减小了运维的工作量,其中rrdtool就是一款主流的绘图工具,Cacti就是用rrdtool来绘图的,之前我也有单独用rrdtool绘制过Oracle的性能图(PS:可以查阅我以前的博文),此外Gnuplot也是我个人比较喜欢用的一款绘图工具,用它可以灵活的绘制出各种监控图,用于自己编写的系统监控平台。以下我把自己在生产中的使用的监控平台简化后与大家分享。
首先用sar命令,sar是一个很强大的系统监控命令,这里我用它里获取系统的性能数据。
-u参数是报告CPU的使用情况,1指的是每秒报告一次,10指的是十次
可以做一个增加系统CPU负载的测试,执行命令 cat /dev/zero > /dev/null, 监控页面是每秒钟刷新一次,稍等一会就会自动刷新出下图
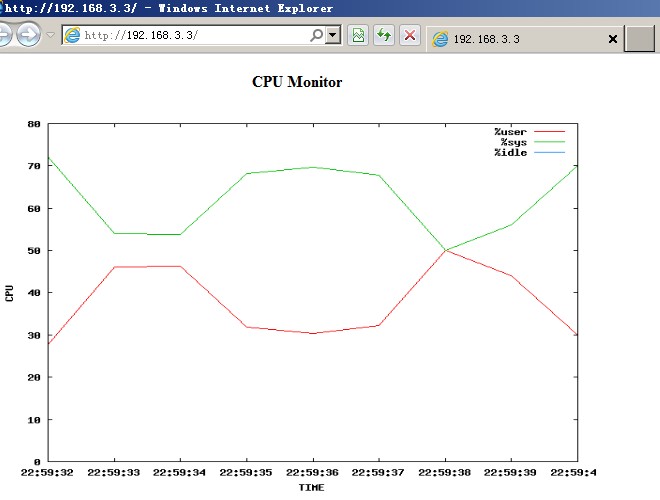
如图所示,可以很明显的发现表示CPU idle值的蓝线已经消失,说明在这个时间段内系统的CPU负载很高。
以上只是一个简单的自制监控系统,在实际生产中可以通过php,mysql,shell脚本配合编写具有查询、分析、导出等功能更加强大的监控平台。欢迎大家给我留言交流!谢谢!
本文出自 “老徐的私房菜” 博客,谢绝转载!
首先用sar命令,sar是一个很强大的系统监控命令,这里我用它里获取系统的性能数据。
-u参数是报告CPU的使用情况,1指的是每秒报告一次,10指的是十次
[root@oracle ~]# sar -u 1 10

Linux 2.6.18-194.el5 (oracle.example.com)       03/09/13

22:18:16          CPU     %user     %nice   %system   %iowait    %steal     %idle

22:18:17          all     30.35      0.00     41.29      0.00      0.00     28.36

22:18:18          all     30.26      0.00     39.49      0.00      0.00     30.26

22:18:19          all     31.50      0.00     38.50      0.00      0.00     30.00

22:18:20          all     41.50      0.00     38.50      0.00      0.00     20.00

22:18:21          all     33.50      0.00     39.50      0.00      0.00     27.00

22:18:22          all     30.00      0.00     39.50      0.00      0.00     30.50

22:18:23          all     41.71      0.00     38.19      0.00      0.00     20.10

22:18:24          all     37.00      0.00     39.50      0.00      0.00     23.50

22:18:25          all     32.16      0.00     38.19      0.00      0.00     29.65

22:18:26          all     33.67      0.00     39.70      0.00      0.00     26.63

Average:          all     34.17      0.00     39.24      0.00      0.00     26.59
由上面的输出可以看到,数据中有无用的数据行,可以将数据稍加筛选后重定向到monitor.data文件中
[root@oracle html]# sar -u 1 10 | head -n -2 | tail -11 | grep . > /var/www/html/monitor.data

[root@oracle html]# cat monitor.data

22:29:39          CPU     %user     %nice   %system   %iowait    %steal     %idle

22:29:40          all     36.70      0.00     40.07      0.00      0.00     23.22

22:29:42          all     44.65      0.00     41.86      0.00      0.00     13.49

22:29:43          all     33.50      0.00     39.50      0.00      0.00     27.00

22:29:44          all     31.66      0.00     40.20      0.00      0.00     28.14

22:29:45          all     31.98      0.00     39.09      0.00      0.00     28.93

22:29:46          all     31.16      0.00     38.69      0.00      0.00     30.15

22:29:47          all     42.57      0.00     38.61      0.00      0.00     18.81

22:29:48          all     33.85      0.00     40.51      0.00      0.00     25.64

22:29:49          all     31.66      0.00     38.19      0.00      0.00     30.15
当把数据完整的整理到monitor.data文件后,就开始编写Gnuplot的配置文件monitor.conf
[root@oracle html]# vim monitor.conf

set term png

set xdata time

set style data lines

set output 'cpu.png'

set timefmt '%H:%M:%S'

set format x '%H:%M:%S'

set xlabel 'TIME'

set ylabel 'CPU'

plot 'monitor.data' using 1:3 title "%user", 'monitor.data' using 1:5 title "%sys", 'monitor.data' using 1:8 title "%idle"
最后可以写个Shell脚本文件,把生成数据和图片的两步结合在一起,这里我就写一行吧
[root@oracle html]# vim monitor.sh

#!/bin/sh

sar -u 1 10 | head -n -2 | tail -11 | grep . > /var/www/html/monitor.data && gnuplot  /var/www/html/monitor.conf [root@oracle html]# chmod +x monitor.sh
最后通过计划任务让操作系统每分钟执行一次脚本monitor.sh
[root@oracle html]# crontab -e

*/1 * * * *  /var/www/html/monitor.sh
写一个简单的html页面测试,其中可以用javascript来实现页面自动刷新功能
<html>

<body>

<tablewidth="600"border="0"cellpadding="3"cellspacing="0">

<tr>

<td><strong><center>CPU Monitor</center></strong></td>

</tr>

</table>

<br>

<p><imgsrc="cpu.png"width="600"height="380"></p>

</body>

<scriptlanguage="JavaScript">

function refresh(){

window.location.reload();

}

setTimeout('refresh()',1000);

</script>
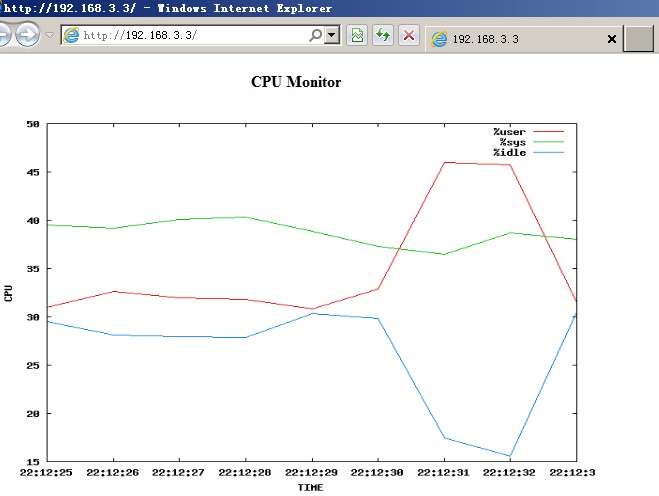
</html>访问监控页面http://192.168.3.3可以看到,这是把过去10秒钟系统CPU使用情况的数据绘制成了监控图可以做一个增加系统CPU负载的测试,执行命令 cat /dev/zero > /dev/null, 监控页面是每秒钟刷新一次,稍等一会就会自动刷新出下图
如图所示,可以很明显的发现表示CPU idle值的蓝线已经消失,说明在这个时间段内系统的CPU负载很高。
以上只是一个简单的自制监控系统,在实际生产中可以通过php,mysql,shell脚本配合编写具有查询、分析、导出等功能更加强大的监控平台。欢迎大家给我留言交流!谢谢!
本文出自 “老徐的私房菜” 博客,谢绝转载!

相关文章推荐
- Arduino入门:制作你自己的环境监控系统
- 监控系统之zabbix监控平台
- 基于LAMP平台的网站架构(或Web系统架构)
- Docker 制作自己的WEB镜像,并运行项目
- Java是绑定于一种语言的跨系统的平台
- 评 真正的程序员,不会在意自己用的是什么语言或者什么平台,因为这些是由成本和客户决定的。”
- 基于树莓派(Raspberry Pi)平台的MQ-2烟雾报警系统以及结合Zabbix监控的实现(一)
- 在.NET 3.5 平台上使用LINQ to SQL创建三层/多层Web应用系统 (Part 1)
- [导入]在.NET 3.5 平台上使用LINQ to SQL创建三层/多层Web应用系统 (Part 5)
- 如何系统维护好网站 ?这款错误监控平台不可缺少
- 教你用软件制作自己的系统主题包
- 在.NET 3.5 平台上使用LINQ to SQL创建三层/多层Web应用系统(Part5) 转
- 搭建自己的小型监控系统——开始使用
- 教你自己制作Vista与DOS双系统
- 天兔(Lepus)监控系统慢查询分析平台安装配置
- WEB应用 信息管理系统 数据分析展示系统 OA办公工作流 快速构建与开发平台
- 支持全平台的服务器监控报警系统 Shinken
- 服务器监控系统Zabbix的自定义key、discovery、web监控图解教程(第四章)
- OAF学习笔记-20-在系统页面制作Tab页(系统中有Tab页,自己增加Tab)
- 搭建一个简单的基于web的网络流量监控可视化系统