Identify Java code consuming high CPU in Linux
2012-11-28 13:52
204 查看
Identify Java code consuming high CPU in Linux (linking JVM thread and Linux PID)
February 9, 2011 |By rameshj@zohocorp.com
| In
Applications Manager
We can easily identify a problematic java code which leads to high CPU utilization in Linux. Let me explain the steps with the following example,
package test;
public class ThreadDumpTest {
public void test(){
for (int i = 0; i < 10 ; i++) {
Thread th=new Thread(new TR(i));
th.setName(“MyThread-”+(1000+i));
th.start();
}
}
public static void main(String[] args) {
ThreadDumpTest t=new ThreadDumpTest();
t.test();
}
private class TR implements Runnable{
int ins=0;
TR(int i){
ins=i;
}
public void run(){
while (true) {
if(ins!=5) {
try {
Thread.sleep(10000);
} catch (Exception e) {
e.printStackTrace();
}
}
}
}
}
}
In the above example, all the threads are in while loop. Except ‘MyThread-1005‘ thread, all other threads will sleep 10 secs inside the loop. The ‘MyThread-1005‘
thread will not enter sleep part, so it will run in while loop without sleep. Due to while loop, the ‘MyThread-1005‘ thread will leads to high CPU utilization.
How to identify ?
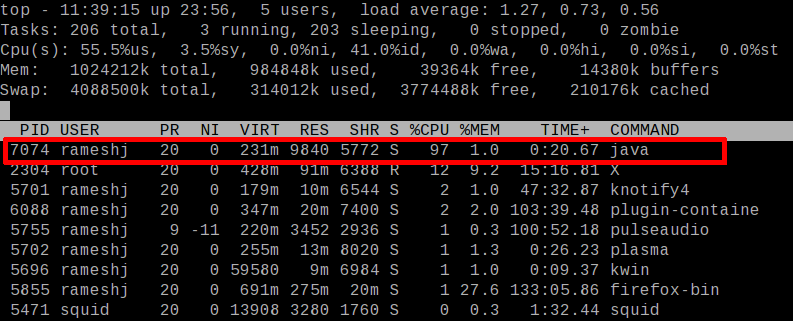
Step 1 :
Execute ‘top‘ command on the console. You can see the ‘java’ command with PID 7074 utilized
97% of CPU.
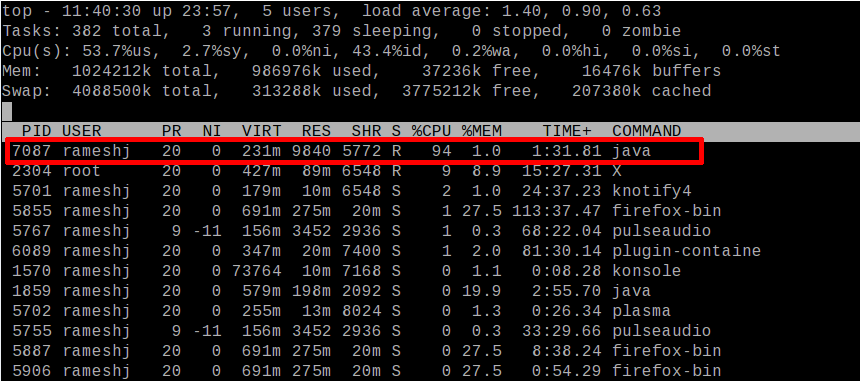
Step 2 :
The top command displays the process list like the above image. Press ‘Shift + h‘ and wait few secs. You can see ‘Show threads on‘ message in the top console.
Now, you can see thread level details like CPU/Memory utilization. You can see a ‘java’ command thread with PID 7087 utilized
94% of CPU.
Step 3:
The identified problematic thread PID ( 7087 ) is in decimal format.
Convert it into hexadecimal format. The respective hexadecimal for 7087 is 1BAF. And convert it into lowercase (1baf ).
Step 4:
Take thread dump and search the converted hexadecimal PID ( 1baf ) in the thread dump. You can find the hex PID as ‘nid‘ (with ’0x’) of the thread trace. From the trace,
you can find ‘MyThread-1005‘ is the problematic thread in the test program. And using the thread trace you can identify the problematic code and fix the problem.
[rameshj@rameshj thread]$ java test/ThreadDumpTest
^\Full thread dump Java HotSpot(TM) Client VM (1.5.0_06-b05 mixed mode):
“DestroyJavaVM” prio=1 tid=0x083d2d78 nid=0x1ba2 waiting on condition [0x00000000..0xbff4bf60]
“MyThread-1009″ prio=1 tid=0x08510a88 nid=0x1bb3 waiting on condition [0xa9cca000..0xa9ccb020]
at java.lang.Thread.sleep(Native Method)
at test.ThreadDumpTest$TR.run(ThreadDumpTest.java:45) &nbs
p;
at java.lang.Thread.run(Thread.java:595)
“MyThread-1008″ prio=1 tid=0×08510318 nid=0x1bb2 waiting on condition [0xa9d4b000..0xa9d4bea0]
at java.lang.Thread.sleep(Native Method)
at test.ThreadDumpTest$TR.run(ThreadDumpTest.java:45)
at java.lang.Thread.run(Thread.java:595)
“MyThread-1007″ prio=1 tid=0x0850f298 nid=0x1bb1 waiting on condition [0xa9dcc000..0xa9dccf20]
at java.lang.Thread.sleep(Native Method)
at test.ThreadDumpTest$TR.run(ThreadDumpTest.java:45)
at java.lang.Thread.run(Thread.java:595)
“MyThread-1006″ prio=1 tid=0x0850d818 nid=0x1bb0 waiting on condition [0xa9e4d000..0xa9e4dda0]
at java.lang.Thread.sleep(Native Method)
at test.ThreadDumpTest$TR.run(ThreadDumpTest.java:45)
at java.lang.Thread.run(Thread.java:595)
“MyThread-1005” prio=1 tid=0x0850c9f8 nid=0x1baf runnable [0xa9ece000..0xa9ecee20]
at test.ThreadDumpTest$TR.run(ThreadDumpTest.java:43)
at java.lang.Thread.run(Thread.java:595)
“MyThread-1004″ prio=1 tid=0x0850b8e8 nid=0x1bae waiting on condition [0xa9f4f000..0xa9f500a0]
at java.lang.Thread.sleep(Native Method)
at test.ThreadDumpTest$TR.run(ThreadDumpTest.java:45)
at java.lang.Thread.run(Thread.java:595)
“MyThread-1003″ prio=1 tid=0x0850aac8 nid=0x1bad waiting on condition [0xa9fd0000..0xa9fd1120]
at java.lang.Thread.sleep(Native Method)
at test.ThreadDumpTest$TR.run(ThreadDumpTest.java:45)
at java.lang.Thread.run(Thread.java:595)
“MyThread-1002″ prio=1 tid=0x085099b8 nid=0x1bac waiting on condition [0xaa051000..0xaa051fa0]
at java.lang.Thread.sleep(Native Method)
at test.ThreadDumpTest$TR.run(ThreadDumpTest.java:45)
at java.lang.Thread.run(Thread.java:595)
“MyThread-1001″ prio=1 tid=0x08508a28 nid=0x1bab waiting
on condition [0xaa0d2000..0xaa0d3020]
at java.lang.Thread.sleep(Native Method)
at test.ThreadDumpTest$TR.run(ThreadDumpTest.java:45)
at java.lang.Thread.run(Thread.java:595)
“MyThread-1000″ prio=1 tid=0×08508520 nid=0x1baa waiting on condition [0xaa153000..0xaa153ea0]
at java.lang.Thread.sleep(Native Method)
at test.ThreadDumpTest$TR.run(ThreadDumpTest.java:45)
at java.lang.Thread.run(Thread.java:595)
“Low Memory Detector” daemon prio=1 tid=0x0843cf58 nid=0x1ba8 runnable [0x00000000..0x00000000]
“CompilerThread0″ daemon prio=1 tid=0x0843b930 nid=0x1ba7 waiting on condition [0x00000000..0xaa3eb808]
“Signal Dispatcher” daemon prio=1 tid=0x0843a9d0 nid=0x1ba6 waiting on condition [0x00000000..0x00000000]
“Finalizer” daemon prio=1 tid=0×08430740 nid=0x1ba5 in Object.wait() [0xaa52c000..0xaa52d120]
at java.lang.Object.wait(Native Method)
– waiting on <0xaa6b0848> (a java.lang.ref.ReferenceQueue$Lock)
at java.lang.ref.ReferenceQueue.remove(ReferenceQueue.java:116)
– locked <0xaa6b0848> (a java.lang.ref.ReferenceQueue$Lock)
at java.lang.ref.ReferenceQueue.remove(ReferenceQueue.java:132)
at java.lang.ref.Finalizer$FinalizerThread.run(Finalizer.java:159)
“Reference Handler” daemon prio=1 tid=0x0842e898 nid=0x1ba4 in Object.wait() [0xaa5ad000..0xaa5adfa0]
at java.lang.Object.wait(Native Method)
– waiting on <0xaa6b0758> (a java.lang.ref.Reference$Lock)
at java.lang.Object.wait(Object.java:474)
at java.lang.ref.Reference$ReferenceHandler.run(Reference.java:116)
– locked <0xaa6b0758> (a java.lang.ref.Reference$Lock)
“VM Thread” prio=1 tid=0x0842bb68 nid=0x1ba3 runnable
“VM Periodic Task Thread” prio=1 tid=0x0843e538 nid=0x1ba9 waiting on condition
Update : FYI : You can automatically take a thread dump of a Java application when a high CPU threshold is violated by using Applications
Manager. Learn more or
watch a related video or
download Applications Manager now.
- Ramesh
From:http://blogs.manageengine.com/appmanager/2011/02/09/identify-java-code-consuming-high-cpu-in-linux-linking-jvm-thread-and-linux-pid/

相关文章推荐
- Identify Java code consuming high CPU in Linux
- CPU frequency and voltage scaling code in the Linux(TM) kernel
- CPU frequency and voltage scaling code in the Linux(TM) kernel
- CPU frequency and voltage scaling code in the Linux(TM) kernel
- .net垃圾回收学习【NET Best Practice No: 1:- Detecting High Memory consuming functions in .NET code】【翻译&&学习】
- Leet Code 24 Swap Nodes in Pairs - 成对交换节点 - Java
- Units Problem: How to read text size as custom attr from xml and set it to TextView in java code
- Linux系统监控命令个人总结之jstack查找高度占用CPU的java代码
- Linux上运行maven项目报错Fatal Error: Unable to find package java.lang in classpath or bootclasspath
- Linux下使用java获取cpu、内存使用率
- Debugging Maya Plugin(C++) with CodeBlocks in Linux
- Common code violations in Java
- hadoop2.4 WARN util.NativeCodeLoader: Unable to load native-hadoop library for your platform... using builtin-java classes where applicable
- Config The Java Environment In Linux
- Linux下high CPU分析心得【非原创】
- Trace every instruction in java bytecode using BCEL
- Java Development Environment in Linux: Install and Configure Oracle
- java.lang.UnsatisfiedLinkError: no jniopencv_highgui in java.library.path
- Java 连接远程Linux 服务器执行 shell 脚本查看 CPU、内存、硬盘信息
- linux环境下weblogic 部署程序出现java.util,zip.ZpException:error in opening zip file