Can You Top This? 15 Practical Linux Top Command Examples
2012-05-03 13:12
786 查看
摘自:http://www.thegeekstuff.com/2010/01/15-practical-unix-linux-top-command-examples/
by Ramesh Natarajan on
January 4, 2010
This article is part of the on-going 15 example series where 15 examples will be provided for a specific command or functionality. In this series, earlier we discussed aboutfind
command,
crontab examples,
grep command,
history command,
ping command, and
wget examples.
In this article, let us review 15 examples for Linux top command that will be helpful for both newbies and experts.
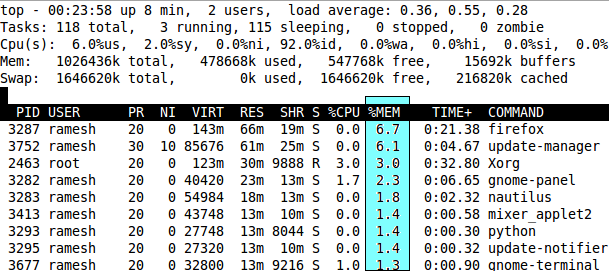
Fig: Press M to sort by memory usage – Unix top command
To sort top output by any column, Press O (upper-case O) , which will display all the possible columns that you can sort by as shown below.
When the linux top command is running, Press R, which does thesort in reverse order.
While unix top command is running, press u which will ask for username as shown below.
Press 1 (one), when the top command is running, which will break the CPU down and show details for all the individual CPUs running on the system as shown below.
To change the output update frequency, press d in interactive mode, and enter the time in seconds as shown below.
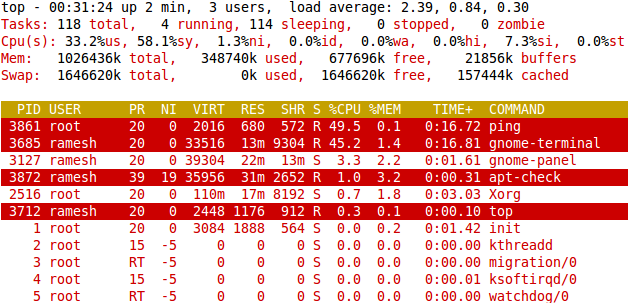
Fig: Ubuntu Linux – top command highlights running process
The following example will show 2 iterations of unix top command output and exit automatically
Note: This option is very helpful when you want to
capture the unix top command output to a readable text file as we discussed earlier.
Press h while top command is running, which will display help for interactive top commands.
Following is the default header information provided by top.
Press l – to hide / show the load average. 1st header line.
Press t – to hide / show the CPU states. 2nd and 3rd header line.
Press m – to hide / show the memory information. 4th and 5th line.
configuration options will be used automatically.
To save the top configuration, press W, which will write the configuration files to ~/.toprc. This will display the write confirmation message as shown below.
补充:
-b 选项可以令top以batch模式/文本模式 输出;
-n number 输出次数
-c 输出完整命令路径
by Ramesh Natarajan on
January 4, 2010
This article is part of the on-going 15 example series where 15 examples will be provided for a specific command or functionality. In this series, earlier we discussed aboutfind
command,
crontab examples,
grep command,
history command,
ping command, and
wget examples.
In this article, let us review 15 examples for Linux top command that will be helpful for both newbies and experts.
1. Show Processes Sorted by any Top Output Column – Press O
By default top command displays the processes in the order of CPU usage. When the top command is running, press M (upper-case) to display processes sorted by memory usage as shown below.Fig: Press M to sort by memory usage – Unix top command
To sort top output by any column, Press O (upper-case O) , which will display all the possible columns that you can sort by as shown below.
Current Sort Field:  P  for window 1:Def
Select sort field via field letter, type any other key to return

a: PID        = Process Id              v: nDRT       = Dirty Pages count
d: UID        = User Id                 y: WCHAN      = Sleeping in Function
e: USER       = User Name               z: Flags      = Task Flags
........
When the linux top command is running, Press R, which does thesort in reverse order.
2. Kill a Task Without Exiting From Top – Press k
Once you’ve located a process that needs to be killed, press ‘k’ which will ask for the process id, and signal to send. If you have the privilege to kill that particular PID, it will get killed successfully.PID to kill: 1309 Kill PID 1309 with signal [15]: PID USER PR NI VIRT RES SHR S %CPU %MEM TIME+ COMMAND 1309 geek 23 0 2483m 1.7g 27m S 0 21.8 45:31.32 gagent 1882 geek 25 0 2485m 1.7g 26m S 0 21.7 22:38.97 gagent 5136 root 16 0 38040 14m 9836 S 0 0.2 0:00.39 nautilus
3. Renice a Unix Process Without Exiting From Top – Press r
Press r, if you want to just change the priority of the process (and not kill the process). This will ask PID for renice, enter the PID and priority.PID to renice: 1309 Renice PID 1309 to value: PID USER PR NI VIRT RES SHR S %CPU %MEM TIME+ COMMAND 1309 geek 23 0 2483m 1.7g 27m S 0 21.8 45:31.32 gagent 1882 geek 25 0 2485m 1.7g 26m S 0 21.7 22:38.97 gagent
4. Display Selected User in Top Output Using top -u
Use top -u to display a specific user processes only in the top command output.$ top -u geek
While unix top command is running, press u which will ask for username as shown below.
Which user (blank for all): geek
PID USER      PR  NI  VIRT  RES  SHR S %CPU %MEM    TIME+  COMMAND
1309 geek   23   0 2483m 1.7g  27m S    0 21.8  45:31.32 gagent
1882 geek   25   0 2485m 1.7g  26m S    0 21.7  22:38.97 gagent
Display Only Specific Process with Given PIDs Using top -p
Use top -p as shown below to display specific PIDs.$ top -p 1309, 1882 PID USER PR NI VIRT RES SHR S %CPU %MEM TIME+ COMMAND 1309 geek 23 0 2483m 1.7g 27m S 0 21.8 45:31.32 gagent 1882 geek 25 0 2485m 1.7g 26m S 0 21.7 22:38.97 gagent
5. Display All CPUs / Cores in the Top Output – Press 1 (one)
Top output by default shows CPU line for all the CPUs combined together as shown below.top - 20:10:39 up 40 days, 23:02, 1 user, load average: 4.97, 2.01, 1.25 Tasks: 310 total, 1 running, 309 sleeping, 0 stopped, 0 zombie Cpu(s): 0.5%us, 0.7%sy, 0.0%ni, 92.3%id, 6.4%wa, 0.0%hi, 0.0%si, 0.0%st
Press 1 (one), when the top command is running, which will break the CPU down and show details for all the individual CPUs running on the system as shown below.
top - 20:10:07 up 40 days, 23:03,  1 user,  load average: 5.32, 2.38, 1.39
Tasks: 341 total,   3 running, 337 sleeping,   0 stopped,   1 zombie
Cpu0  :  7.7%us,  1.7%sy,  0.0%ni, 79.5%id, 11.1%wa,  0.0%hi,  0.0%si,  0.0%st
Cpu1  :  0.3%us,  0.0%sy,  0.0%ni, 94.9%id,  4.7%wa,  0.0%hi,  0.0%si,  0.0%st
Cpu2 :  3.3%us,  0.7%sy,  0.0%ni, 55.7%id, 40.3%wa,  0.0%hi,  0.0%si,  0.0%st
Cpu3 :  5.0%us,  1.0%sy,  0.0%ni, 86.2%id,  7.4%wa,  0.0%hi,  0.3%si,  0.0%st
Cpu4  : 38.5%us,  5.4%sy,  0.3%ni,  0.0%id, 54.8%wa,  0.0%hi,  1.0%si,  0.0%st
Cpu5  :  0.0%us,  0.0%sy,  0.0%ni,100.0%id,  0.0%wa,  0.0%hi,  0.0%si,  0.0%st
Cpu6  :  0.3%us,  0.7%sy,  0.0%ni, 97.3%id,  1.7%wa,  0.0%hi,  0.0%si,  0.0%st
Cpu7  :  5.4%us,  4.4%sy,  0.0%ni, 82.6%id,  7.7%wa,  0.0%hi,  0.0%si,  0.0%st
Cpu8 :  1.7%us,  1.7%sy,  0.0%ni, 72.8%id, 23.8%wa,  0.0%hi,  0.0%si,  0.0%st
6. Refresh Unix Top Command Output On demand (or) Change Refresh Interval
By default, linux top command updates the output every 3.0 seconds. When you want to update the output on-demand, press space bar.To change the output update frequency, press d in interactive mode, and enter the time in seconds as shown below.
Change delay from 3.0 to: 10
PID USER      PR  NI  VIRT  RES  SHR S %CPU %MEM    TIME+  COMMAND
1309 geek   23   0 2483m 1.7g  27m S    0 21.8  45:31.32 gagent
1882 geek   25   0 2485m 1.7g  26m S    0 21.7  22:38.97 gagent
7. Highlight Running Processes in the Linux Top Command Output – Press z or b
Press z or b, which will highlight all running process as shown below.Fig: Ubuntu Linux – top command highlights running process
8. Display Absolute Path of the Command and its Arguments – Press c
Press c which will show / hide command absolute path, and arguments as shown below.PID USER PR NI VIRT RES SHR S %CPU %MEM TIME+ COMMAND 1309 geek 23 0 2483m 1.7g 27m S 0 21.8 45:31.32 /usr/sbin/gagent 1882 geek 25 0 2485m 1.7g 26m S 0 21.7 22:38.97 /usr/sbin/gagent -l 0 -u pre
9. Quit Top Command After a Specified Number of Iterations Using top -n
Until you press q, top continuously displays the output. If you would like to view only a certain iteration and want the top to exit automatically use -n option as shown below.The following example will show 2 iterations of unix top command output and exit automatically
$ top -n 2
10. Executing Unix Top Command in Batch Mode
If you want to execute top command in the batch mode use option -b as shown below.$ top -b -n 1
Note: This option is very helpful when you want to
capture the unix top command output to a readable text file as we discussed earlier.
11. Split Top Output into Multiple Panels – Press A
To display multiple views of top command output on the terminal, press A. You can cycle through these windows using ‘a’. This is very helpful, when you can sort the output on multiple windows using different top output columns.12. Get Top Command Help from Command Line and Interactively
Get a quick command line option help using top -h as shown below.$ top -h top: procps version 3.2.0 usage: top -hv | -bcisS -d delay -n iterations [-u user | -U user] -p pid [,pid ...]
Press h while top command is running, which will display help for interactive top commands.
Help for Interactive Commands - procps version 3.2.0
Window 1:Def: Cumulative mode Off.  System: Delay 3.0 secs; Secure mode Off.

Z,B       Global: 'Z' change color mappings; 'B' disable/enable bold
l,t,m     Toggle Summaries: 'l' load avg; 't' task/cpu stats; 'm' mem info
1,I       Toggle SMP view: '1' single/separate states; 'I' Irix/Solaris mode
..........
13. Decrease Number of Processes Displayed in Top Output – Press n
Press n in the Interactive mode, which prompts for a number and shows only that. Following example will display only 2 process as a time.Maximum tasks = 0, change to (0 is unlimited): 2 PID USER PR NI VIRT RES SHR S %CPU %MEM TIME+ COMMAND 1309 geek 23 0 2483m 1.7g 27m S 0 21.8 45:31.32 gagent 1882 geek 25 0 2485m 1.7g 26m S 0 21.7 22:38.97 gagent
14. Toggle Top Header to Increase Number of Processes Displayed
By default top displays total number process based on the window height. If you like to see additional process you might want to eliminate some of the top header information.Following is the default header information provided by top.
top - 23:47:32 up 179 days,  3:36,  1 user,  load average: 0.01, 0.03, 0.00
Tasks:  67 total,   1 running,  66 sleeping,   0 stopped,   0 zombie
Cpu(s):   0.7% user,   1.2% system,   0.0% nice,  98.0% idle
Mem:   1017136k total,   954652k used,    62484k free,   138280k buffers
Swap:  3068404k total,    22352k used,  3046052k free,   586576k cached
Press l – to hide / show the load average. 1st header line.
Press t – to hide / show the CPU states. 2nd and 3rd header line.
Press m – to hide / show the memory information. 4th and 5th line.
15. Save Top Configuration Settings – Press W
If you’ve made any interactive top command configurations suggested in the above examples, you might want to save those for all future top command output. Once you’ve saved the top configuration, next time when you invoke the top command all your saved topconfiguration options will be used automatically.
To save the top configuration, press W, which will write the configuration files to ~/.toprc. This will display the write confirmation message as shown below.
top - 23:47:32 up 179 days,  3:36,  1 user,  load average: 0.01, 0.03, 0.00
Tasks:  67 total,   1 running,  66 sleeping,   0 stopped,   0 zombie
Cpu(s):   0.7% user,   1.2% system,   0.0% nice,  98.0% idle
Mem:   1017136k total,   954652k used,    62484k free,   138280k buffers
Swap:  3068404k total,    22352k used,  3046052k free,   586576k cached
Wrote configuration to '/home/ramesh/.toprc'
补充:
-b 选项可以令top以batch模式/文本模式 输出;
-n number 输出次数
-c 输出完整命令路径

相关文章推荐
- 15 Practical Grep Command Examples In Linux / UNIX
- 15 Practical Grep Command Examples In Linux / UNIX
- 15 Practical Grep Command Examples In Linux / UNIX
- 15 Practical Grep Command Examples In Linux / UNIX
- 15 Practical Grep Command Examples In Linux / UNIX
- Mommy, I found it! — 15 Practical Linux Find Command Examples(PART 1)
- 15 Practical Linux Find Command Examples
- Mommy, I found it! — 15 Practical Linux Find Command Examples
- 15 Practical Linux cURL Command Examples
- A Complete Guide to Usage of ‘usermod’ command– 15 Practical Examples with Screenshots
- Mommy, I found it!, 15 Awesome Linux Find Command Examples
- 10 examples to help you understand top command usage in Unix/Linux
- 35 Practical Examples of Linux Find Command
- How to Backup Linux? 15 rsync Command Examples
- 12 TOP Command Examples in Linux
- Rsync (Remote Sync): 10 Practical Examples of Rsync Command in Linux
- 15 Linux lsof Command Examples (Identify Open Files)
- linux_12 Practical Examples of Linux grep Command
- 7 Practical Linux Locate Command Examples – mlocate and updatedb
- 15 Basic ‘ls’ Command Examples in Linux