R 语言 7个 免费的GUI图像界面 工具 说明
2012-02-29 13:53
549 查看
之前Blog对R语言的说明:
R 语言 简介
http://blog.csdn.net/tianlesoftware/article/details/7304276
这7款工具的说明整理自如下网站:
http://www.linuxlinks.com/article/20110306113701179/GUIsforR.html
推荐使用RStudio。
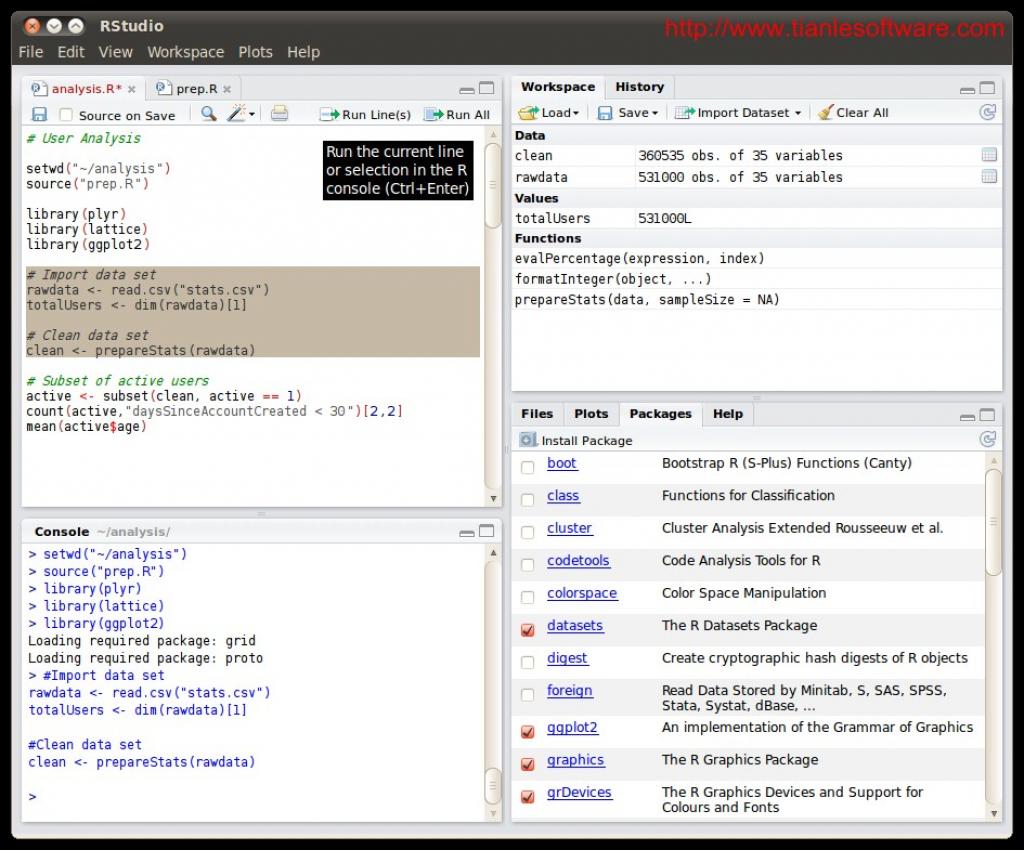
RStudio is anintegrated development environment (IDE) for R. RStudio combines an intuitiveuser interface with powerful coding tools to help you get the most out of R. Itincludes a console, syntax-highlighting editor that supports direct codeexecution, as well as tools for plotting, history, and workspace management.
RStudio includesa wide range of productivity enhancing features and runs on all majorplatforms. RStudio can optionally also be run as server which enables you toprovide a browser based interface to a version of R running on a remote system.
Features include:
(1) Customizable workbench with allof the tools required to work with R in one place (console, source, plots,workspace, help, history, etc)
(2) Syntax highlighting editor withcode completion
(3) Execute code directly from thesource editor (line, selection, or file)
(4) Full support for authoringSweave and TeX documents
(5) Searchable history
(6) Retrieve previous commands
(7) Keyboard shortcuts
(8) Easy installation of newpackages
(9) Runs on all major platforms andcan also be run as a server, enabling multiple users to access the RStudio IDEusing a web browser
(10) Integrated help functionality
Rattle (the RAnalytic Tool To Learn Easily) provides a Gnome based open source interface toR functionality for binary classification tasks and data mining. It is alsoavailable as a product within Information Builders' business intelligence suiteknown as RStat.
The aim is toprovide a simple and intuitive interface that allows a user to quickly loaddata from a CSV file (or via ODBC), transform and explore the data, build andevaluate models, and export models as PMML (predictive modelling markuplanguage) or as scores.
All of this withknowing little about R. All R commands are logged and commented through the logtab. Thus they are available to the user as a script file or as an aide for theuser to learn R or to copy-and-paste directly into R itself. Rattle alsoexports a number of utility functions and the graphical user interface, invokedas rattle(), does not need to be run to deploy these.
Rattle is usedin business, government, research and for teaching data mining in Australia andinternationally.
Features include:
(1) Extensive collection of Rpackages
(2) More than a graphical userinterface to R
(3) File Inputs: CSV, TXT, Excel,ARFF, ODBC, R Dataset, RData File, Library Packages Datasets, Corpus, andScripts.
(4) Statistics: Min, Max,Quartiles, Mean, St Dev, Missing, Medium, Sum, Variance, Skewness, Kurtosis,chi square.
(5) Statistical tests: Correlation,Wilcoxon-Smirnov, Wilcoxon Rank Sum, T-Test, F-Test, and Wilcoxon Signed Rank.
(6) Clustering: KMeans, Clara,Hierarchical, and BiCluster.
(7) Modeling: Decision Trees,Random Forests, ADA Boost, Support Vector Machine, Logistic Regression, andNeural Net.
(8) Evaluation: Confusion Matrix,Risk Charts, Cost Curve, Hand, Lift, ROC, Precision, Sensitivity.
(9) Charts: Box Plot, Histogram,Correlations, Dendrograms, Cumulative, Principle Components, Benford, Bar Plot,Dot Pot,and Mosaic.
(10) Transformations: Rescale (Recenter, Scale 0-1, Median/MAD, NaturalLog, and Matrix) - Impute ( Zero/Missing, Mean, Medium, Mode & Constant),Recode (Binning, Kmeans, Equal Widths, Indicator, Join Categories) - Cleanup(Delete Ignored, Delete Selected, Delete Missing, Delete Obs with Missing)

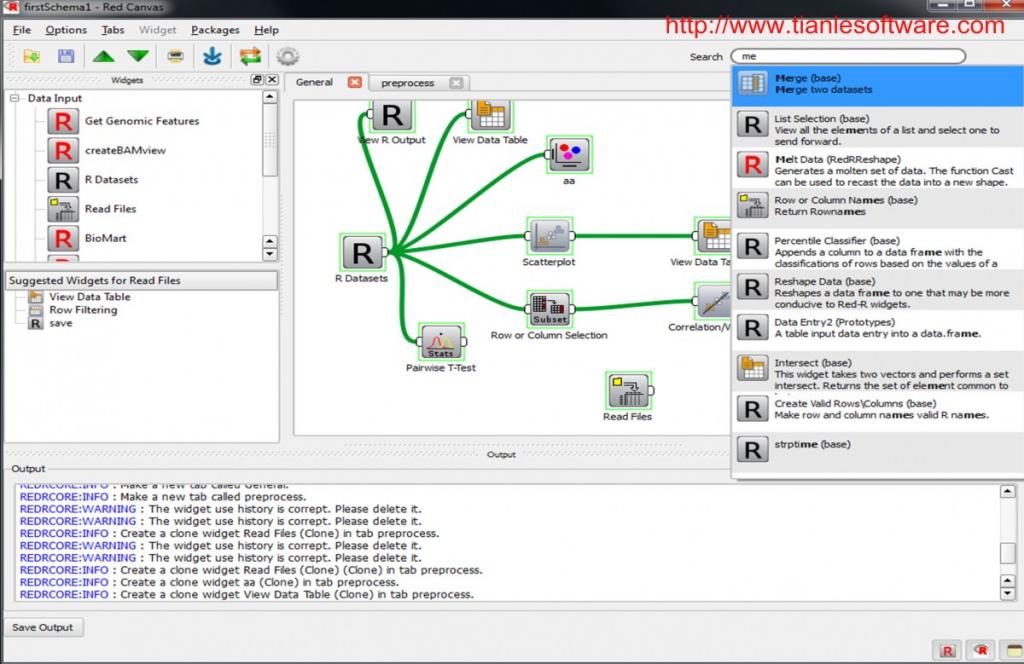
Red-R is an opensource visual programming interface for R designed to bring the power of the Rstatistical environment to a broader audience.
Red-R is anextension of Orange, a data mining framework written in Python and Qt. Red-Raccesses all the functionality and data in R, using the Python interface for Rprovided by RPy.
Features include:
(1) Highly flexible framework
(2) Harnesses the power of Qtgraphics to create interactive visualizations
(3) Allows data interaction notpossible within the R framework
(4) Table data viewing
(5) Create powerful interactivegraphics
(6) Logging system
(7) Unicode support
Deducer isdesigned to be a free easy to use alternative to proprietary data analysissoftware such as SPSS, JMP, and Minitab. It has a menu system to do common datamanipulation and analysis tasks, and an excel-like spreadsheet in which to viewand edit data frames.
Deducer isintuitive and attempts to be efficient for beginners and experts alike.
Features include:
(1) Intuitive interface
(2) Data viewer provides an easy touse, spreadsheet-like environment to view and edit data
(3) Task based dialogs
(4) Work with multiple data framesat the same time
(5) Multiple analyses
(6) Tests and analyses areformatted into easy to read tables
(7) Analysis plots
(8) Perform common tasks with a fewmouse clicks
(9) Online help system
(10) Extension packages
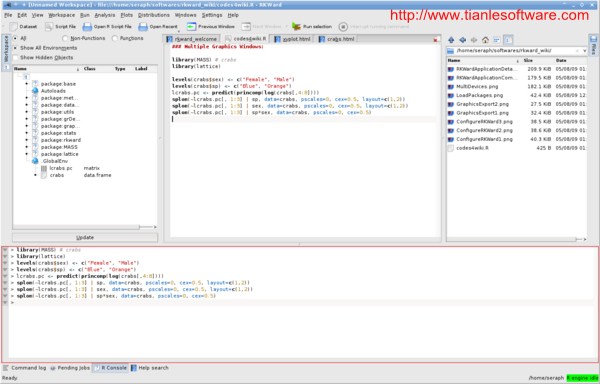
RKWard aims tobecome an easy to use, transparent frontend to R, a powerful system forstatistical computation and graphics. This software tries to combine the powerof the R-language with the ease of use of commercial statistical packages.
Besides aconvenient GUI for the most important statistical functions, future versionswill also provide seamless integration with an office-suite. Although it canrun in numerous environments, it was designed for and integrates with the KDEdesktop environment.
It aims toprovide useful features both to experienced users of R, wishing to exploit R'sscripting capabilities, as well as to users new to R, looking for an easy wayto carry out statistical computation tasks.
Features include:
(1) Transparent interface to theunderlying R-language
(2) Strives to separate content anddesign to a high degree
(3) Relies on a language, that isnot only very powerful, but also extensible, and for which dozens of extensionsalready exist
(4) Console with syntaxhighlighting
(5) Script editors
(6) Workspace view which allowsusers to example and manipulate all objects in the R workspace
(7) Built-in editor for data.frames
(8) Analysis: including:
1) Correlation
2) Crosstabs
3) Descriptive Statistics
4) Item Response Theory
5) Means
6) Miscellaneous tests
7) Moments
8) Outlier Tests
9) Regression
10) Time Series
11) Variance / Scale
12) Wilicoxon Tests
(9)Plots:
1) Barplot
2) Box Plot
3) Density Plot
4) Dotchart
5) ECDF Plot
6) Generic Plot
7) Histogram
8) Pareto Chart
9) Piechart
10) Scatterplot
11) Scatterplot Matrix
12) Stem-and-Leaf Plot
13) Stripchart
14) Item Response Theory
(10)Distributions:
1) Distribution Analysis:Anderson-Darling Normality Test, Cramer-von Mises Normality Test, Lilliefors(Kolmogorov-Smirnov) Normality Test, Pearson chi-square Normality Test,Shapiro-Francia Normality Test, Shapiro-Wilk Normality Test, Jarque-BeraNormality Test
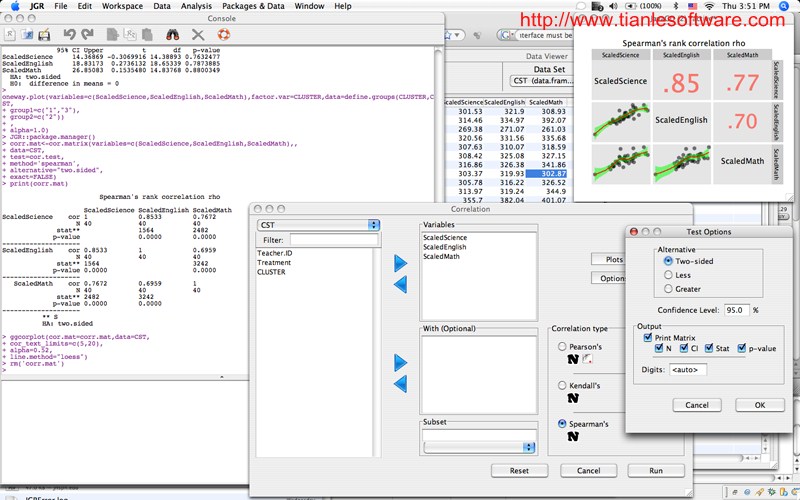
JGR (pronounced 'Jaguar') is a universaland unified graphical user interface for R.
Features include:
(1)Offers a portable interface
(2)Integrated editor with:
1)Syntaxhighlighting
2)Autocompletion
3)Directcommand transfer
4)Devise andrevise analyses
(3)Integrated multi tabbed help system
(4)'Type-on' spreadsheet
(5)Console with autocompletion
(6)Object browser featuring
1)Tabbed objectview
2)Modelcomparison
3)Drag &Drop
(7)Direct 'Open' dialog for simpledataset loading
(8)Tooltips for help

R commander isfree statistical software. R commander was developed as an easy to usegraphical user interface (GUI) for R (freeware statistical programminglanguage).
The R-CommanderGUI consists of a window containing several menus, buttons, and informationfields. In addition, the Commander window contains script and output textwindows. The R-Commander menus are easily configurable through a text file or,preferably, through plug-in packages.
Features include:
(1)Statistics:
1) Contingency tables
2) Means
3) Proportions
4) Variances
5) Nonparametric tests
6) Dimensional analysis
7) Fit models
(2)Graphs:
1) Histogram
2) Stem-and-leaf display
3) Boxplot
4) Quantile-comparison plot
5) Scatterplot
6) Scatterplot matric
7) Line graph
8) XY conditioning plot
9) Plot of means
10) Strip chart
11) Bar graph
12) Pie chart
13) 3D graph
(3)Models:
1) Confidence intervals
2) Akaike Information Criterion
3) Bayesian Information Criterion
4) Stepwise model selection
5) Subset model selection
6) Hypothesis test
7) Numerical diagnostics
8) Graphs
(4)Distributions:
1) Continuous
2) Discrete
(5)Translations
-------------------------------------------------------------------------------------------------------
版权所有,文章允许转载,但必须以链接方式注明源地址,否则追究法律责任!
Skype: tianlesoftware
Email: tianlesoftware@gmail.com
Blog: http://www.tianlesoftware.com
Weibo: http://weibo.com/tianlesoftware
Twitter: http://twitter.com/tianlesoftware
Facebook: http://www.facebook.com/tianlesoftware
Linkedin: http://cn.linkedin.com/in/tianlesoftware
-------加群需要在备注说明Oracle表空间和数据文件的关系,否则拒绝申请----
DBA1 群:62697716(满); DBA2 群:62697977(满) DBA3 群:62697850(满)
DBA 超级群:63306533(满); DBA4 群:83829929 DBA5群: 142216823
DBA6 群:158654907 DBA7 群:172855474 DBA总群:104207940
R 语言 简介
http://blog.csdn.net/tianlesoftware/article/details/7304276
这7款工具的说明整理自如下网站:
http://www.linuxlinks.com/article/20110306113701179/GUIsforR.html
| Graphical user interfaces for R | |
| RStudio | Integrated development environment (IDE) for R |
| Rattle | Gnome cross platform GUI for Data Mining using R |
| Red-R | Open source visual programming interface for R |
| Deducer | Intuitive, cross-platform graphical data analysis system |
| RKWard | Easy to use, transparent frontend |
| JGR | Universal and unified graphical user interface for R |
| R Commander | Basic-Statistics GUI for R |
一.RStudio
官网地址:http://www.rstudio.org/推荐使用RStudio。
RStudio is anintegrated development environment (IDE) for R. RStudio combines an intuitiveuser interface with powerful coding tools to help you get the most out of R. Itincludes a console, syntax-highlighting editor that supports direct codeexecution, as well as tools for plotting, history, and workspace management.
RStudio includesa wide range of productivity enhancing features and runs on all majorplatforms. RStudio can optionally also be run as server which enables you toprovide a browser based interface to a version of R running on a remote system.
Features include:
(1) Customizable workbench with allof the tools required to work with R in one place (console, source, plots,workspace, help, history, etc)
(2) Syntax highlighting editor withcode completion
(3) Execute code directly from thesource editor (line, selection, or file)
(4) Full support for authoringSweave and TeX documents
(5) Searchable history
(6) Retrieve previous commands
(7) Keyboard shortcuts
(8) Easy installation of newpackages
(9) Runs on all major platforms andcan also be run as a server, enabling multiple users to access the RStudio IDEusing a web browser
(10) Integrated help functionality
二. Rattle
网址:http://rattle.togaware.com/Rattle (the RAnalytic Tool To Learn Easily) provides a Gnome based open source interface toR functionality for binary classification tasks and data mining. It is alsoavailable as a product within Information Builders' business intelligence suiteknown as RStat.
The aim is toprovide a simple and intuitive interface that allows a user to quickly loaddata from a CSV file (or via ODBC), transform and explore the data, build andevaluate models, and export models as PMML (predictive modelling markuplanguage) or as scores.
All of this withknowing little about R. All R commands are logged and commented through the logtab. Thus they are available to the user as a script file or as an aide for theuser to learn R or to copy-and-paste directly into R itself. Rattle alsoexports a number of utility functions and the graphical user interface, invokedas rattle(), does not need to be run to deploy these.
Rattle is usedin business, government, research and for teaching data mining in Australia andinternationally.
Features include:
(1) Extensive collection of Rpackages
(2) More than a graphical userinterface to R
(3) File Inputs: CSV, TXT, Excel,ARFF, ODBC, R Dataset, RData File, Library Packages Datasets, Corpus, andScripts.
(4) Statistics: Min, Max,Quartiles, Mean, St Dev, Missing, Medium, Sum, Variance, Skewness, Kurtosis,chi square.
(5) Statistical tests: Correlation,Wilcoxon-Smirnov, Wilcoxon Rank Sum, T-Test, F-Test, and Wilcoxon Signed Rank.
(6) Clustering: KMeans, Clara,Hierarchical, and BiCluster.
(7) Modeling: Decision Trees,Random Forests, ADA Boost, Support Vector Machine, Logistic Regression, andNeural Net.
(8) Evaluation: Confusion Matrix,Risk Charts, Cost Curve, Hand, Lift, ROC, Precision, Sensitivity.
(9) Charts: Box Plot, Histogram,Correlations, Dendrograms, Cumulative, Principle Components, Benford, Bar Plot,Dot Pot,and Mosaic.
(10) Transformations: Rescale (Recenter, Scale 0-1, Median/MAD, NaturalLog, and Matrix) - Impute ( Zero/Missing, Mean, Medium, Mode & Constant),Recode (Binning, Kmeans, Equal Widths, Indicator, Join Categories) - Cleanup(Delete Ignored, Delete Selected, Delete Missing, Delete Obs with Missing)
三.Red-R
官网地址:www.red-r.orgRed-R is an opensource visual programming interface for R designed to bring the power of the Rstatistical environment to a broader audience.
Red-R is anextension of Orange, a data mining framework written in Python and Qt. Red-Raccesses all the functionality and data in R, using the Python interface for Rprovided by RPy.
Features include:
(1) Highly flexible framework
(2) Harnesses the power of Qtgraphics to create interactive visualizations
(3) Allows data interaction notpossible within the R framework
(4) Table data viewing
(5) Create powerful interactivegraphics
(6) Logging system
(7) Unicode support
四.Deducer
官网地址:www.deducer.comDeducer isdesigned to be a free easy to use alternative to proprietary data analysissoftware such as SPSS, JMP, and Minitab. It has a menu system to do common datamanipulation and analysis tasks, and an excel-like spreadsheet in which to viewand edit data frames.
Deducer isintuitive and attempts to be efficient for beginners and experts alike.
Features include:
(1) Intuitive interface
(2) Data viewer provides an easy touse, spreadsheet-like environment to view and edit data
(3) Task based dialogs
(4) Work with multiple data framesat the same time
(5) Multiple analyses
(6) Tests and analyses areformatted into easy to read tables
(7) Analysis plots
(8) Perform common tasks with a fewmouse clicks
(9) Online help system
(10) Extension packages
五. RKWard
官网地址:rkward.sourceforge.netRKWard aims tobecome an easy to use, transparent frontend to R, a powerful system forstatistical computation and graphics. This software tries to combine the powerof the R-language with the ease of use of commercial statistical packages.
Besides aconvenient GUI for the most important statistical functions, future versionswill also provide seamless integration with an office-suite. Although it canrun in numerous environments, it was designed for and integrates with the KDEdesktop environment.
It aims toprovide useful features both to experienced users of R, wishing to exploit R'sscripting capabilities, as well as to users new to R, looking for an easy wayto carry out statistical computation tasks.
Features include:
(1) Transparent interface to theunderlying R-language
(2) Strives to separate content anddesign to a high degree
(3) Relies on a language, that isnot only very powerful, but also extensible, and for which dozens of extensionsalready exist
(4) Console with syntaxhighlighting
(5) Script editors
(6) Workspace view which allowsusers to example and manipulate all objects in the R workspace
(7) Built-in editor for data.frames
(8) Analysis: including:
1) Correlation
2) Crosstabs
3) Descriptive Statistics
4) Item Response Theory
5) Means
6) Miscellaneous tests
7) Moments
8) Outlier Tests
9) Regression
10) Time Series
11) Variance / Scale
12) Wilicoxon Tests
(9)Plots:
1) Barplot
2) Box Plot
3) Density Plot
4) Dotchart
5) ECDF Plot
6) Generic Plot
7) Histogram
8) Pareto Chart
9) Piechart
10) Scatterplot
11) Scatterplot Matrix
12) Stem-and-Leaf Plot
13) Stripchart
14) Item Response Theory
(10)Distributions:
1) Distribution Analysis:Anderson-Darling Normality Test, Cramer-von Mises Normality Test, Lilliefors(Kolmogorov-Smirnov) Normality Test, Pearson chi-square Normality Test,Shapiro-Francia Normality Test, Shapiro-Wilk Normality Test, Jarque-BeraNormality Test
六. JGR
官方网址:rforge.net/JGR/JGR (pronounced 'Jaguar') is a universaland unified graphical user interface for R.
Features include:
(1)Offers a portable interface
(2)Integrated editor with:
1)Syntaxhighlighting
2)Autocompletion
3)Directcommand transfer
4)Devise andrevise analyses
(3)Integrated multi tabbed help system
(4)'Type-on' spreadsheet
(5)Console with autocompletion
(6)Object browser featuring
1)Tabbed objectview
2)Modelcomparison
3)Drag &Drop
(7)Direct 'Open' dialog for simpledataset loading
(8)Tooltips for help
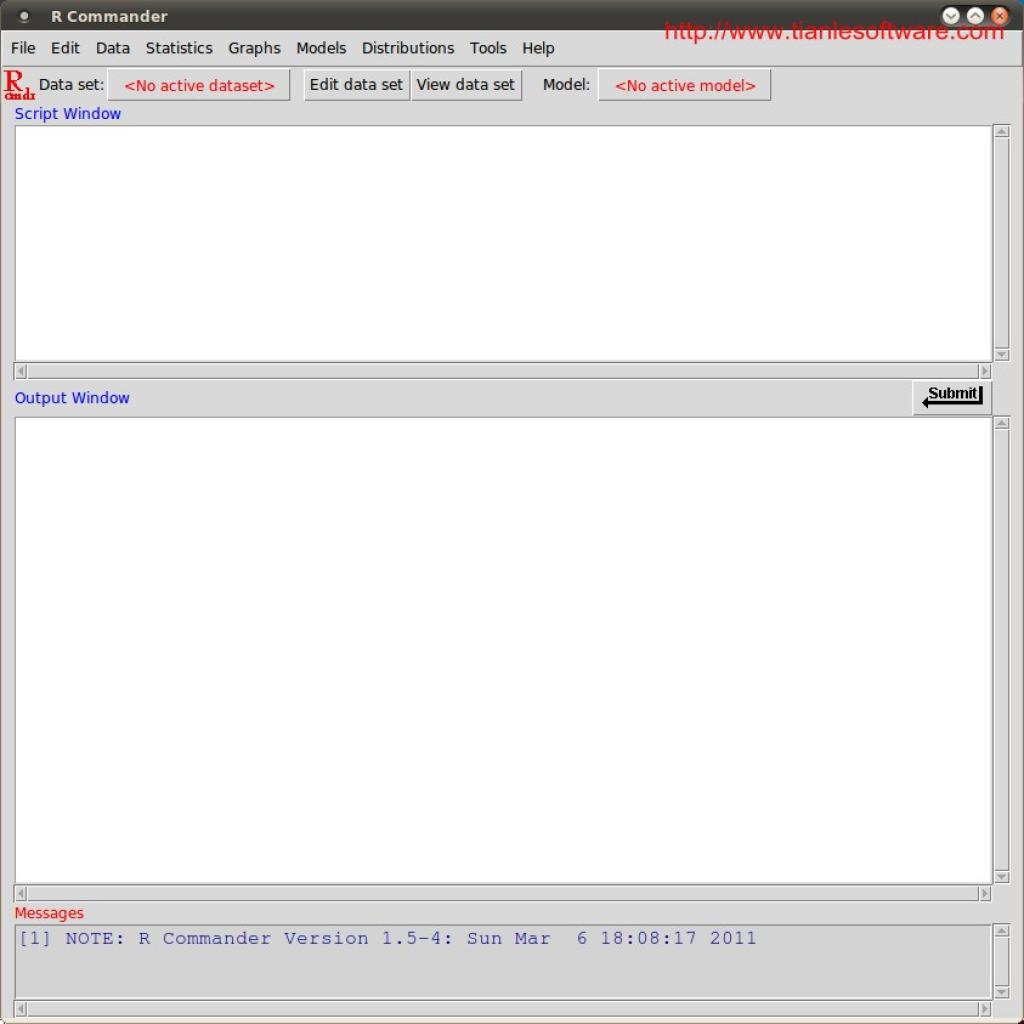
七.R Commander
官网地址:socserv.mcmaster.caR commander isfree statistical software. R commander was developed as an easy to usegraphical user interface (GUI) for R (freeware statistical programminglanguage).
The R-CommanderGUI consists of a window containing several menus, buttons, and informationfields. In addition, the Commander window contains script and output textwindows. The R-Commander menus are easily configurable through a text file or,preferably, through plug-in packages.
Features include:
(1)Statistics:
1) Contingency tables
2) Means
3) Proportions
4) Variances
5) Nonparametric tests
6) Dimensional analysis
7) Fit models
(2)Graphs:
1) Histogram
2) Stem-and-leaf display
3) Boxplot
4) Quantile-comparison plot
5) Scatterplot
6) Scatterplot matric
7) Line graph
8) XY conditioning plot
9) Plot of means
10) Strip chart
11) Bar graph
12) Pie chart
13) 3D graph
(3)Models:
1) Confidence intervals
2) Akaike Information Criterion
3) Bayesian Information Criterion
4) Stepwise model selection
5) Subset model selection
6) Hypothesis test
7) Numerical diagnostics
8) Graphs
(4)Distributions:
1) Continuous
2) Discrete
(5)Translations
-------------------------------------------------------------------------------------------------------
版权所有,文章允许转载,但必须以链接方式注明源地址,否则追究法律责任!
Skype: tianlesoftware
Email: tianlesoftware@gmail.com
Blog: http://www.tianlesoftware.com
Weibo: http://weibo.com/tianlesoftware
Twitter: http://twitter.com/tianlesoftware
Facebook: http://www.facebook.com/tianlesoftware
Linkedin: http://cn.linkedin.com/in/tianlesoftware
-------加群需要在备注说明Oracle表空间和数据文件的关系,否则拒绝申请----
DBA1 群:62697716(满); DBA2 群:62697977(满) DBA3 群:62697850(满)
DBA 超级群:63306533(满); DBA4 群:83829929 DBA5群: 142216823
DBA6 群:158654907 DBA7 群:172855474 DBA总群:104207940

相关文章推荐
- R 语言 7个 免费的GUI图像界面 工具 说明
- R 语言 7个 免费的GUI图像界面 工具 说明
- R 语言 7个 免费的GUI图像界面 工具 说明
- R 语言 7个 免费的GUI图像界面 工具 说明
- R 语言 7个 免费的GUI图像界面 工具 说明
- Hyper-v Server安装与配置-新加GUI界面配置工具介绍
- Qt GUI设计 界面语言动态切换(1)
- 免费和开源的动图gif工具,没广告!效率高,体积小,精通18国语言,必备良品!!!
- Hyper-v Server安装与配置-新加GUI界面配置工具介绍
- 选择Python GUI界面开发工具
- 推荐一款界面模型构建工具——GUI Design Studio
- 免费的.netFramework 混淆工具 Babel obfuscator GUI
- Matlab-GUIDE使用说明(Matlab-GUI界面)
- 免费的.netFramework 混淆工具 Babel obfuscator GUI
- Installshield中,关于多语言包的语言选择界面说明
- JS CSS 压缩工具(GUI界面)
- 免费软件 Cmd GUI Shell(图形界面的命令提示符壳)-beta3
- 用VS自带的工具制作 安装包(2)--调整vs2005安装包的界面语言
- GUIimagex (imagex的gui图像界面版)发布
- 选择Python GUI界面开发工具