ChartDirector 5.0 for python 笔记【11】Icon Pie Chart 上篇
2012-01-09 23:36
381 查看
本文关于饼图中的个性化icon图标。
要点关注:
BaseChart.addExtraField用来添加自定义的额外域(field)到图表中。当引用的时候,用{field0}表示第一个添加的额外域,{field1}表示第二个添加的额外域。。。
源代码如下:
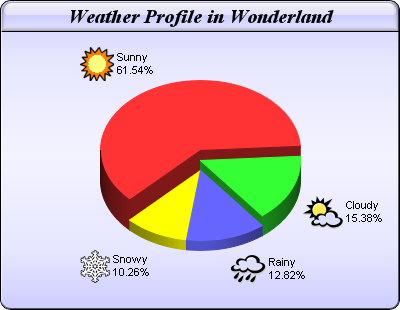
最终的效果图:
要点关注:
BaseChart.addExtraField用来添加自定义的额外域(field)到图表中。当引用的时候,用{field0}表示第一个添加的额外域,{field1}表示第二个添加的额外域。。。
源代码如下:
#-*-encoding:utf-8 -*-
from pychartdir import *
setLicenseCode("SXZVFNRN9MZ9L8LGA0E2B1BB");#这个是注册,防止有logo产生

data = [72, 18, 15, 12]
depths = [30, 20, 10, 10]
labels = ["Sunny", "Cloudy", "Rainy", "Snowy"]
icons = ["sun.png", "cloud.png", "rain.png", "snowy.png"]

c = PieChart(400, 310, metalColor('0xccccff', 0), '0x000000', 1)
c.setRoundedFrame()
c.setPieSize(200, 180, 100)
c.addTitle("Weather Profile in Wonderland", "timesbi.ttf", 15).setBackground(
'0xccccff', '0x000000', glassEffect())
c.setData(data, labels)

# 将图标作为自定义域添加到图表。
c.addExtraField(icons)

# 用CDML来设置扇区的标签,包含进自定义的图标。
c.setLabelFormat(
"<*block,valign=absmiddle*><*img={field0}*> <*block*>{label}\n{percent}%<*/*>" \
"<*/*>")

c.set3D2(depths)

c.setStartAngle(225)

c.makeChart("iconpie.png")
最终的效果图:

相关文章推荐
- ChartDirector 5.0 for python 笔记【3】3D Pie Chart
- ChartDirector 5.0 for python 笔记【9】Exploded Pie Chart
- ChartDirector 5.0 for python 笔记【4】Multi-Depth Pie Chart
- ChartDirector 5.0 for python 笔记【6】Circular Label Layout
- ChartDirector 5.0 for python 笔记【5】Side Label Layout
- ChartDirector 5.0 for python 笔记【1】环境介绍和搭建
- ChartDirector 5.0 for python 笔记【0】目录概览
- ChartDirector 5.0 for python 笔记【7】Pie Chart with Legend 上篇
- ChartDirector 5.0 for python 笔记【8】Pie Chart with Legend 下篇
- ChartDirector 5.0 for python 笔记【10】CDML 标记语言
- ChartDirector 5.0 for python 笔记【2】Simple Pie Chart
- Python Scripting for Computational Science 阅读笔记之矩阵
- 【深度学习】笔记11:python caffe报错:No module named google.protobuf.internal
- python基础教程_学习笔记11:魔法方法、属性和迭代器
- Python3学习笔记【基础3--list,tuple,if条件判断,for/while循环,dict字典,set集合】
- 微软企业库5.0学习笔记(11)WCF和ASP.NET Web服务应用程序
- python笔记11--面向对象
- VIM 笔记 (for python )
- Codecademy For Python学习笔记
- python自学笔记11之文件(文本、CSV)