.net环境下分析程序调用关系图工具
2008-05-29 11:06
357 查看
一直想找个能画出软件中函数关系调用图的工具软件,网上找了很久,找到的大都是C++或Java的,能在.net环境下用的很少!今天,元宝向大家推荐一款软件:CLR Profiler,这个软件本来是.NET程序分析优化软件,用来看函数关系调用图,真是”牛刀小试“了!
以下是是微软件msdn.com上的原文
Use CLR Profiler for C# Call Graphs and Optimization
I recently had the need to debug some code and was looking for an easy way to generate the call graph of the application. For a given function I wanted to see who its callers were and who the callers of the callers were, etc. Turns out Microsoft has a free tool called the CLR Profiler that does precisely this. Here is how to use it:
Download and run the executable from this URL.
Click on "Start" and select "Run".
Type C:\CLR Profiler\Binaries and click "OK".
Click on ClrProfiler.exe.
Click on "Start Application".
Select the application you want to analyze.
Then click on "Kill Application".
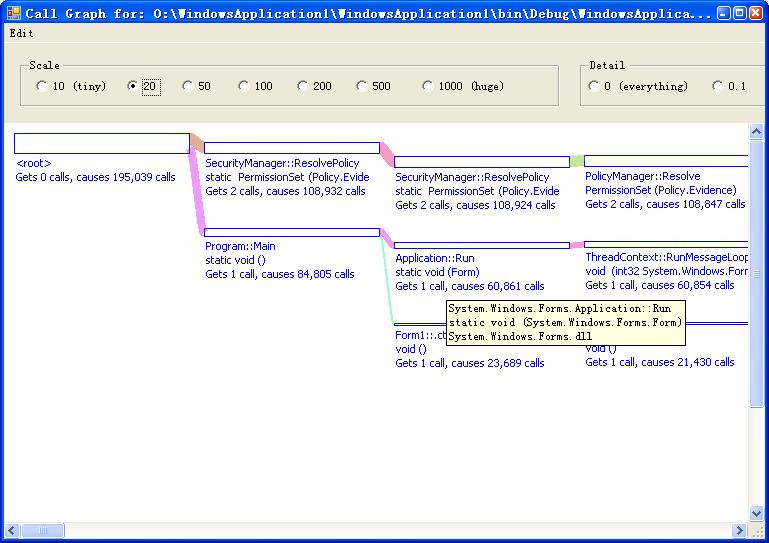
To view the call graph click on View and select "Call Graph".
This can also be used to profile the program and to improve and optimize its performance. Also it works with ASP.NET applications. Overall, an extremely cool application.
CLRProfiler for .net 2.0下载:
官方下载
附:
CLR Profiler介绍
CLR rofiler允许你查看进程的托管堆并且研究垃圾回收器的特性,使用该工具的不同视图,你可以得到你的应用程序有关执行,分配,已经内存消耗的情况。
CLR rofiler不是分析问题的起点,确切的说,它帮助你鉴别并且隔离有疑问的代码并且追踪内存泄漏。使用CLR Profiler,你可以鉴别哪些代码分配了太多的内存,导致太多次的内存回收已经占有内存时间太长。
注意:CLR Profiler是一个插入式的分析器,它会严重地减慢被分析的应用程序的运行速度,某些情况下会导致10-100倍的速度减缓,该工具不是设计用在产品环境中。
你需要了解的:
The primary function of CLR Profiler的主要功能是允许你了解你的应用程序如何与托管的,可回收的堆交互的。更重要的是,你可以研究包括:
谁在托管堆上分配了什么(谁,什么)
谁存活在托管堆上
谁引用了对象
垃圾回收器在你的程序的生存周期内做了什么
嗅探的结果被保存在日志文件中,你可以通过CLR Profiler的视图菜单以不同的方式来显示相应的视图。下表描述了几个主要的视图:
以下是是微软件msdn.com上的原文
Use CLR Profiler for C# Call Graphs and Optimization


I recently had the need to debug some code and was looking for an easy way to generate the call graph of the application. For a given function I wanted to see who its callers were and who the callers of the callers were, etc. Turns out Microsoft has a free tool called the CLR Profiler that does precisely this. Here is how to use it:Download and run the executable from this URL.
Click on "Start" and select "Run".
Type C:\CLR Profiler\Binaries and click "OK".
Click on ClrProfiler.exe.
Click on "Start Application".
Select the application you want to analyze.
Then click on "Kill Application".
To view the call graph click on View and select "Call Graph".
This can also be used to profile the program and to improve and optimize its performance. Also it works with ASP.NET applications. Overall, an extremely cool application.
CLRProfiler for .net 2.0下载:
官方下载
附:
CLR Profiler介绍
CLR rofiler允许你查看进程的托管堆并且研究垃圾回收器的特性,使用该工具的不同视图,你可以得到你的应用程序有关执行,分配,已经内存消耗的情况。
CLR rofiler不是分析问题的起点,确切的说,它帮助你鉴别并且隔离有疑问的代码并且追踪内存泄漏。使用CLR Profiler,你可以鉴别哪些代码分配了太多的内存,导致太多次的内存回收已经占有内存时间太长。
注意:CLR Profiler是一个插入式的分析器,它会严重地减慢被分析的应用程序的运行速度,某些情况下会导致10-100倍的速度减缓,该工具不是设计用在产品环境中。
你需要了解的:
The primary function of CLR Profiler的主要功能是允许你了解你的应用程序如何与托管的,可回收的堆交互的。更重要的是,你可以研究包括:
谁在托管堆上分配了什么(谁,什么)
谁存活在托管堆上
谁引用了对象
垃圾回收器在你的程序的生存周期内做了什么
嗅探的结果被保存在日志文件中,你可以通过CLR Profiler的视图菜单以不同的方式来显示相应的视图。下表描述了几个主要的视图:
| 视图 | 对应的描述 |
| Histogram Allocated Types | 给你一个在你程序的生命期中哪些类型对象被分配的高级视图,该视图还显示被分配在大对象堆中的对象, Gives you a high-level view of what object types are allocated (by allocation size) during the lifetime of your application. This view also shows those objects that are allocated in the large object heap (objects larger than 85 KB). This view allows you to click parts of the graph so that you can see which methods allocated which objects. |
| Histogram Relocated Types | 展示被垃圾回收器迁移的对象(因为它们在垃圾回收过程中被保留) |
| Objects By Address | 显示在指定的时间托管堆上都有哪些对象 |
| Histogram By Age | 允许你查看托管堆上对象的生命期 |
| Allocation Graph | 图形化显示对象分配的调用堆栈,你可以使用该视图: -查看每个方法的内存消费 -找出你不期望的内存分配 -找到有可能过度分配内存的方法 |
| Assembly, Module, Function, and Class Graph | 这四个视图很相似.你可以看到某个方法涉及到哪些Assembly,哪些类,哪些模块,哪些函数 |
| Heap Graph | 显示托管堆上的所有对象,以及它们的相关联对象. |
| Call Graph | Lets you see which methods call which other methods and how frequently. You can use this graph to get a feel for the cost of library calls and to determine how many calls are made to methods and which methods are called. |
| Time Line | Displays what the garbage collector does over the lifetime of the application. Use this view to: -Investigate the behavior of the garbage collector. -Determine how many garbage collections occur at the three generations (Generation 0, 1, and 2) and how frequently they occur. -Determine which objects survive garbage collection and are promoted to the next generation. You can select time points or intervals and right-click to show who allocated memory in the interval. |
| Call Tree View | Provides a text-based, chronological, hierarchical view of your application's execution. Use this view to: -See what types are allocated and their size. -See which assemblies are loaded as result of method calls. -Analyze the use of finalizers, including the number of finalizers executed. -Identify methods where Close or Dispose has not been implemented or called, thereby causing a bottleneck. -Analyze allocations that you were not expecting. |

相关文章推荐
- .net程序调用检测和性能分析工具——DotTrace
- NET程序内存分析工具CLRProfiler的使用(性能测试)
- 各类分析函数调用关系图的工具
- IE 性能分析工具(asp.net环境)
- 在无VS开发环境的情况下调用Asp.net网站配置工具{转}
- 在无VS开发环境的情况下调用Asp.net网站配置工具
- 源码分析:静态分析 C 程序函数调用关系图
- 【转】各类分析函数调用关系图的工具
- C静态函数调用关系分析工具cflow
- [原创]推荐一款强大的.NET程序内存分析工具.NET Memory Profiler
- 各类分析函数调用关系图的工具
- 源码分析:静态分析 C 程序函数调用关系图
- 用于分析和生成代码函数调用关系图的相关工具
- 各类分析函数调用关系图的工具
- 各类分析函数调用关系图的工具
- 各类分析函数调用关系图的工具
- 各类分析函数调用关系图的工具
- 各类分析函数调用关系图的工具
- [授权发表]源码分析:静态分析 C 程序函数调用关系
- [授权发表]源码分析:动态分析 C 程序函数调用关系