Flink实战-实时读取日志文件和kafka,持续统计TOP10热门商品
2021-01-01 23:23
621 查看
从日志中读取数据做一些统计聚合,最终把想要的数据输出,基本是每个公司都会有的场景,比如用户分析,商品分析,实时大屏等等,我们最早的做法是全部读出来,写到redis或者es去,然后web端再去实时查询统计,其实有很多的弊端
要么每次请求都会去重新算一遍耗性能不说还慢的不行,业务方接受不了
或者直接把统计信息存进去,但要实时统计就比较麻烦,比如1小时存一个点,那业务方可能要的是当前10:05-11:05的数据。。。
用Flink可以很方便的实现,这里分别展示从csv和kafka里读大批量日志,flink来做统计每小时的热门商品,以5分钟做一个间隔,实现上每次延迟1s输出一次模拟实时
基本需求:
统计近一小时的热门商品,每5分钟更新一次
热门度用浏览次数(pv)来衡量
解决思路:
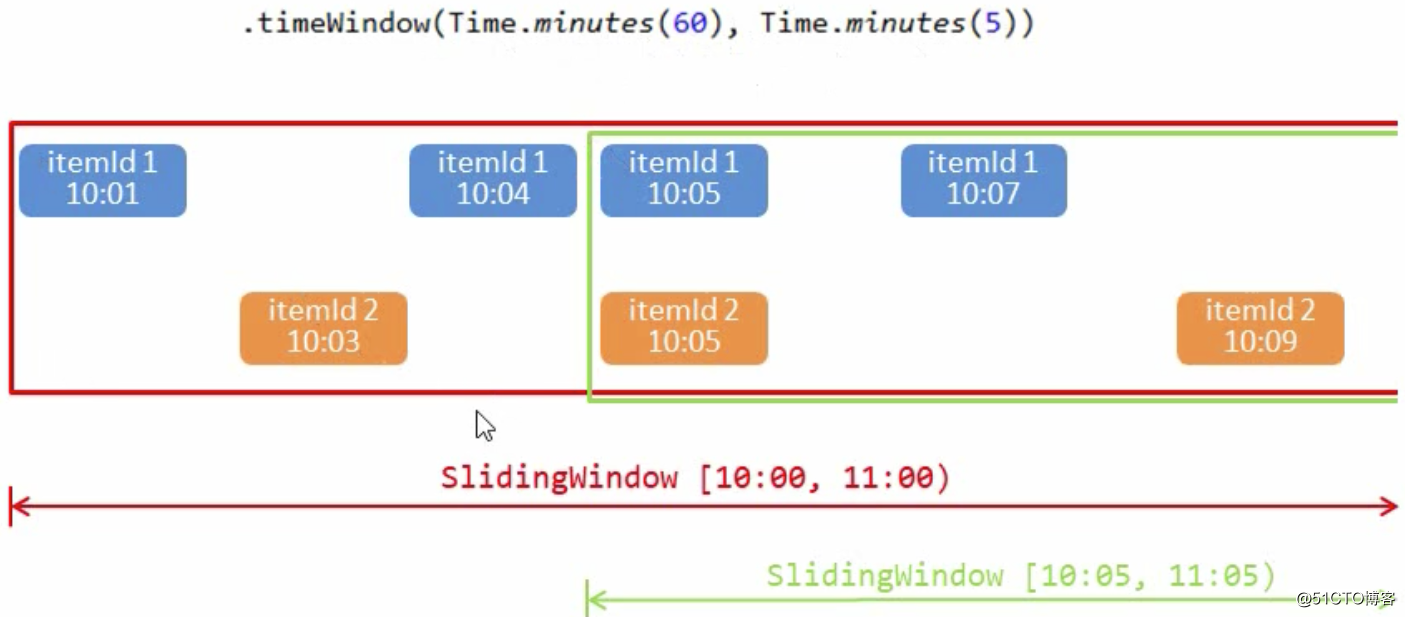
在所有用户行为中,过滤出来浏览(pv)行为进行统计
构建一个滑动窗口,窗口长度为1小时,每次滑动5分钟
整个实现流程:
DataStream
-> 过滤出来是浏览行为的数据
-> 根据商品id进行分组生成KeydStream(key by 操作)
-> 构建滑动窗口,窗口长度1小时,每次滑动5分钟
-> 进行聚合算总数
-> 生成一个最终输出的DataStream
环境准备
1、新建项目
打开IDEA新建一个maven项目,UserBehaviorAnalysis,新建一个包 com.mafei.hotitems_analysis
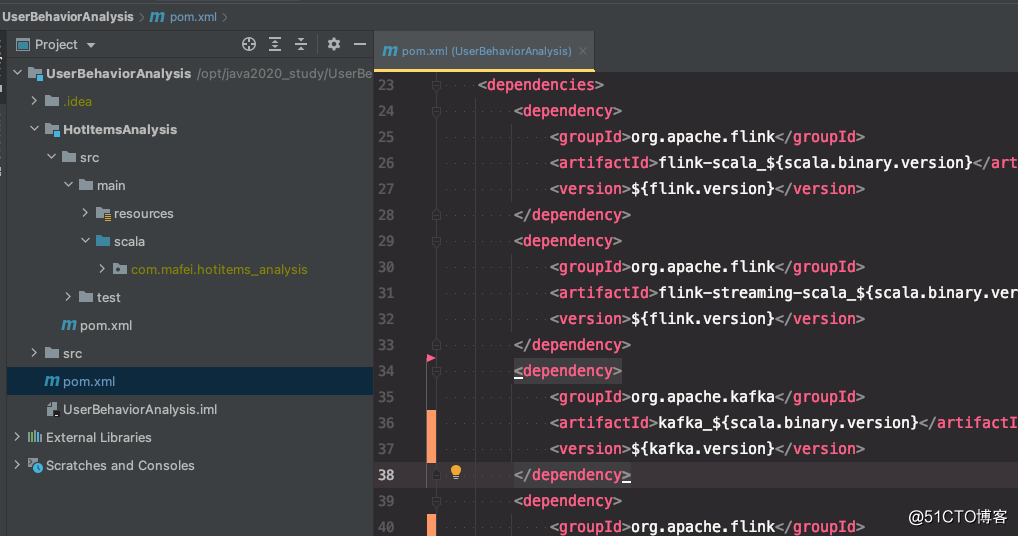
2、父项目中准备依赖和打包相关 pom.xml
<?xml version="1.0" encoding="UTF-8"?>
<project xmlns="http://maven.apache.org/POM/4.0.0"
xmlns:xsi="http://www.w3.org/2001/XMLSchema-instance"
xsi:schemaLocation="http://maven.apache.org/POM/4.0.0 http://maven.apache.org/xsd/maven-4.0.0.xsd">
<modelVersion>4.0.0</modelVersion>

<groupId>com.mafei</groupId>
<artifactId>UserBehaviorAnalysis</artifactId>
<packaging>pom</packaging>
<version>1.0</version>
<modules>
<module>HotItemsAnalysis</module>
</modules>

<properties>
<maven.compiler.source>8</maven.compiler.source>
<maven.compiler.target>8</maven.compiler.target>

<flink.version>1.10.1</flink.version>
<scala.binary.version>2.12</scala.binary.version>
<kafka.version>2.2.0</kafka.version>
</properties>
<dependencies>
<dependency>
<groupId>org.apache.flink</groupId>
<artifactId>flink-scala_${scala.binary.version}</artifactId>
<version>${flink.version}</version>
</dependency>
<dependency>
<groupId>org.apache.flink</groupId>
<artifactId>flink-streaming-scala_${scala.binary.version}</artifactId>
<version>${flink.version}</version>
</dependency>
<dependency>
<groupId>org.apache.kafka</groupId>
<artifactId>kafka_${scala.binary.version}</artifactId>
<version>${kafka.version}</version>
</dependency>
<dependency>
<groupId>org.apache.flink</groupId>
<artifactId>flink-connector-kafka_${scala.binary.version}</artifactId>
<version>${flink.version}</version>
</dependency>
<!-- 用hutool只是为了造模拟数据用,实际生产中可以不用引入-->
<dependency>
<groupId>cn.hutool</groupId>
<artifactId>hutool-all</artifactId>
<version>5.5.6</version>
</dependency>
</dependencies>

<build>
<plugins>
<!--该插件用于将scala代码编译成class文件 -->
<plugin>
<groupId>net.alchim31.maven</groupId>
<artifactId>scala-maven-plugin</artifactId>
<version>4.4.0</version>
<executions>
<execution>
<goals>
<goal>compile</goal>
</goals>
</execution>
</executions>
</plugin>

<!--打包用 -->
<plugin>
<groupId>org.apache.maven.plugins</groupId>
<artifactId>maven-assembly-plugin</artifactId>
<version>3.3.0</version>
<configuration>
<descriptorRefs>
<descriptiorRef>jar-with-dependencies</descriptiorRef>
</descriptorRefs>
</configuration>
<executions>
<execution>
<id>make-assembly</id>
<phase>package</phase>
<goals>
<goal>single</goal>
</goals>
</execution>
</executions>
</plugin>
</plugins>
</build>

</project>
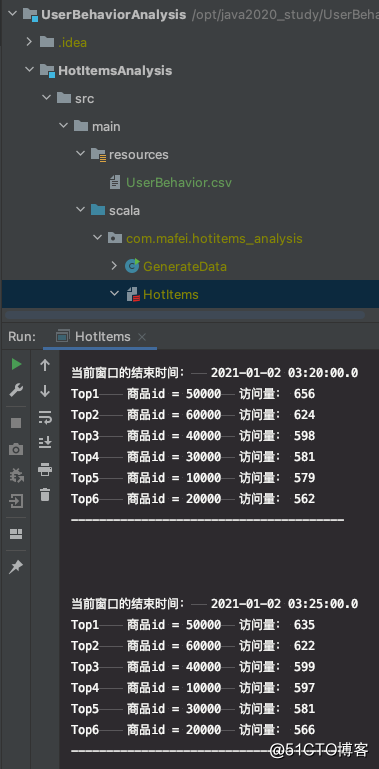
最终的项目结构:
3、开始实战
实现步骤主要包含几步:
1、从文件中读取数据
2、构建flink运行环境
3、按照商品id进行聚合,取出来每个商品一段时间的数量
4、排序取TopN,然后输出
实现代码: 在 com.mafei.hotitems_analysis下面新建一个scala的object : HotItems.scala
package com.mafei.hotitems_analysis
import org.apache.flink.api.common.functions.AggregateFunction
import org.apache.flink.api.common.state.{ListState, ListStateDescriptor}
import org.apache.flink.api.java.tuple.{Tuple, Tuple1}
import org.apache.flink.configuration.Configuration
import org.apache.flink.streaming.api.TimeCharacteristic
import org.apache.flink.streaming.api.functions.KeyedProcessFunction
import org.apache.flink.streaming.api.scala._
import org.apache.flink.streaming.api.scala.function.WindowFunction
import org.apache.flink.streaming.api.windowing.time.Time
import org.apache.flink.streaming.api.windowing.windows.TimeWindow
import org.apache.flink.util.Collector
import java.sql.Timestamp
import scala.collection.mutable.ListBuffer
//定义输入数据样例类(跟数据源的csv对应的上)
case class UserBehavior(userId: Long, itemId: Long, categoryId: Int, behavior: String, timestamp: Long )
// 定义窗口聚合结果样例类
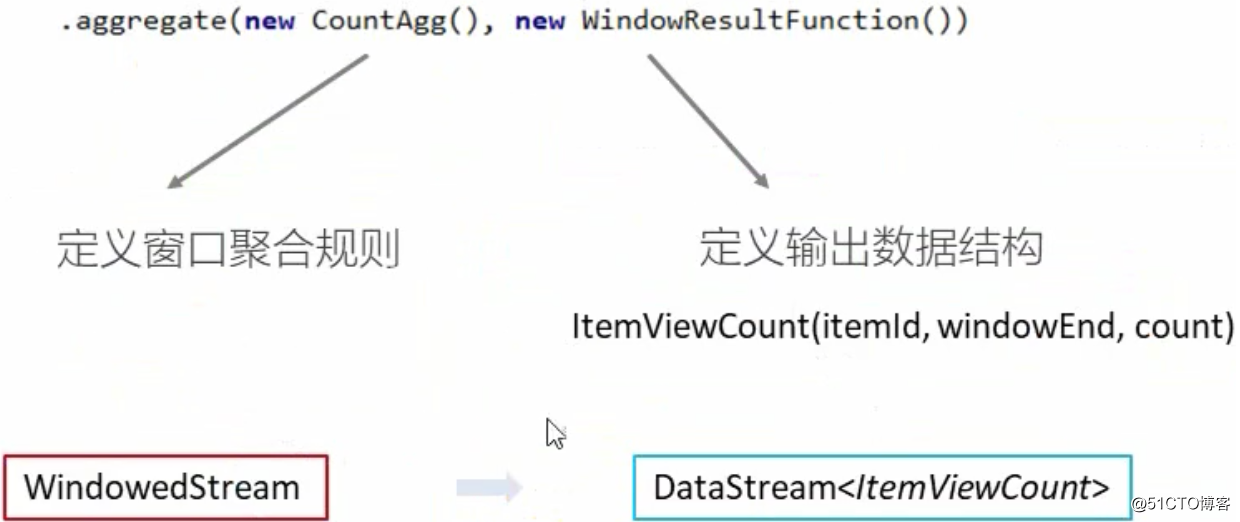
case class ItemViewCount(itemId: Long, windowEnd: Long, count: Long)
object HotItems {
def main(args: Array[String]): Unit = {
val env = StreamExecutionEnvironment.getExecutionEnvironment
env.setParallelism(1) //防止乱序
env.setStreamTimeCharacteristic(TimeCharacteristic.EventTime) //定义取事件时间
//从文件中读取数据
val inputStream = env.readTextFile("/opt/java2020_study/UserBehaviorAnalysis/HotItemsAnalysis/src/main/resources/UserBehavior.csv")
val dataStream: DataStream[UserBehavior] = inputStream
.map(data =>{ //data是读的csv每一行的数据
val arr = data.split(",") //按照,分割成list
UserBehavior(arr(0).toLong, arr(1).toLong, arr(2).toInt,arr(3),arr(4).toLong) //把对应字段塞到样例类里面
})
.assignAscendingTimestamps(_.timestamp * 1000L) //定时时间戳为事件时间,*1000转为毫秒
//进行窗口聚合,得到聚合结果
val aggStream: DataStream[ItemViewCount] = dataStream
.filter(_.behavior == "pv") //过滤出来pv行为的数据
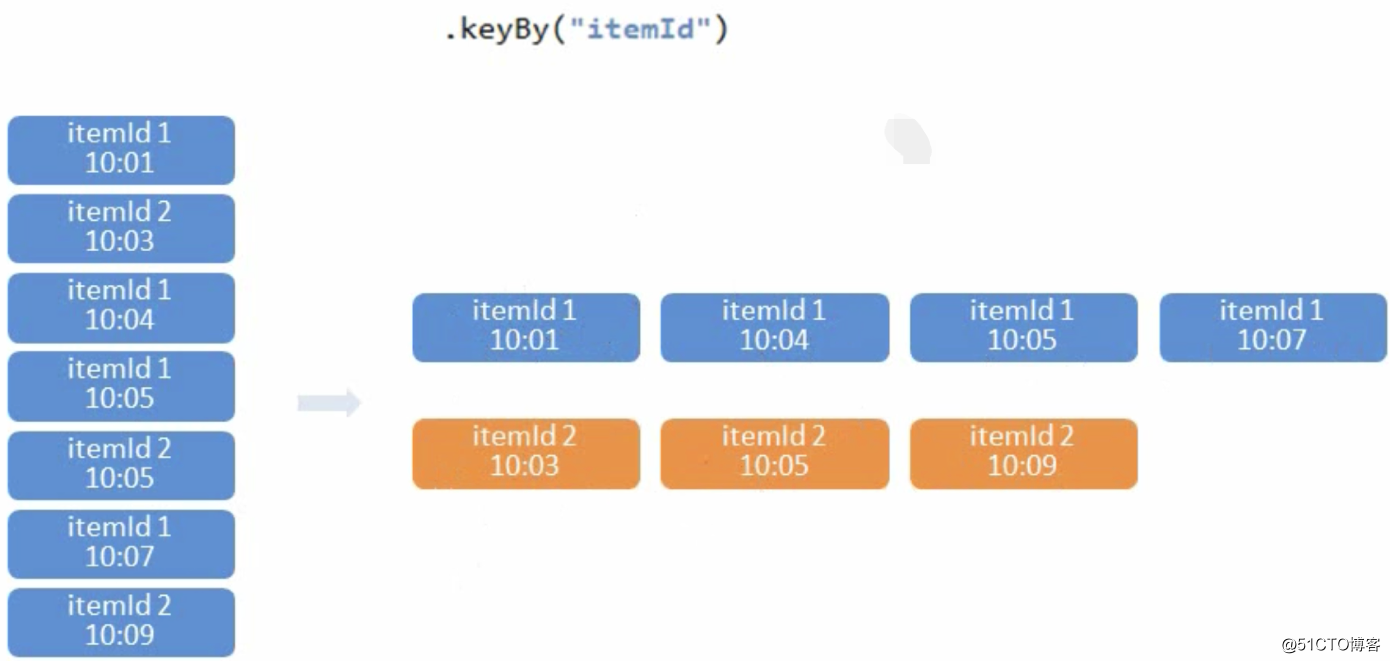
.keyBy("itemId")
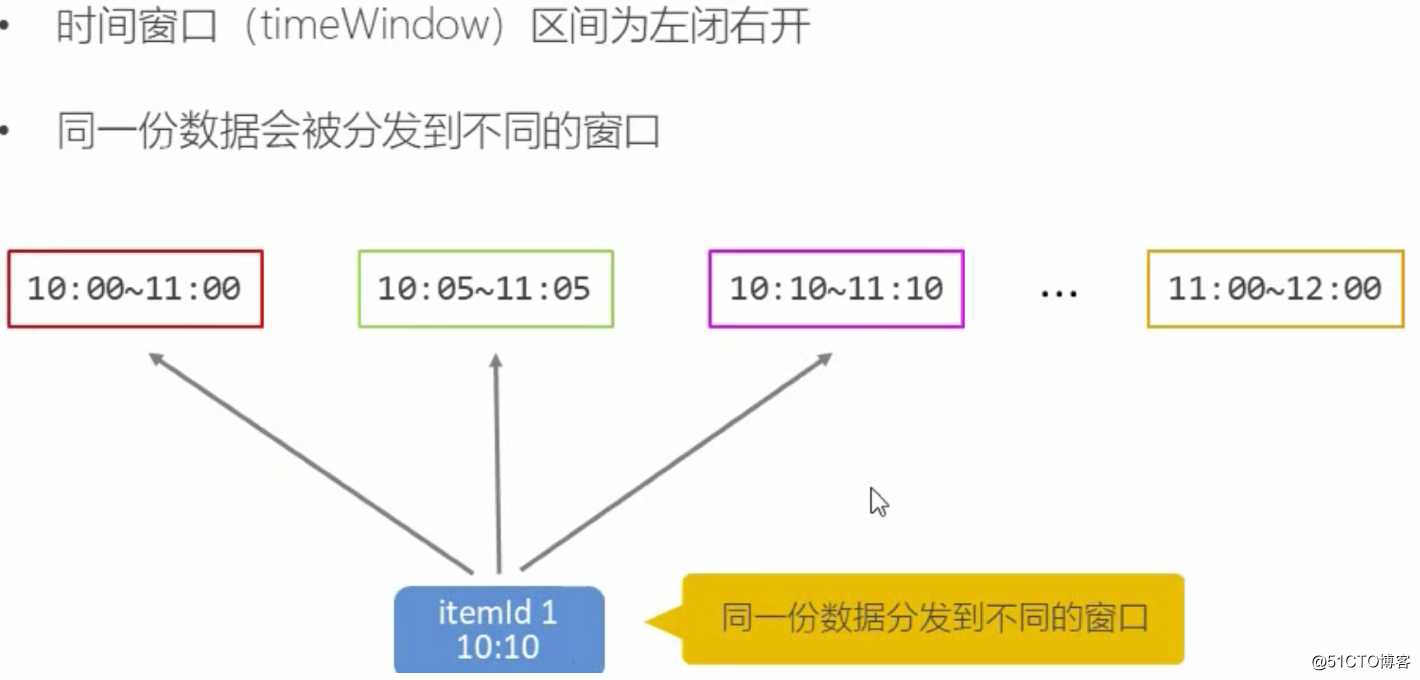
.timeWindow(Time.hours(1),Time.minutes(5)) //设置一个滑动窗口,窗口大小是1小时,每次滑动5分钟
.aggregate(new CountAgg(), new ItemViewCountWindowResult())
/**
* 需要针对每一个商品做分组,定义次数的状态,因为要做topN,所以要做排序,定义延迟触发,多久排序并输出一次
*/
val resultStream = aggStream
.keyBy("windowEnd") //按照结束时间进行分组,收集当前窗口内的,取一定时间内的数据
.process(new TopNHostItem(10))
resultStream.print()
env.execute("获取商品的访问次数")
}
}
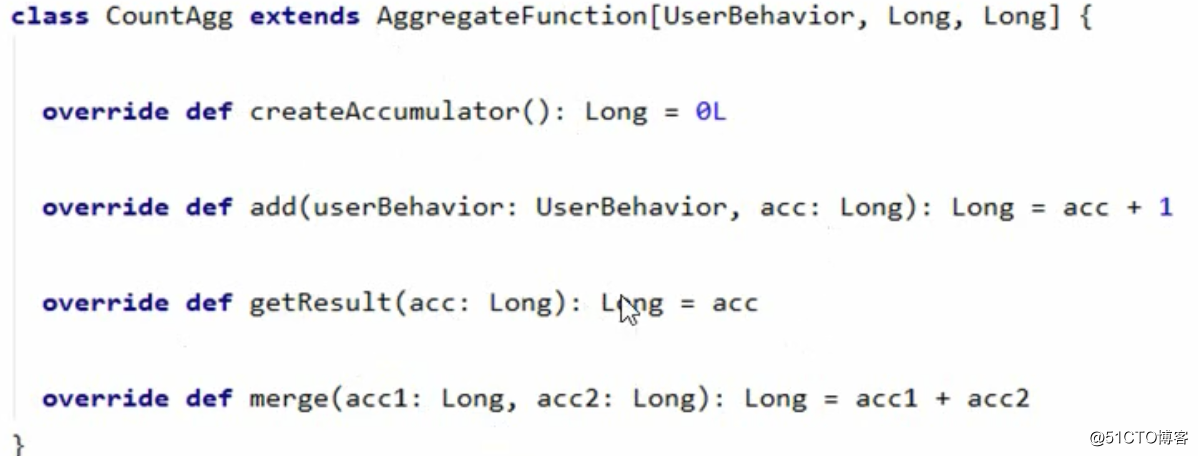
/**
* 自定义一个预聚合函数AggregateFunction
* 这里AggregateFunction 传入3个参数,
* 第一个是输入的数据类型,这个在 dataStream 中已经定义的输出的类型了
* 第二个是中间的状态,因为要计算总数,所以每次数量+1,有个值记录下,所以是Long类型的
* 第三个是最终的输出数据, 最终的数量,所以也是Long类型
*/
class CountAgg() extends AggregateFunction[UserBehavior, Long, Long]{
override def createAccumulator(): Long = 0L // 定义初始化的数据,肯定是0咯
//这里每个数据来了都会调用一次,所以直接在上一次结果上加一就可以,这个acc就是中间状态
override def add(in: UserBehavior, acc: Long): Long = acc +1
//最终输出的数据
override def getResult(acc: Long): Long = acc
//这个在session窗口中才有用,是多个状态的时候做窗口合并的时候,这里只有1个状态,直接2个相加就可以
override def merge(acc: Long, acc1: Long): Long = acc+acc1
}
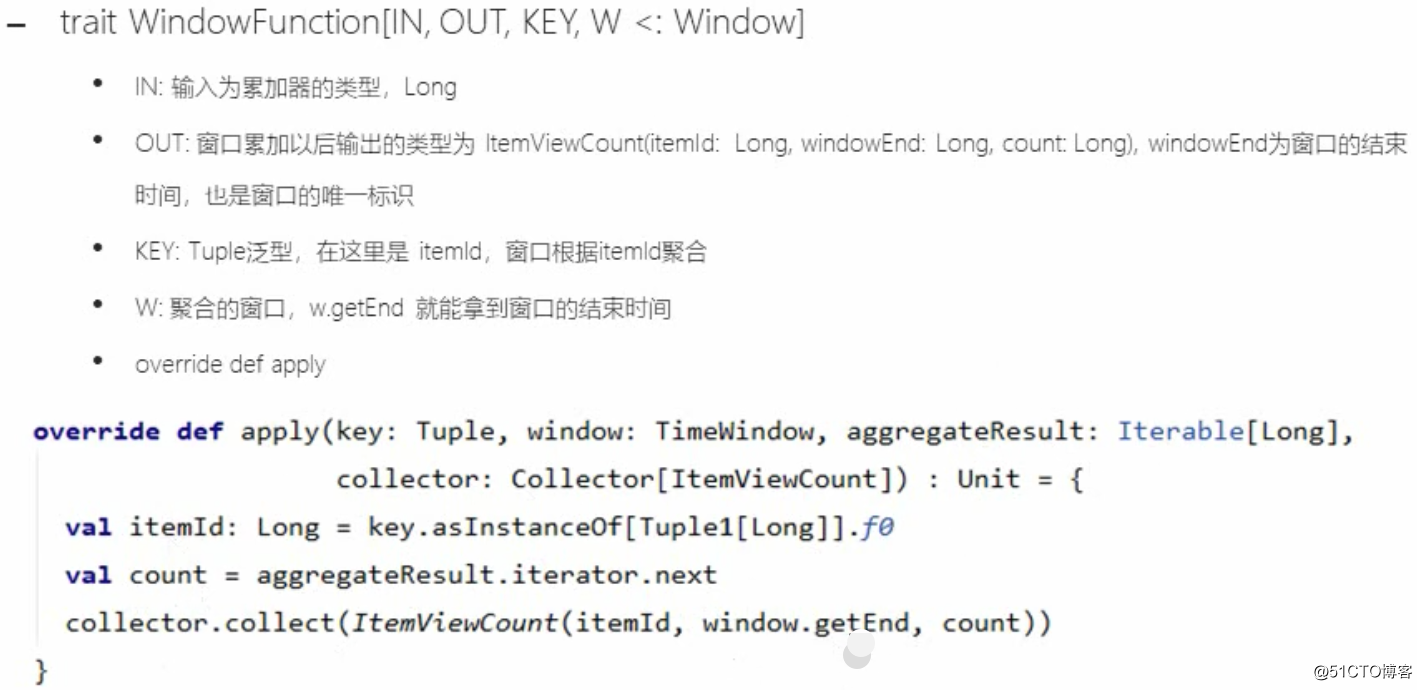
/**
* 自定义一个窗口函数windowFunction,用于生成最终我们要的数据结构
* WindowFunction 需要4个参数,分别是
* @tparam IN The type of the input value. 输入类型,也就是数量
* @tparam OUT The type of the output value. 输出类型,这个是自定义的,这里定义一个输出类,com.mafei.hotitems_analysis.ItemViewCount
* @tparam KEY The type of the key. key的类型,因为做聚合了么keyBy,因为keyBy输出的是JavaTuple类型(可以点到keyBy源码里面看下),所以需要定义类型的时候定义成Tuple
*/
class ItemViewCountWindowResult() extends WindowFunction[Long,ItemViewCount, Tuple,TimeWindow]{
override def apply(key: Tuple, window: TimeWindow, input: Iterable[Long], out: Collector[ItemViewCount]): Unit = {
val itemId = key.asInstanceOf[Tuple1[Long]].f0 //是一个一元组(只有itemId字段),所以直接这样子取
val windowEnd = window.getEnd
val count = input.iterator.next()
out.collect(ItemViewCount(itemId,windowEnd, count))
}
}
/**
*
* @param topN
*
* KeyedProcessFunction 传入3个参数
* K, I, O
* K: 排序的key字段,这里用的是windowEnd 但因为keyBy输出是JavaTuple类型,所以传的是Tuple
*/
class TopNHostItem(topN: Int) extends KeyedProcessFunction[Tuple,ItemViewCount,String]{
//先定义一个ListState,保存所有商品的count,id,ts等信息,因为要最终从这个结果里面排序截取topN个,所以得提前全部存下来才行
var itemViewCountListState: ListState[ItemViewCount] = _
override def open(parameters: Configuration): Unit = {
itemViewCountListState = getRuntimeContext.getListState(new ListStateDescriptor[ItemViewCount]("itemViewCountList", classOf[ItemViewCount]))
}
override def processElement(i: ItemViewCount, context: KeyedProcessFunction[Tuple, ItemViewCount, String]#Context, collector: Collector[String]): Unit = {
// 每来一条数据,直接追加到ListState
itemViewCountListState.add(i)
//注册一个定时器,windowEnd+1秒之后触发
context.timerService().registerEventTimeTimer(i.windowEnd + 1)
}
override def onTimer(timestamp: Long, ctx: KeyedProcessFunction[Tuple, ItemViewCount, String]#OnTimerContext, out: Collector[String]): Unit = {
//为了方便排序,定义另一个ListBuffer,保存ListState的所有数据
val allItemListBuffer: ListBuffer[ItemViewCount] = ListBuffer()
val iter = itemViewCountListState.get().iterator()
while (iter.hasNext){
allItemListBuffer += iter.next()
}
//清空ListState的数据,已经放到allItemListBuffer 准备计算了,等下次触发就应该是新的了
itemViewCountListState.clear()
// 先按照count,从大到小排序,然后再取前N个
val sortItemViewCounts = allItemListBuffer.sortBy(_.count)(Ordering.Long.reverse).take(topN)
//格式化输出数据:
val result : StringBuilder = new StringBuilder
result.append("当前窗口的结束时间:\t").append(new Timestamp(timestamp -1)).append("\n")
//遍历结果列表中的每个ItemViewCount , 输出到一行
for(i <- sortItemViewCounts.indices){
val currentItemViewCount = sortItemViewCounts(i)
result.append("Top").append(i+1).append("\t")
.append("商品id = ").append(currentItemViewCount.itemId).append("\t")
.append("访问量: ").append(currentItemViewCount.count).append("\n")
}
result.append("---------------------------------------\n\n\n")
Thread.sleep(1000)
out.collect(result.toString())
}
}
UserBehavior.csv 的内容:
1,40000,12306,pv,1609512713
5,30000,12306,pv,1609512714
4,50000,12306,pv,1609512715
2,20000,12306,pv,1609512716
运行效果和代码结构:
在开发的时候UserBehavior.csv 如果想看效果,最好还是多准备点数据,否则一行一行的手敲有点麻烦,我写了个java脚本,GenerateData.java 运行完,就能给UserBehavior.csv模拟写入10万条数据做测试了
/*
@author mafei
* @date 2021/1/1
*/
package com.mafei.hotitems_analysis;

import cn.hutool.core.io.file.FileWriter;
import cn.hutool.core.util.RandomUtil;

import java.time.LocalDateTime;
import java.time.ZoneOffset;

public class GenerateData {
public static void main(String[] args) {
String csvPath = "/opt/java2020_study/UserBehaviorAnalysis/HotItemsAnalysis/src/main/resources/UserBehavior.csv";
Integer[] userId= new Integer[]{1,2,3,4,5,9};
Integer[] itemId= new Integer[]{10000,20000,30000,40000,50000,60000};
int categoryId = 12306;
StringBuffer content = new StringBuffer();
Long second = LocalDateTime.now().toEpochSecond(ZoneOffset.of("+8"));

for (int i = 0; i < 100000; i++) {
content.append(RandomUtil.randomEle(userId)).append(",")
.append(RandomUtil.randomEle(itemId)).append(",")
.append(categoryId).append(",pv,").append(second + i).append("\n");
}
FileWriter writer = new FileWriter(csvPath);
writer.write(content.toString());
}
}
从kakfa中读取数据
也是一样,只需要把从csv改成读kafka就可以
//1、从文件中读取数据
//    val inputStream = env.readTextFile("/opt/java2020_study/UserBehaviorAnalysis/HotItemsAnalysis/src/main/resources/UserBehavior.csv")

//2、从kafka中读取数据
val properties = new Properties()

properties.setProperty("bootstrap.servers", "127.0.0.1:9092")
properties.setProperty("group.id", "consumer-group")
properties.setProperty("auto.offset.reset", "latest")
val inputStream = env.addSource(new FlinkKafkaConsumer[String]("hotItems",new SimpleStringSchema(), properties))
//把kafka中的数据打印出来,看下具体的值
inputStream.print()
关于kafka安装部署可以参考之前的文章,找个centos虚拟机 https://www.geek-share.com/detail/2705863965.html
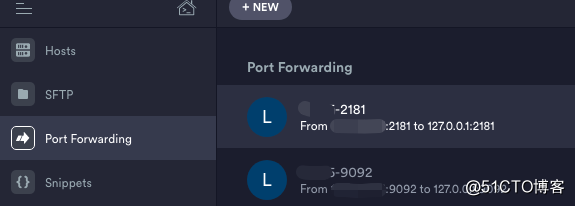
很多情况下不想改配置文件里监听端口,又想直接连服务器上的端口,推荐使用端口转发,把服务器端口转到127.0.0.1就可以,像xshell,terminus等等这些工具都有这个功能
实现思路图解:
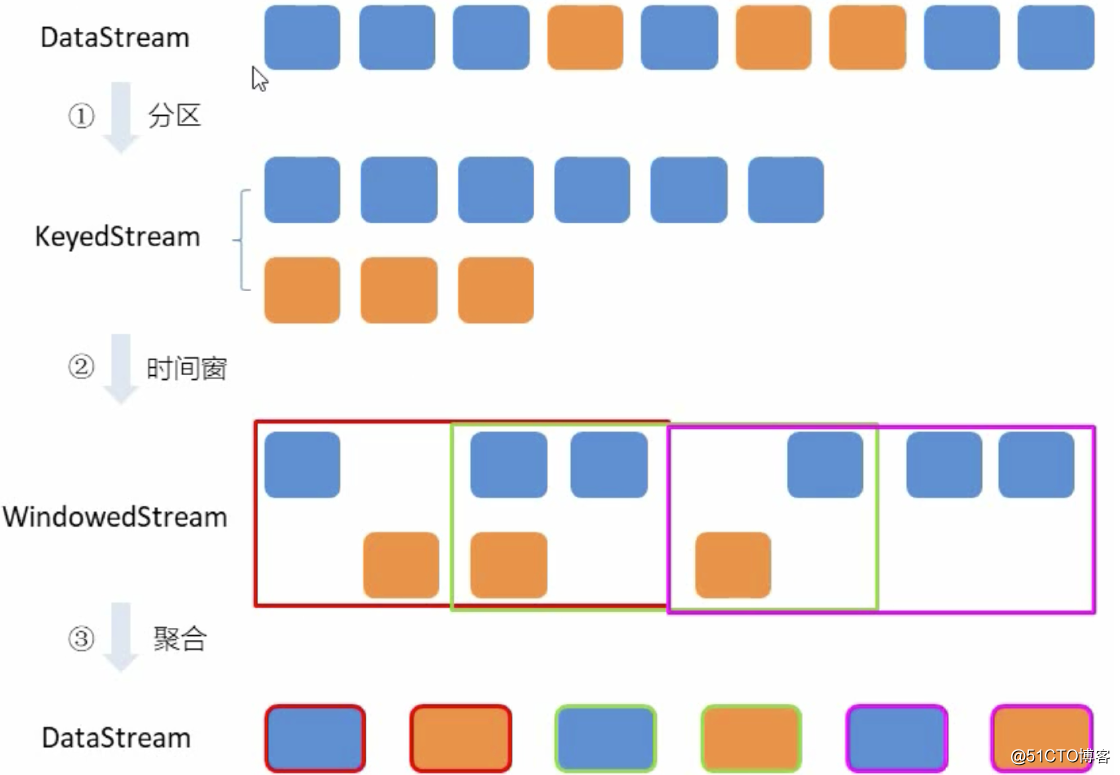
设置时间窗口
再做窗口聚合
窗口聚合策略--每出现一次就加一
累加规则---窗口内  碰到一条数据就加一(add方法)
实现AggregateFunction接口
Interface AggregateFunction<IN,ACC,OUT>

实现输出结构----itemViewCount(itemid,windowEnd,count)
实现WindowFunction接口
进行统计整理输出----keyBy("windowEnd")
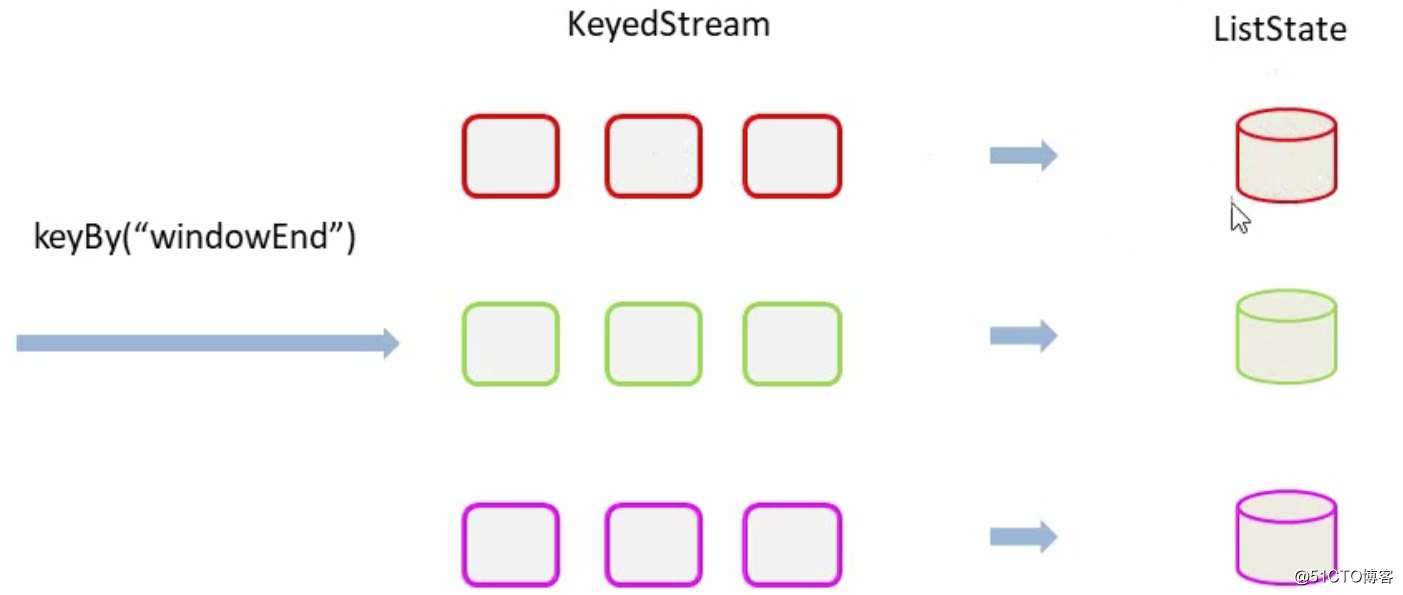
最终输出排序----keydProcessFunction
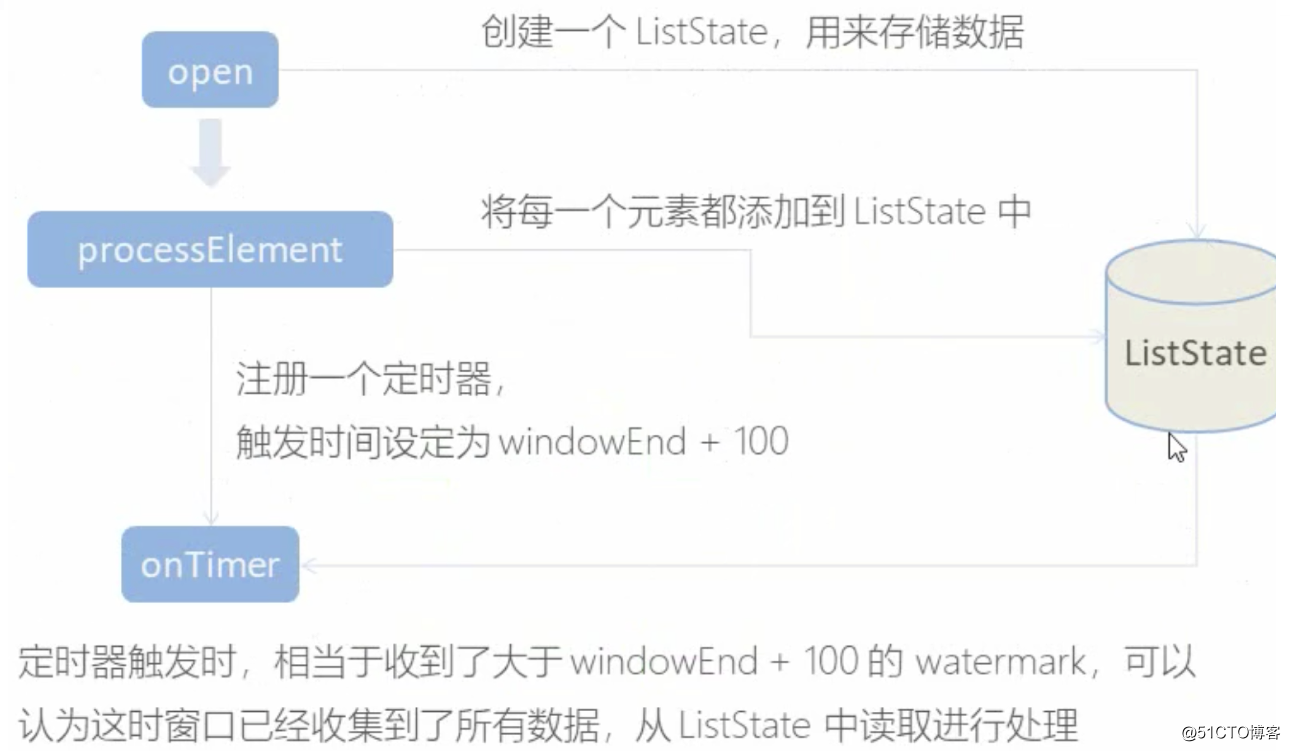
-针对有状态流的底层api
1.-keydProcessFunction会对分区后的每一个子流进程处理
2.- 以windowEnd作为key,保证分流后每一条流都在一个时间窗口内
3.-从ListState中读取当前流的状态,存储数据进行输出
用ProcessFunction来定义KeyedStream的处理逻辑
分区之后每隔KeyedStream都有自己的生命周期
1.  -open,初始化,从这里可以获取当前流状态
2.  -processElement,处理流中每个元素时调用
3.  -onTimer: 定时调用,注册定时器Timer并触发之后的回调操作

相关文章推荐
- Kafka实战-实时日志统计流程
- Flink 零基础实战教程:如何计算实时热门商品
- Kafka项目实战-用户日志上报实时统计之应用概述
- Kafka项目实战-用户日志上报实时统计之编码实践
- Kafka项目实战-用户日志上报实时统计之应用概述
- Kafka项目实战-用户日志上报实时统计之分析与设计
- [Scala] Flink项目实时热门商品统计(一)
- 热门商品和读取本地文件由kafka发送数据
- Kafka项目实战-用户日志上报实时统计之分析与设计
- Kafka项目实战-用户日志上报实时统计之编码实践
- 使用Flume采集流式数据发送到Kafka,再由Flink消费Kafka数据,实现电话号码统计本地文件读取
- Kafka实战-实时日志统计流程
- Kafka实战-实时日志统计流程
- Flink 零基础实战教程:如何计算实时热门商品
- Kafka项目实战-用户日志上报实时统计之分析与设计
- Flink 零基础实战教程:如何计算实时热门商品
- Flink之实时统计指定时间段内热门商品的TopN(双11一小时内的热门品牌排行榜)
- kafka + spark streaming 实时读取计算 nginx 日志,存储结果到 mongodb/mysql
- flume+kafka读取日志文件
- 监听器监听日志,实时读取日志文件,把读取到的数据入库