ELK7日志分析系统基础(二)
ELK7日志分析系统基础(二)
版本区别
- ELK6: 默认对外开放访问,需要xpack之类的插件才能开启认证
- ELK7: 默认开启安全验证功能
基本环境需求
- centos7 关闭防火墙
- 关闭selinux
- 时间同步
- 磁盘分区
curl -o /etc/yum.repos.d/CentOS-Base.repo https://mirrors.aliyun.com/repo/Centos-7.repo
wget -O /etc/yum.repos.d/epel.repo http://mirrors.aliyun.com/repo/epel-7.repo
yum -y install java-1.8.0-openjdk java-1.8.0-openjdk-devel ntpdate
ntpdate time.windows.com
- java环境安装
- 下载地址: https://www.oracle.com/java/technologies/javase/javase-jdk8-downloads.html
- yum安装: yum -y install java-1.8.0-openjdk java-1.8.0-openjdk-devel
- java环境的验证: java -version
- ELK下载准备
https://www.elastic.co/guide/en/elasticsearch/reference/7.6/index.html
ELK7的基础概念
- Elasticsearch: 搜索数据库服务器,提供restful web接口,简称ES
- Logstash:数据采集和过滤分析以及字段提取
- kibana: 主要是页面展示,ES操作简化等
ElasticSearch集群部署与使用实战
ES数据库单节点部署
官方安装文档参考: https://www.elastic.co/guide/en/elasticsearch/reference/7.6/install-elasticsearch.html
- 基础环境准备好
- elasticsearch rpm下载与安装
[root@centos7-node1 ~]# wget https://artifacts.elastic.co/downloads/elasticsearch/elasticsearch-7.6.2-x86_64.rpm
[root@centos7-node1 ~]# yum -y localinstall elasticsearch-7.6.2-x86_64.rpm
- jvm配置文件修改(默认要填写本机内存的60%)
[root@centos7-node1 ~]# vim /etc/elasticsearch/jvm.options
-Xms200M
-Xmx200M
- ES单实例配置与启动(特别要注意)
[root@centos7-node1 ~]# cp /etc/elasticsearch/elasticsearch.yml /usr/local/src/
[root@centos7-node1 ~]# vim /etc/elasticsearch/elasticsearch.yml
path.data: /var/lib/elasticsearch
path.logs: /var/log/elasticsearch
network.host: 192.168.56.11
http.port: 9200
xpack.security.enabled: true
discovery.type: single-node

[root@centos7-node1 ~]# systemctl restart elasticsearch  # 服务启动
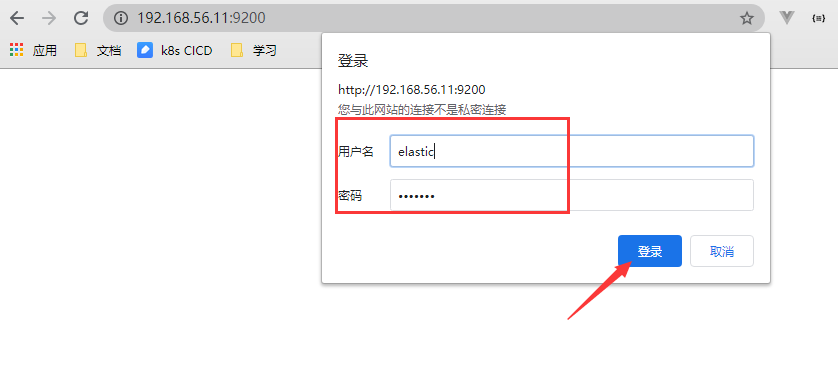
- 访问(需要密码)
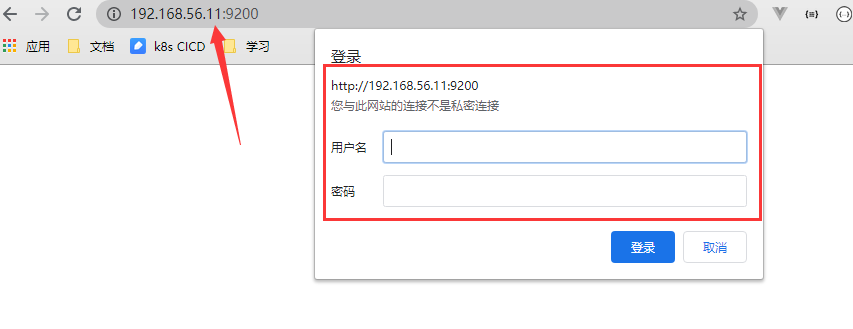
- 设置密码(试验环境: elastic)
[root@centos7-node1 ~]# /usr/share/elasticsearch/bin/elasticsearch-setup-passwords interactive
Enter password for [elastic]:    elastic
Reenter password for [elastic]:
Enter password for [apm_system]:
Reenter password for [apm_system]:
Enter password for [kibana]:
Reenter password for [kibana]:
Enter password for [logstash_system]:
Reenter password for [logstash_system]:
Enter password for [beats_system]:
Reenter password for [beats_system]:
Enter password for [remote_monitoring_user]:
Reenter password for [remote_monitoring_user]:
Changed password for user [apm_system]
Changed password for user [kibana]
Changed password for user [logstash_system]
Changed password for user [beats_system]
Changed password for user [remote_monitoring_user]
Changed password for user [elastic]
- 访问
- 验证是否启动成功
[root@centos7-node1 ~]# curl -u elastic:elastic http://192.168.56.11:9200
{
"name" : "centos7-node1",
"cluster_name" : "elasticsearch",
"cluster_uuid" : "WUehKqv3TyudTo_IKMNNlA",
"version" : {
"number" : "7.6.2",
"build_flavor" : "default",
"build_type" : "rpm",
"build_hash" : "ef48eb35cf30adf4db14086e8aabd07ef6fb113f",
"build_date" : "2020-03-26T06:34:37.794943Z",
"build_snapshot" : false,
"lucene_version" : "8.4.0",
"minimum_wire_compatibility_version" : "6.8.0",
"minimum_index_compatibility_version" : "6.0.0-beta1"
},
"tagline" : "You Know, for Search"
}

[root@centos7-node1 ~]# curl -u elastic:elastic http://192.168.56.11:9200/_cat/nodes?v    #查看节点信息
ip            heap.percent ram.percent cpu load_1m load_5m load_15m node.role master name
192.168.56.11           56          89   0    0.00    0.01     0.05 dilm      *      centos7-node1

[root@centos7-node1 ~]# curl -u elastic:elastic http://192.168.56.11:9200/_cat/indices?v    #列出索引信息
health status index       uuid                   pri rep docs.count docs.deleted store.size pri.store.size
green  open   .security-7 ByCOlBeLSfStcZVe8Ne0-Q   1   0          6            0     19.6kb         19.6kb
- 写入数据
[root@centos7-node1 ~]# curl -u elastic:elastic -X POST http://192.168.56.11:9200/test-index/_doc -H 'Content-Type:application/json' -d '{"name": "test-data1","age": 20}'     #插入数据
{"_index":"test-index","_type":"_doc","_id":"1Ip3xnUB0a1lyJIOfMTO","_version":1,"result":"created","_shards":{"total":2,"successful":1,"failed":0},"_seq_no":0,"_primary_term":1}
- 查看数据
[root@centos7-node1 ~]# curl -u elastic:elastic http://192.168.56.11:9200/test-index/_search?q=* | python -m json.tool    #查看数据
% Total    % Received % Xferd  Average Speed   Time    Time     Time  Current
Dload  Upload   Total   Spent    Left  Speed
100   284  100   284    0     0   2273      0 --:--:-- --:--:-- --:--:--  2290
{
"_shards": {
"failed": 0,
"skipped": 0,
"successful": 1,
"total": 1
},
"hits": {
"hits": [
{
"_id": "1Ip3xnUB0a1lyJIOfMTO",
"_index": "test-index",
"_score": 1.0,
"_source": {
"age": 20,
"name": "test-data1"
},
"_type": "_doc"
}
],
"max_score": 1.0,
"total": {
"relation": "eq",
"value": 1
}
},
"timed_out": false,
"took": 104
}
ES数据库加密集群部署
ES的分布式集群
索引的分片可以把数据分配到不同节点上
每个分片可设置值0个或者多个副本
副本的功能: 备份,提高查询效率,与集群中任何一个节点的通信结果都是一致的
ES分布式集群的部署
- 部署节点信息
| 主机名 | ip | 软件 |
|---|---|---|
| centos7-node1 | 192.168.56.11 | java-1.8.0-openjdk java-1.8.0-openjdk-devel elasticsearch7.6 |
| centos7-node2 | 192.168.56.12 | java-1.8.0-openjdk java-1.8.0-openjdk-devel elasticsearch7.6 |
| centos7-node3 | 192.168.56.13 | java-1.8.0-openjdk java-1.8.0-openjdk-devel elasticsearch7.6 |
- 软件和基础环境的问题参考第一小节
curl -o /etc/yum.repos.d/CentOS-Base.repo https://mirrors.aliyun.com/repo/Centos-7.repo
wget -O /etc/yum.repos.d/epel.repo http://mirrors.aliyun.com/repo/epel-7.repo
yum -y install java-1.8.0-openjdk java-1.8.0-openjdk-devel
wget https://artifacts.elastic.co/downloads/elasticsearch/elasticsearch-7.6.2-x86_64.rpm
yum -y localinstall elasticsearch-7.6.2-x86_64.rpm
- 置(所有节点)
[root@centos7-node1 ~]# vim /etc/elasticsearch/jvm.options
-Xms200M
-Xmx200M
ES加密集群
- 创建集群交互证书
[root@centos7-node1 ~]# /usr/share/elasticsearch/bin/elasticsearch-certutil ca    #直接回车两次即可
[root@centos7-node1 ~]# /usr/share/elasticsearch/bin/elasticsearch-certutil cert --ca /usr/share/elasticsearch/elastic-stack-ca.p12    #直接回车三次即可
- 拷贝证书(拷贝到每台es服务器上)
[root@centos7-node1 ~]# cp /usr/share/elasticsearch/elastic-certificates.p12 /etc/elasticsearch/elastic-certificates.p12

# scp 发送证书到其余两个节点上

[root@centos7-node1 ~]# scp /usr/share/elasticsearch/elastic-certificates.p12 192.168.56.12:/etc/elasticsearch/elastic-certificates.p12
[root@centos7-node1 ~]# scp /usr/share/elasticsearch/elastic-certificates.p12 192.168.56.13:/etc/elasticsearch/elastic-certificates.p12
- 修改证书权限(三个节点都需要修改)
[root@centos7-node1 ~]# chown elasticsearch:elasticsearch /etc/elasticsearch/elastic-certificates.p12

[root@centos7-node1 ~]# ssh 192.168.56.12 "chown elasticsearch:elasticsearch /etc/elasticsearch/elastic-certificates.p12"

[root@centos7-node1 ~]# ssh 192.168.56.13 "chown elasticsearch:elasticsearch /etc/elasticsearch/elastic-certificates.p12"
- elasticsearch配置
其中node.master用来做数据汇聚
其中node.data是用来做数据存储和查询,压力相对比较大,生产建议将master和data做分离
###### centos7-node1配置文件
[root@centos7-node1 ~]# vim /etc/elasticsearch/elasticsearch.yml
cluster.name: cropy
node.name: node1
node.master: true
node.data: true
path.data: /var/lib/elasticsearch
path.logs: /var/log/elasticsearch
network.host: 192.168.56.11
http.port: 9200
discovery.seed_hosts: ["192.168.56.11","192.168.56.12","192.168.56.13"]
cluster.initial_master_nodes: ["192.168.56.11","192.168.56.12","192.168.56.13"]
xpack.security.enabled: true
xpack.monitoring.enabled: true
xpack.security.transport.ssl.enabled: true
xpack.security.transport.ssl.verification_mode: certificate
xpack.security.transport.ssl.keystore.path: /etc/elasticsearch/elastic-certificates.p12
xpack.security.transport.ssl.truststore.path: /etc/elasticsearch/elastic-certificates.p12

###### centos7-node2配置文件
[root@centos7-node2 ~]# vim /etc/elasticsearch/elasticsearch.yml
cluster.name: cropy
node.name: node2
node.master: true
node.data: true
path.data: /var/lib/elasticsearch
path.logs: /var/log/elasticsearch
network.host: 192.168.56.12
http.port: 9200
discovery.seed_hosts: ["192.168.56.11","192.168.56.12","192.168.56.13"]
cluster.initial_master_nodes: ["192.168.56.11","192.168.56.12","192.168.56.13"]
xpack.security.enabled: true
xpack.monitoring.enabled: true
xpack.security.transport.ssl.enabled: true
xpack.security.transport.ssl.verification_mode: certificate
xpack.security.transport.ssl.keystore.path: /etc/elasticsearch/elastic-certificates.p12
xpack.security.transport.ssl.truststore.path: /etc/elasticsearch/elastic-certificates.p12

###### centos7-node3配置文件
[root@centos7-node31 ~]# vim /etc/elasticsearch/elasticsearch.yml
cluster.name: cropy
node.name: node3
node.master: true
node.data: true
path.data: /var/lib/elasticsearch
path.logs: /var/log/elasticsearch
network.host: 192.168.56.13
http.port: 9200
discovery.seed_hosts: ["192.168.56.11","192.168.56.12","192.168.56.13"]
cluster.initial_master_nodes: ["192.168.56.11","192.168.56.12","192.168.56.13"]
xpack.security.enabled: true
xpack.monitoring.enabled: true
xpack.security.transport.ssl.enabled: true
xpack.security.transport.ssl.verification_mode: certificate
xpack.security.transport.ssl.keystore.path: /etc/elasticsearch/elastic-certificates.p12
xpack.security.transport.ssl.truststore.path: /etc/elasticsearch/elastic-certificates.p12
- 启动服务
[root@centos7-node1 ~]# systemctl enable elasticsearch && systemctl restart elasticsearch
[root@centos7-node1 ~]# tail -f /var/log/elasticsearch/cropy.log    #集群日志查看(最后会有Yello状态)
........
[2020-11-14T21:39:53,107][INFO ][o.e.c.r.a.AllocationService] [node1] Cluster health status changed from [RED] to [YELLOW] (reason: [shards started [[.security-7][0]]]).

[root@centos7-node2 ~]# systemctl enable elasticsearch && systemctl restart elasticsearch
[root@centos7-node3 ~]# systemctl enable elasticsearch && systemctl restart elasticsearch
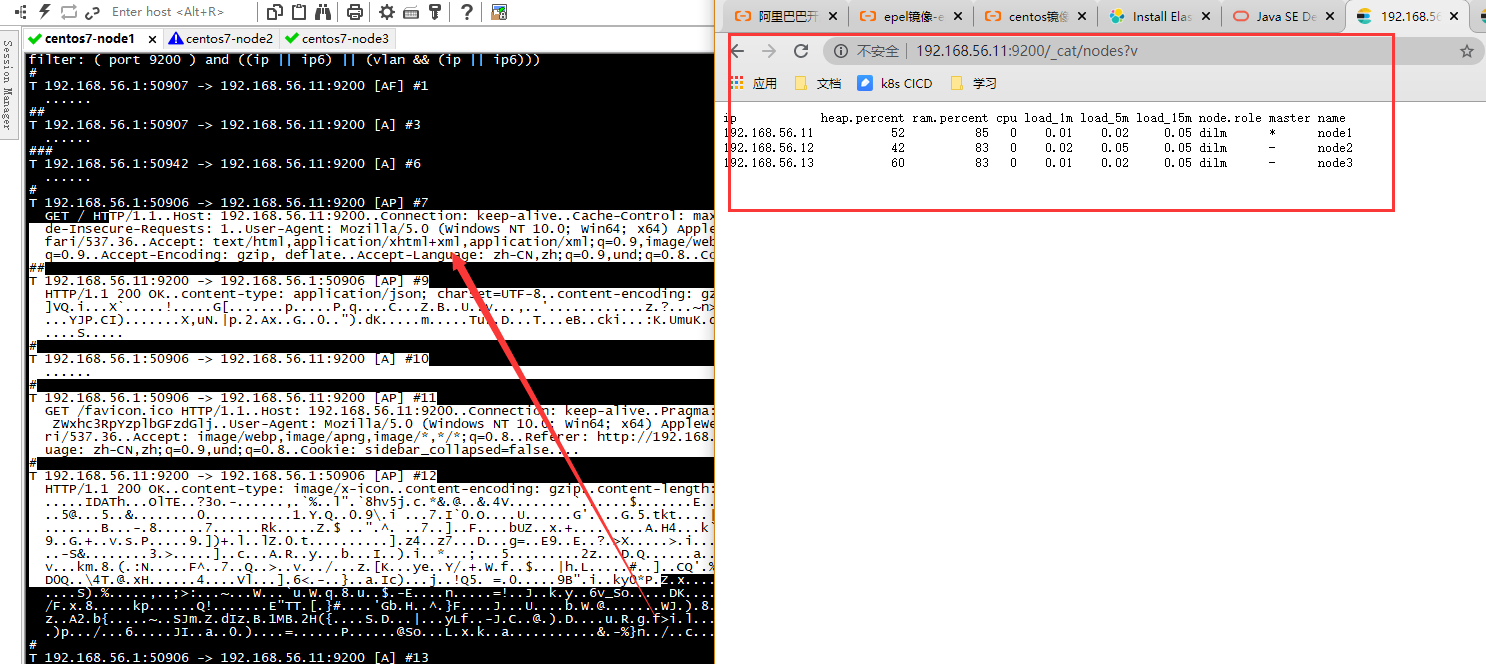
- 状态查询
systemctl status elasticsearch
ps -ef | grep elasticsearch
netstat -tanlp | grep 9200
[root@centos7-node1 ~]# curl -u elastic:elastic http://192.168.56.11:9200/_cat/nodes?v
ip            heap.percent ram.percent cpu load_1m load_5m load_15m node.role master name
192.168.56.11           60          92   1    0.00    0.01     0.05 dilm      *      node1
192.168.56.12           45          93   1    0.00    0.01     0.05 dilm      -      node2
192.168.56.13           60          94   1    0.05    0.03     0.05 dilm      -      node3

[root@centos7-node1 ~]# curl -u elastic:elastic http://192.168.56.11:9200/_cat/indices?v
- 重要事项
ES集群开启xpack的时候只要有一个节点设置密码即可,否则不能访问
/usr/share/elasticsearch/bin/elasticsearch-setup-passwords interactive #参考命令
ES集群安全交互抓包
- 需要安装软件(集群所有节点)
yum -y install ngrep tcpdump
- 测试
[root@centos7-node1 ~]# ngrep -d ens33 port 9200
\interface: ens33 (192.168.56.0/255.255.255.0)
filter: ( port 9200 ) and ((ip || ip6) || (vlan && (ip || ip6)))
#
T 192.168.56.1:50907 -> 192.168.56.11:9200 [AF] #1
......
##
T 192.168.56.1:50907 -> 192.168.56.11:9200 [A] #3
......
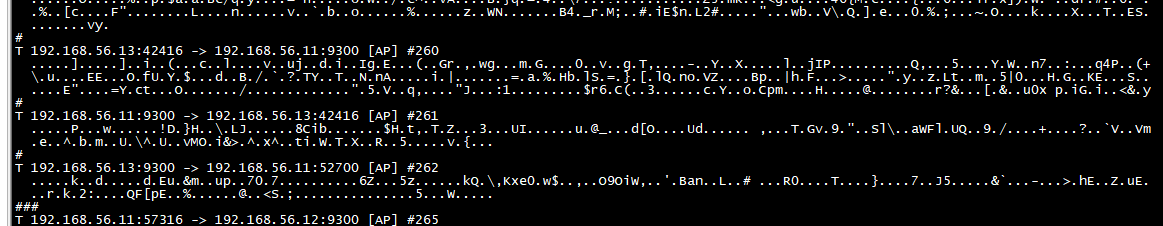
9300端口测试结果
[root@centos7-node1 ~]# ngrep -d ens33 port 9300
ES数据库的基础操作
ES概念
- 索引: 类似于数据库,索引在写入数据时会自动创建,可按天
- 文档: 类似于表数据,存储在ES里面的数据
ES的基础操作
- curl的方式: 相对比较麻烦
### 写入指定ID数据(1 是id)
[root@centos7-node1 ~]# curl -u elastic:elastic -X PUT http://192.168.56.11:9200/test-index/_doc/1 -H 'Content-Type: application/json' -d '{"name":"zhangsan","age":30}'
### 查询数据
[root@centos7-node1 ~]# curl -u elastic:elastic http://192.168.56.13:9200/test-index/_search?q=*
[root@centos7-node1 ~]# curl -u elastic:elastic http://192.168.56.13:9200/test-index/_doc/1

### 写入随机ID数据(_doc/ 之后不添加id)
[root@centos7-node1 ~]# curl -u elastic:elastic -X POST http://192.168.56.11:9200/test-index/_doc -H 'Content-Type: application/json' -d '{"name":"lisi","age":33}'

### 更新数据(id 为1 的数据更新)
[root@centos7-node1 ~]# curl -u elastic:elastic -X POST  http://192.168.56.11:9200/test-index/_update/1  -H 'Content-Type: application/json' -d '{"age":100}'

### 删除数据
[root@centos7-node1 ~]# curl -u elastic:elastic -X DELETE http://192.168.56.11:9200/test-index/_doc/1     #删除单条数据
[root@centos7-node1 ~]# curl -u elastic:elastic -X DELETE http://192.168.56.11:9200/test-index      #删除所有数据

### 测试集群数据同步
[root@centos7-node1 ~]# curl  -u elastic:elastic -X POST http://192.168.56.12:9200/test-index/_doc -H 'Content-Type: application/json' -d '{"name": "wanghui", "age": 29}'
- kibana: 提供简化的操作界面
Kibana的部署与使用实战
Kibana用于做数据展示,es的操作简化
Kibana的安装与配置
- 找其中的一台ES节点做安装
[root@centos7-node1 ~]# wget https://artifacts.elastic.co/downloads/kibana/kibana-7.6.2-x86_64.rpm
[root@centos7-node1 ~]# yum -y localinstall kibana-7.6.2-x86_64.rpm
- 配置kibana
[root@centos7-node1 ~]# cp /etc/kibana/kibana.yml /usr/local/src/
[root@centos7-node1 ~]# vim /etc/kibana/kibana.yml
server.port: 5601
server.host: "192.168.56.11"
elasticsearch.hosts: ["http://192.168.56.11:9200","http://192.168.56.12:9200","http://192.168.56.13:9200"]
elasticsearch.username: "elastic"
elasticsearch.password: "elastic"
logging.dest: "/tmp/kibaba.log"
- 启动kibana
[root@centos7-node1 ~]# systemctl start kibana && systemctl enable kibana
[root@centos7-node1 ~]# tail -f /tmp/kibaba.log    #启动日志查看
....
{"type":"log","@timestamp":"2020-11-14T15:07:29Z","tags":["listening","info"],"pid":13907,"message":"Server running at http://192.168.56.11:5601"}
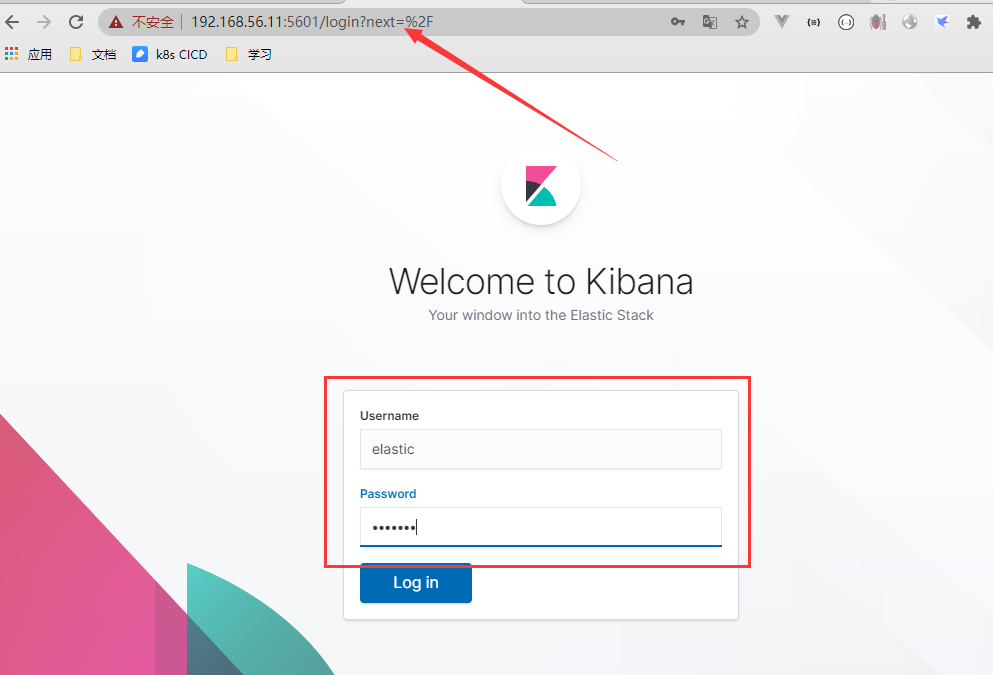
-
访问kibana
用户密码都是elastic (之前es部署的时候添加的)
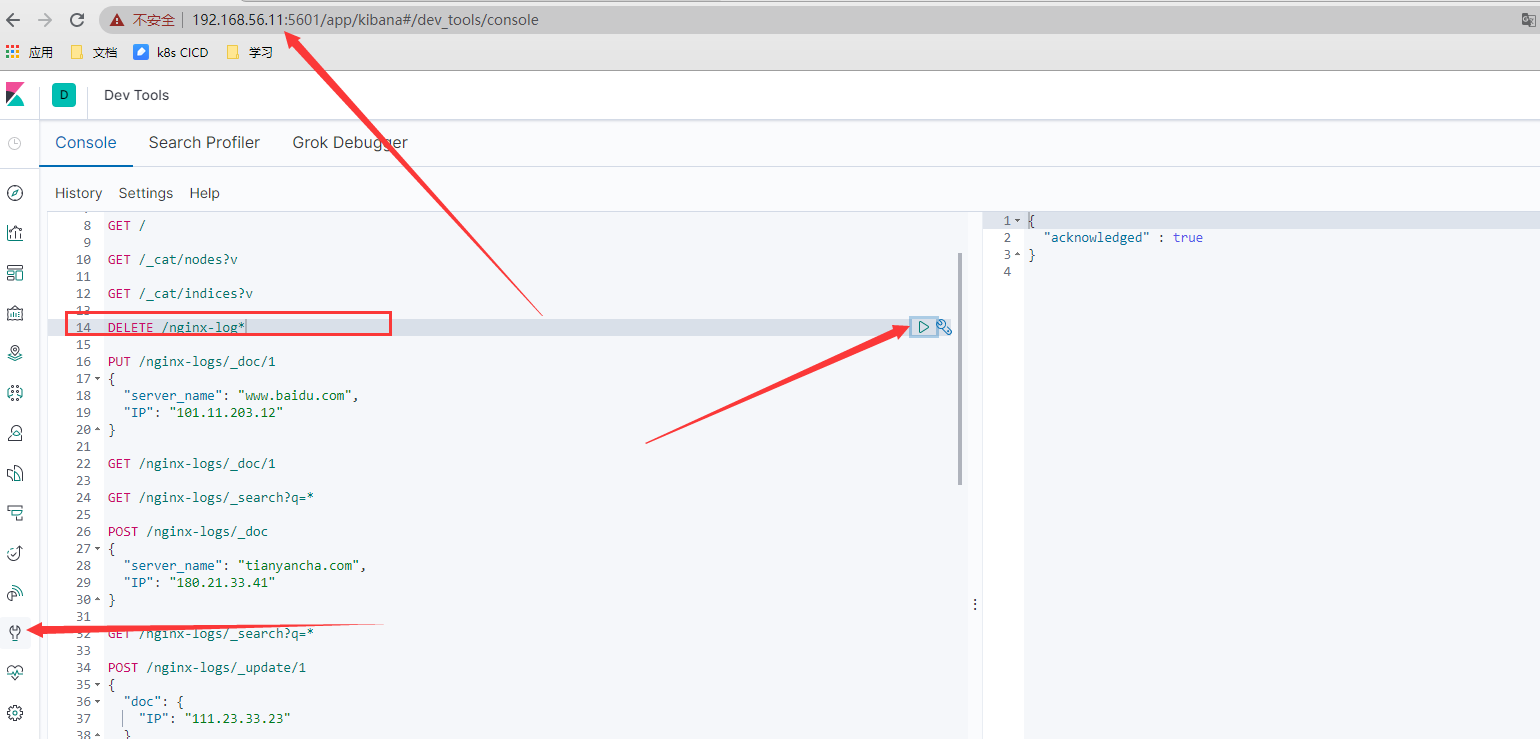
Kibana简化ES数据库的操作
- 简单查询
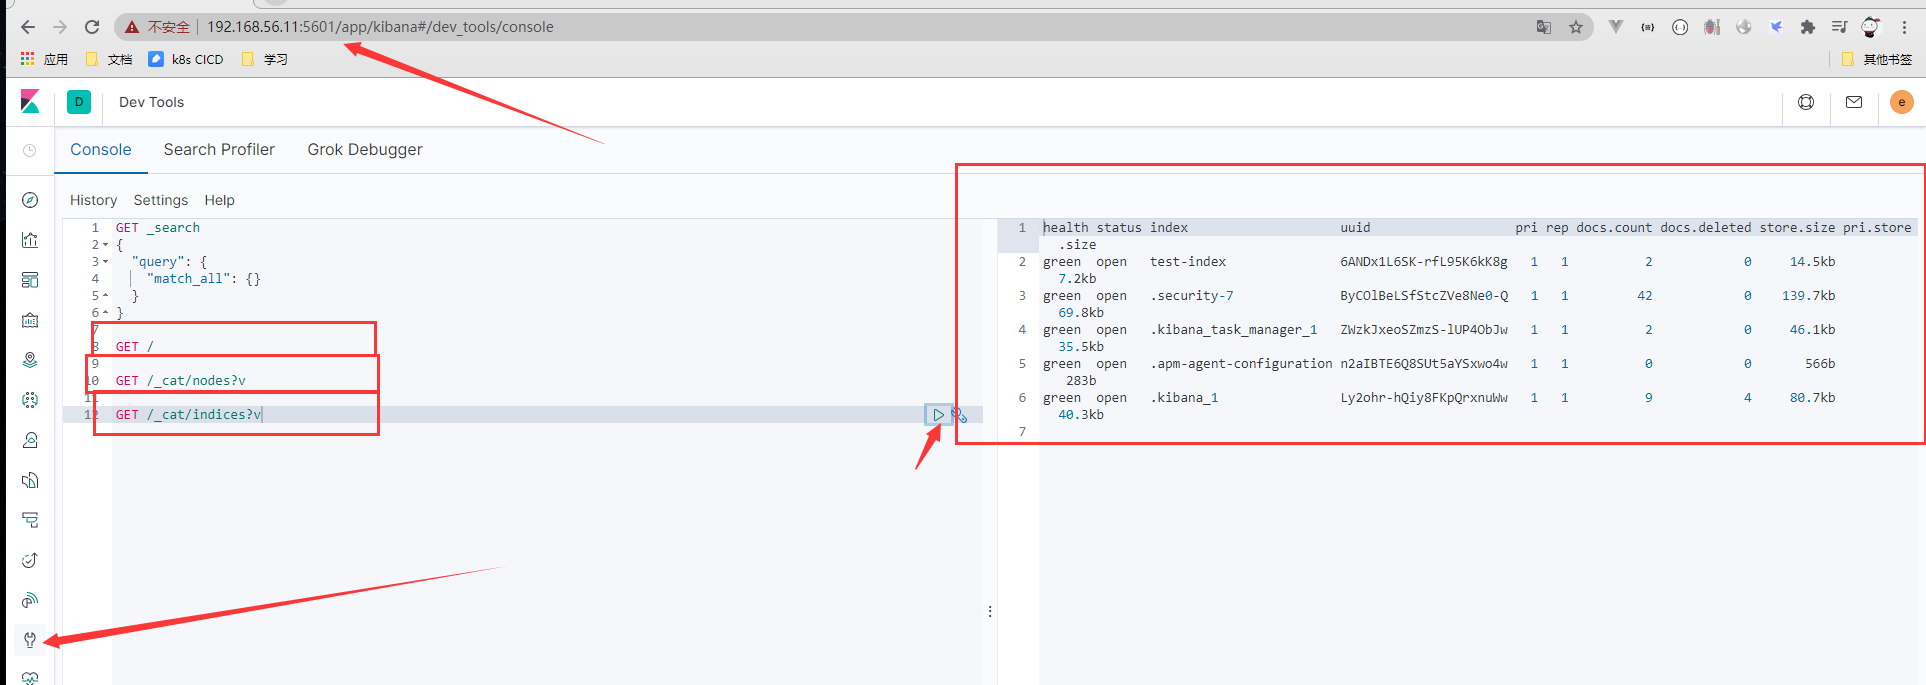
GET /
GET /_cat/nodes?v
GET /_cat/indices?v
- 数据插入
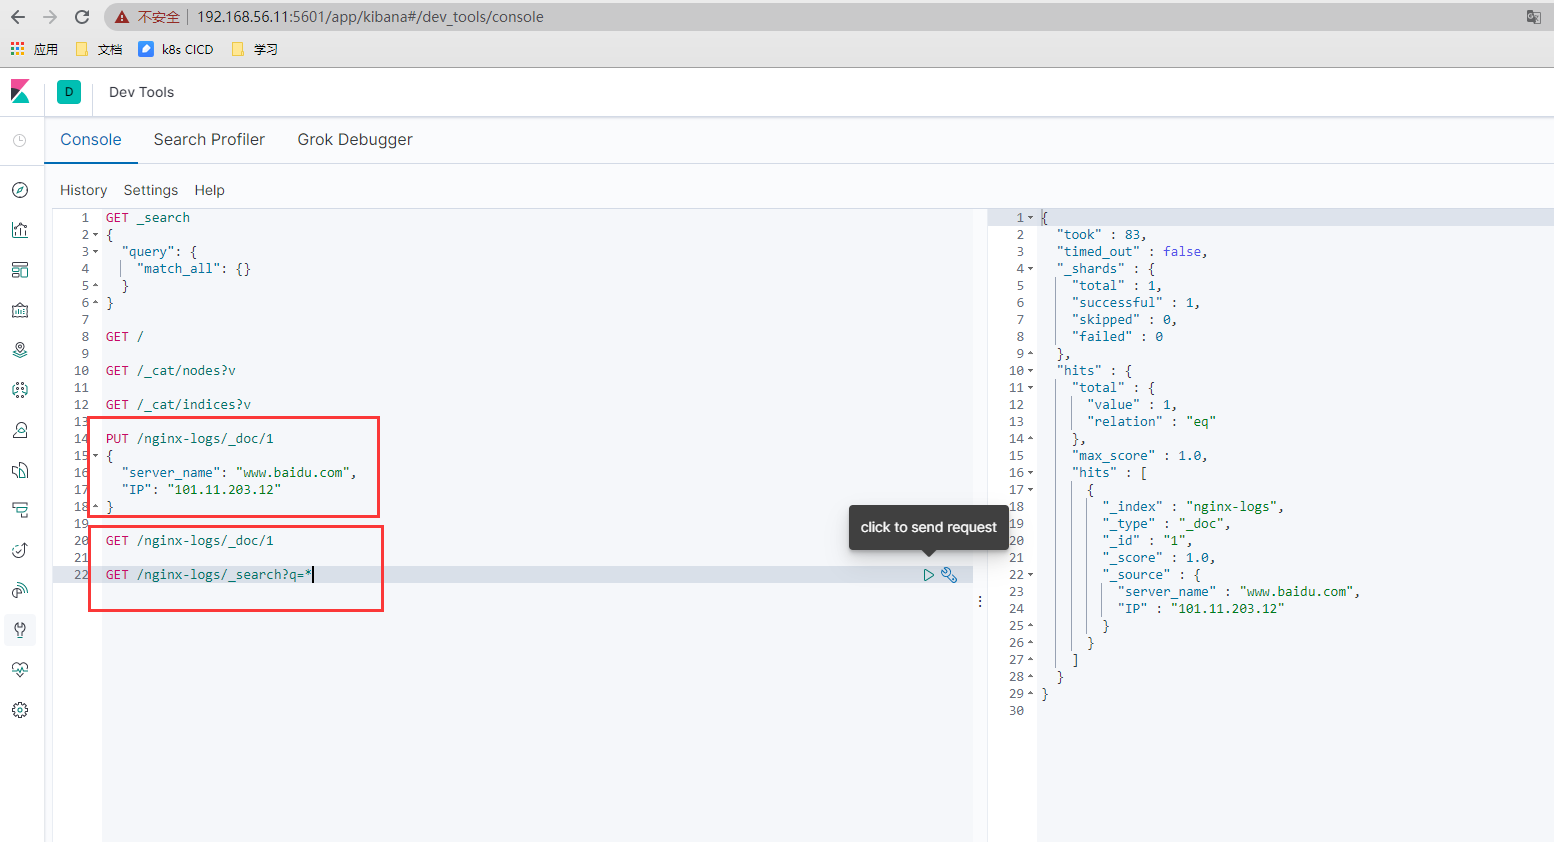
# 插入数据
PUT /nginx-logs/_doc/1
{
"server_name": "www.baidu.com",
"IP": "101.11.203.12"
}
## 查询数据
GET /nginx-logs/_doc/1
GET /nginx-logs/_search?q=*
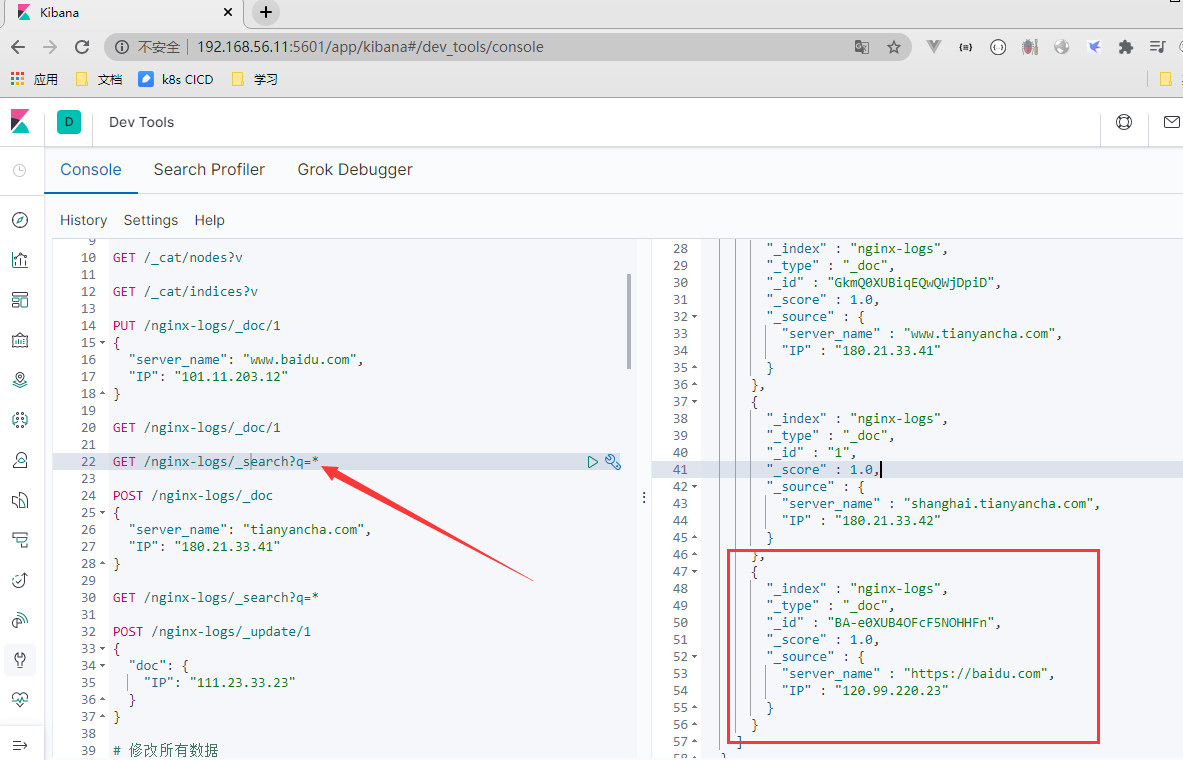
# 插入随机id数据
POST /nginx-logs/_doc
{
"server_name": "tianyancha.com",
"IP": "180.21.33.41"
}
# 查询所有数据
GET /nginx-logs/_search?q=*
# 更新数据
POST /nginx-logs/_update/1
{
"doc": {
"IP": "111.23.33.23"
}
}
# 修改所有数据
POST /nginx-logs/_update_by_query
{
"script": {
"source": "ctx._source['IP']='111.23.133.123'"
},
"query": {
"match_all": {}
}
}
GET /nginx-logs/_search?q=*
# 增加字段
POST /nginx-logs/_update_by_query
{
"script": {
"source": "ctx._source['city']='beijing'"
},
"query": {
"match_all": {}
}
}
# 删除数据
DELETE /nginx-logs/_doc/1
# 插入数据
POST /nginx-logs1/_doc
{
"server_name": "tianyancha.com",
"IP": "180.21.33.41"
}
POST /nginx-logs2/_doc
{
"server_name": "tianyancha.com",
"IP": "180.21.33.41"
}
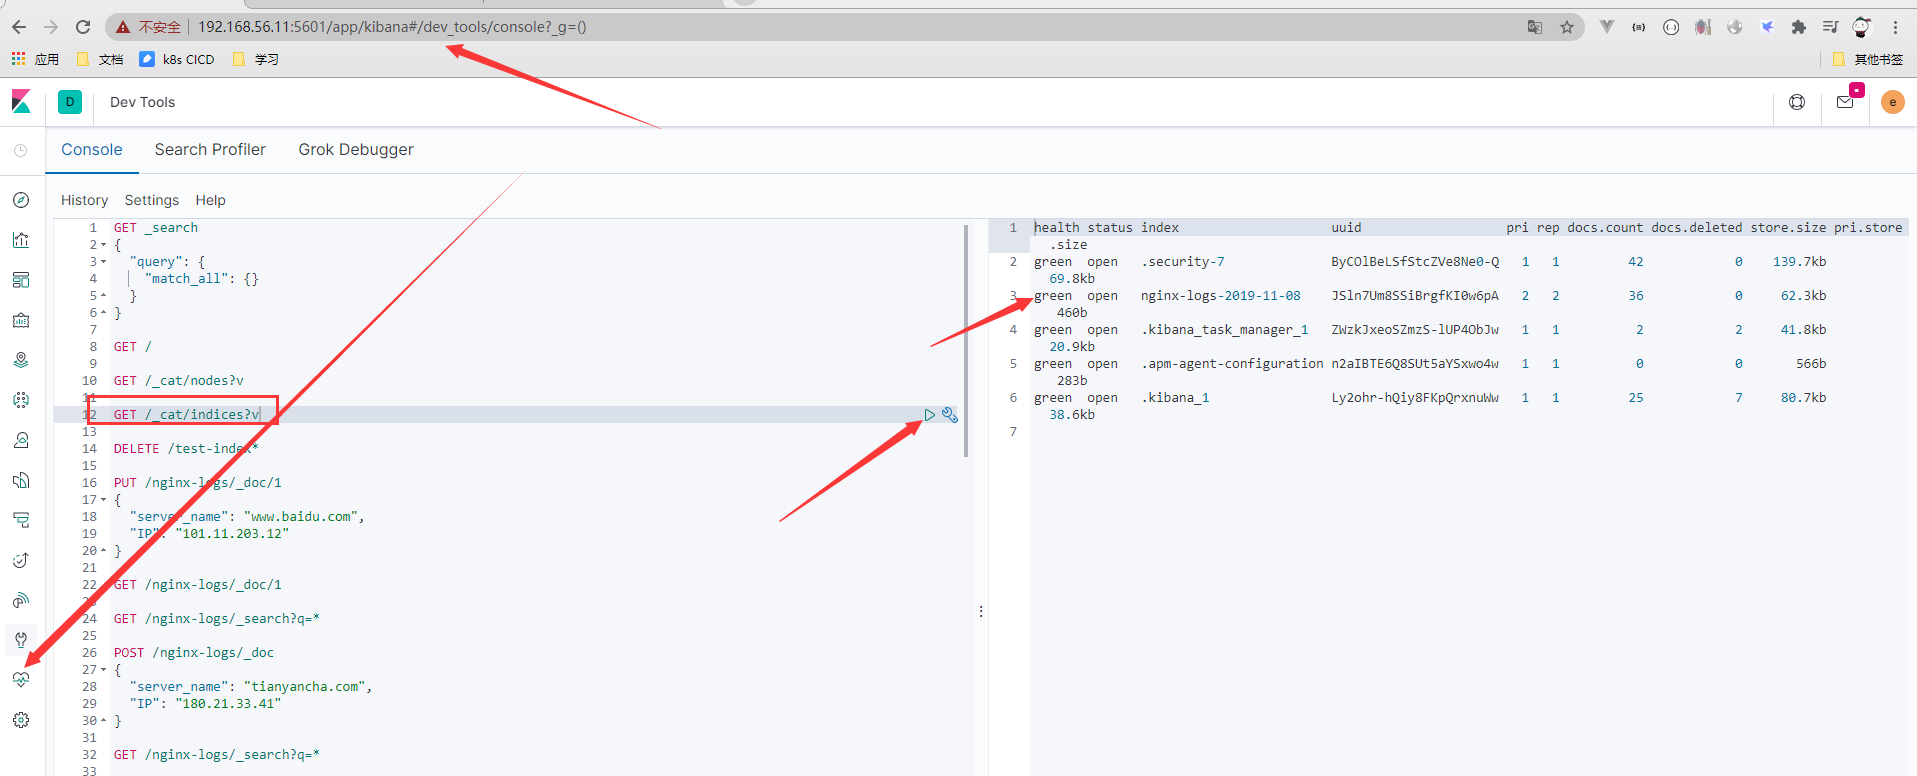
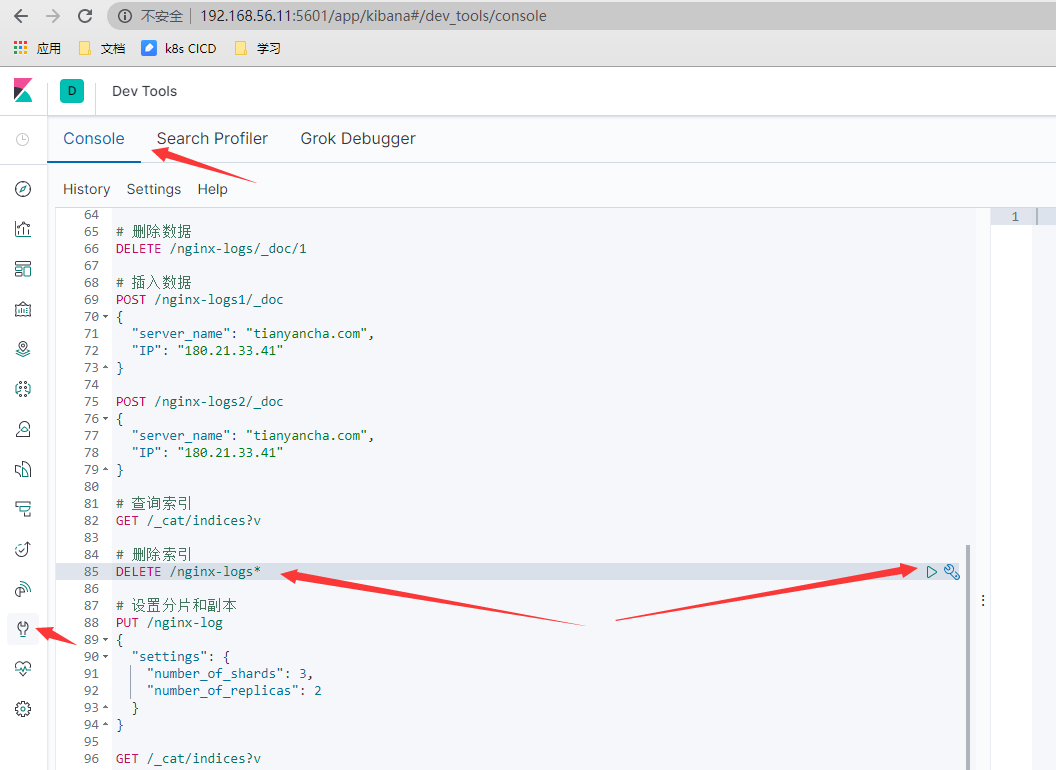
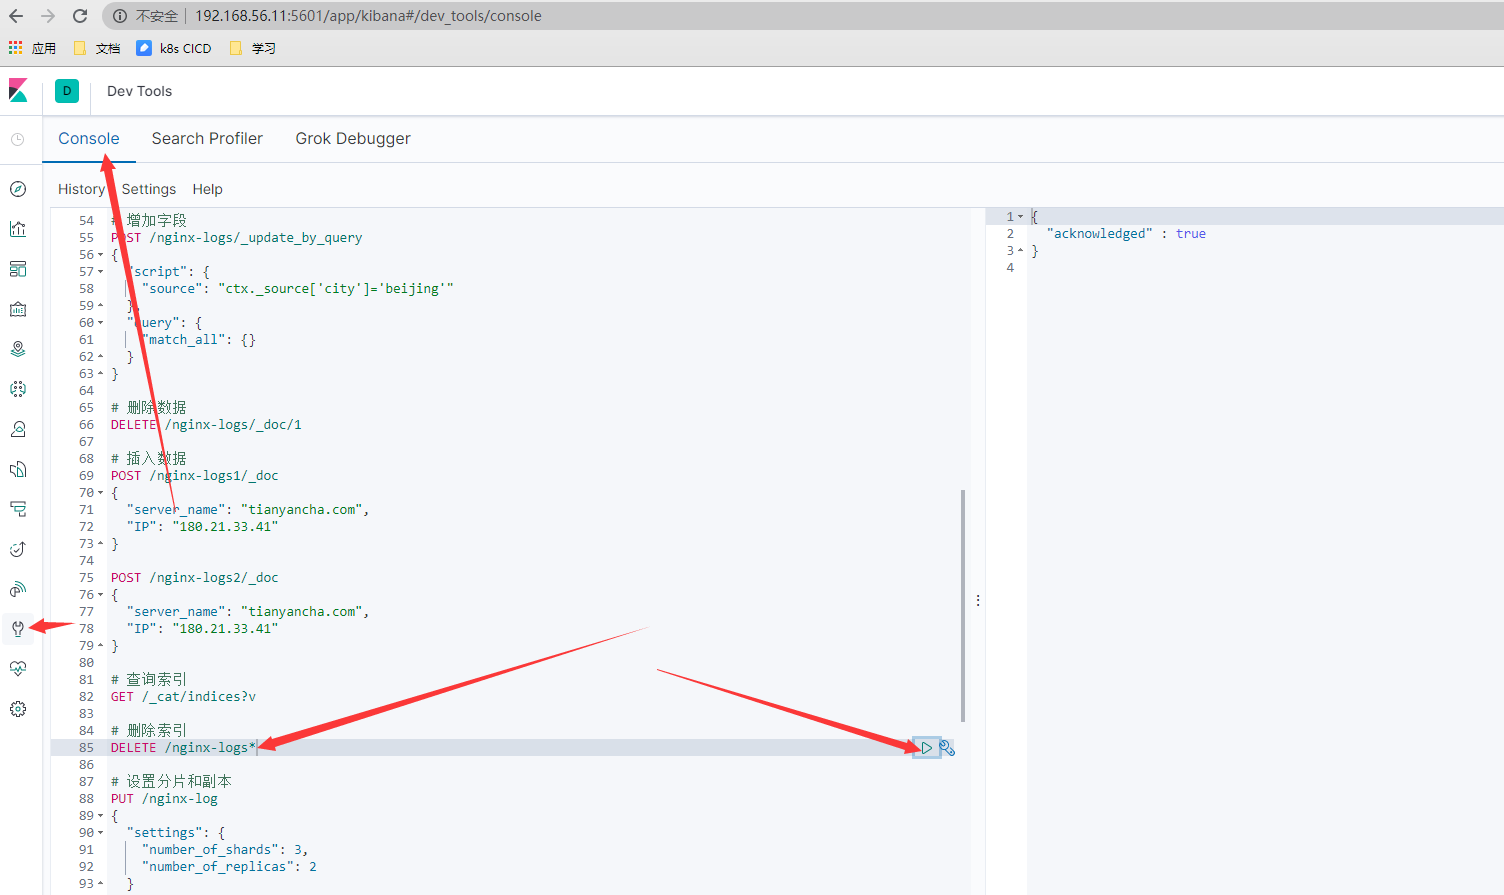
# 查询索引
GET /_cat/indices?v
# 删除索引
DELETE /nginx-logs*
ElasticSearch模板使用与Python操作
索引的分片及副本的设置
索引的分片以及副本数的设置: 三台ES,最多两个副本,其余的一个要用来存储主数据
# 设置分片和副本
PUT /nginx-log
{
"settings": {
"number_of_shards": 3,
"number_of_replicas": 2
}
}

GET /_cat/indices?v

#获取分片信息
GET /nginx-log/_search_shards
# 插入数据
POST /nginx-logs/_doc
{
"server_name": "tianyancha.com",
"IP": "180.21.33.41"
}

# 查询数据分片所在位置(routing也就是数据的ID)
GET /nginx-log/_search_shards?routing=GUmH0XUBiqEQwQWjL5hD
索引创建完成之后分片不可修改,副本数可以修改
# 修改副本数量
PUT /nginx-log/_settings
{
"number_of_replicas": 1
}
索引的模板
# 获取索引模板
GET /_template

# 简单索引模板创建
PUT _template/test-nginx
{
"index_patterns": ["nginx*"],
"settings": {
"number_of_shards": 2,
"number_of_replicas": 2
}
}

# 插入数据
POST /nginx-logs/_doc
{
"server_name": "www.tianyancha.com",
"IP": "180.21.33.41"
}

POST /nginx-logs/_doc/1
{
"server_name": "shanghai.tianyancha.com",
"IP": "180.21.33.42"
}

POST /nginx-logs/_doc/2
{
"server_name": "shanghai.tianyancha.com",
"IP": "180.21.33.42"
}
python操作ES数据库集群
环境准备
- 安装python36
[root@centos7-node2 ~]# yum -y install python36 python36-devel
- 升级pip3
[root@centos7-node2 ~]# pip3 install --upgrade pip -i https://mirrors.aliyun.com/pypi/simple
- 安装es7.6 的python库
[root@centos7-node2 ~]# pip3 install elasticsearch==7.6.0 -i https://mirrors.aliyun.com/pypi/simple
- 检查ES模块是否安装成功
[root@centos7-node2 ~]# python3
Python 3.6.8 (default, Apr  2 2020, 13:34:55)
[GCC 4.8.5 20150623 (Red Hat 4.8.5-39)] on linux
Type "help", "copyright", "credits" or "license" for more information.
>>> import elasticsearch
python操作ES集群
- 添加数据
[root@centos7-node2 ~]# vim add_data.py
#!/use/bin/python3

from elasticsearch import Elasticsearch

es = Elasticsearch(['http://elastic:elastic@192.168.56.11:9200','http://elastic:elastic@192.168.56.12:9200','http://elastic:elastic@192.168.56.13
:9200'])

body = {"server_name":"https://baidu.com","IP":"120.99.220.23"}

es.index(index='nginx-logs',body=body)

print("insert data success!!")
- 查询数据
[root@centos7-node2 ~]# cat search_data.py
#!/use/bin/python3

from elasticsearch import Elasticsearch

es = Elasticsearch(['http://elastic:elastic@192.168.56.11:9200','http://elastic:elastic@192.168.56.12:9200','http://elastic:elastic@192.168.56.13:9200'])

print(es.search(index='nginx-logs'))

[root@centos7-node2 ~]# python3 search_data.py    #查询数据
{'took': 2, 'timed_out': False, '_shards': {'total': 1, 'successful': 1, 'skipped': 0, 'failed': 0}, 'hits': {'total': {'value': 4, 'relation': 'eq'}, 'max_score': 1.0, 'hits': [{'_index': 'nginx-logs', '_type': '_doc', '_id': 'GUmH0XUBiqEQwQWjL5hD', '_score': 1.0, '_source': {'server_name': 'tianyancha.com', 'IP': '180.21.33.41'}}, {'_index': 'nginx-logs', '_type': '_doc', '_id': 'GkmQ0XUBiqEQwQWjDpiD', '_score': 1.0, '_source': {'server_name': 'www.tianyancha.com', 'IP': '180.21.33.41'}}, {'_index': 'nginx-logs', '_type': '_doc', '_id': '1', '_score': 1.0, '_source': {'server_name': 'shanghai.tianyancha.com', 'IP': '180.21.33.42'}}, {'_index': 'nginx-logs', '_type': '_doc', '_id': 'BA-e0XUB4OFcF5NOHHFn', '_score': 1.0, '_source': {'server_name': 'https://baidu.com', 'IP': '120.99.220.23'}}]}}
- 删除索引
[root@centos7-node2 ~]# vim delete_index.py
#!/use/bin/python3

from elasticsearch import Elasticsearch

es = Elasticsearch(['http://elastic:elastic@192.168.56.11:9200','http://elastic:elastic@192.168.56.12:9200','http://elastic:elastic@192.168.56.13
:9200'])

print(es.indices.delete(index='nginx-logs'))
- 循环添加数据
#!/use/bin/python3

from elasticsearch import Elasticsearch
import time

es = Elasticsearch(['http://elastic:elastic@192.168.56.11:9200','http://elastic:elastic@192.168.56.12:9200','http://elastic:elastic@192.168.56.13
:9200'])

for i in range(1,10000):
body = {"server_name":"https://{0}.baidu.com".format(i),"IP":"120.99.220.23","count":i}
es.index('nginx-logs',body=body)
time.sleep(0.1)
print("insert {0}".format(i))
LogStash实用技能实战
Logstash的安装和简单使用
官方文档: https://www.elastic.co/guide/en/logstash/7.6/index.html
Logstash的功能
- 对日志进行过滤处理
- 也能用于日志收集(一般不这么用)
- 输入支持: 标准输入,文本日志输入等
- 输出支持: 标准输出,ES输出等
Logstash的安装部署
- 节点: 192.168.56.14 centos7-node4
- 基本环境 centos7
- 时间同步
- yum源
curl -o /etc/yum.repos.d/CentOS-Base.repo https://mirrors.aliyun.com/repo/Centos-7.repo
wget -O /etc/yum.repos.d/epel.repo http://mirrors.aliyun.com/repo/epel-7.repo
yum -y install java-1.8.0-openjdk java-1.8.0-openjdk-devel ntpdate
ntpdate time.windows.com
- 安装logstash
参考: https://www.elastic.co/guide/en/logstash/7.6/installing-logstash.html
[root@centos7-node4 ~]# wget https://artifacts.elastic.co/downloads/logstash/logstash-7.6.2.rpm
[root@centos7-node4 ~]# yum localinstall logstash-7.6.2.rpm -y
- 配置logstash JVM参数
[root@centos7-node4 ~]# vim /etc/logstash/jvm.options
-Xms200M
-Xmx200M
- 配置logstash
[root@centos7-node4 ~]# cp /etc/logstash/logstash-sample.conf /etc/logstash/conf.d/logstash.conf
[root@centos7-node4 ~]# vim /etc/logstash/conf.d/logstash.conf
input {
stdin {}
}

output {
stdout {
codec=>rubydebug
}
}
- logstash的启动和测试
[root@centos7-node4 ~]# /usr/share/logstash/bin/logstash -f /etc/logstash/conf.d/logstash.conf
....
INFO ] 2019-11-09 05:17:20.482 [Api Webserver] agent - Successfully started Logstash API endpoint {:port=>9600}
logstash
/usr/share/logstash/vendor/bundle/jruby/2.5.0/gems/awesome_print-1.7.0/lib/awesome_print/formatters/base_formatter.rb:31: warning: constant ::Fixnum is deprecated
{
"@version" => "1",
"message" => "logstash",
"host" => "centos7-node4",
"@timestamp" => 2019-11-08T21:17:41.189Z
}
hello word
{
"@version" => "1",
"message" => "hello word",
"host" => "centos7-node4",
"@timestamp" => 2019-11-08T21:17:47.686Z
....
Logstash读取日志文件实战
- 环境准备: 安装ngixn
[root@centos7-node4 ~]# yum -y install nginx
[root@centos7-node4 ~]# vim /usr/lib/systemd/system/nginx.service   修改nginx启动文件
[Unit]
Description=The nginx HTTP and reverse proxy server
After=network.target remote-fs.target nss-lookup.target

[Service]
Type=forking
PIDFile=/run/nginx.pid
# Nginx will fail to start if /run/nginx.pid already exists but has the wrong
# SELinux context. This might happen when running `nginx -t` from the cmdline.
# https://bugzilla.redhat.com/show_bug.cgi?id=1268621
ExecStartPre=/usr/bin/rm -f /run/nginx.pid
ExecStartPre=/usr/sbin/nginx -t
ExecStart=/usr/sbin/nginx
ExecReload=/bin/kill -s HUP $MAINPID

[Install]
WantedBy=multi-user.target

[root@centos7-node4 ~]# systemctl start nginx && systemctl enable nginx     #服务启动
[root@centos7-node4 ~]# curl  localhost
[root@centos7-node4 ~]# tail  /var/log/nginx/access.log
- logstash配置
[root@centos7-node4 ~]# vim /etc/logstash/conf.d/logstash.conf
input {
file {
path => "/var/log/nginx/access.log"
}
}

output {
stdout {
codec=>rubydebug
}
}
- 测试logstash
[root@centos7-node4 ~]# systemctl restart logstash
[root@centos7-node4 ~]# tail -f /var/log/logstash/logstash-plain.log
[2019-11-09T05:29:03,147][INFO ][logstash.runner          ] Starting Logstash {"logstash.version"=>"7.6.2"}
[2019-11-09T05:29:03,205][INFO ][logstash.agent           ] No persistent UUID file found. Generating new UUID {:uuid=>"93219590-7b15-41b6-b262-c2c4077278f9", :path=>"/var/lib/logstash/uuid"}
[2019-11-09T05:29:05,203][INFO ][org.reflections.Reflections] Reflections took 54 ms to scan 1 urls, producing 20 keys and 40 values
[2019-11-09T05:29:06,349][WARN ][org.logstash.instrument.metrics.gauge.LazyDelegatingGauge][main] A gauge metric of an unknown type (org.jruby.RubyArray) has been created for key: cluster_uuids. This may result in invalid serialization.  It is recommended to log an issue to the responsible developer/development team.
[2019-11-09T05:29:06,375][INFO ][logstash.javapipeline
此时logstash不能正常采集日志,因为对nginx日志权限存在问题,所以要改一下nginx日志权限
[root@centos7-node4 ~]# chmod 775 -R /var/log/nginx/
- 查看message日志(一定要有新日志产生)
[root@centos7-node4 ~]# tail -f /var/log/messages
Logstash读取日志内容输出到ES
说明:
logstash支持读取日志发送到ES
但是Logstash用来收集日志比较重,后面将对此做优化
操作实战
- 清理原先ES集群数据
- 配置logstash配置发送日志到ES的配置
[root@centos7-node4 ~]# vim /etc/logstash/conf.d/logstash.conf
elasticsearch {
input {
file {
path => "/var/log/nginx/access.log"
}
}

output {
elasticsearch {
hosts => ["http://192.168.56.11:9200","192.168.56.12:9200","192.168.56.13:9200"]
user  => "elastic"
password  => "elastic"
index  => "nginx-logs-%{+YYYY-MM-dd}"
}
}
- 重启logstash
[root@centos7-node4 ~]# systemctl restart logstash
[root@centos7-node4 ~]# ps -ef | grep logstash
- 多次访问http://192.168.56.14 (这是我的nginx部署所在)
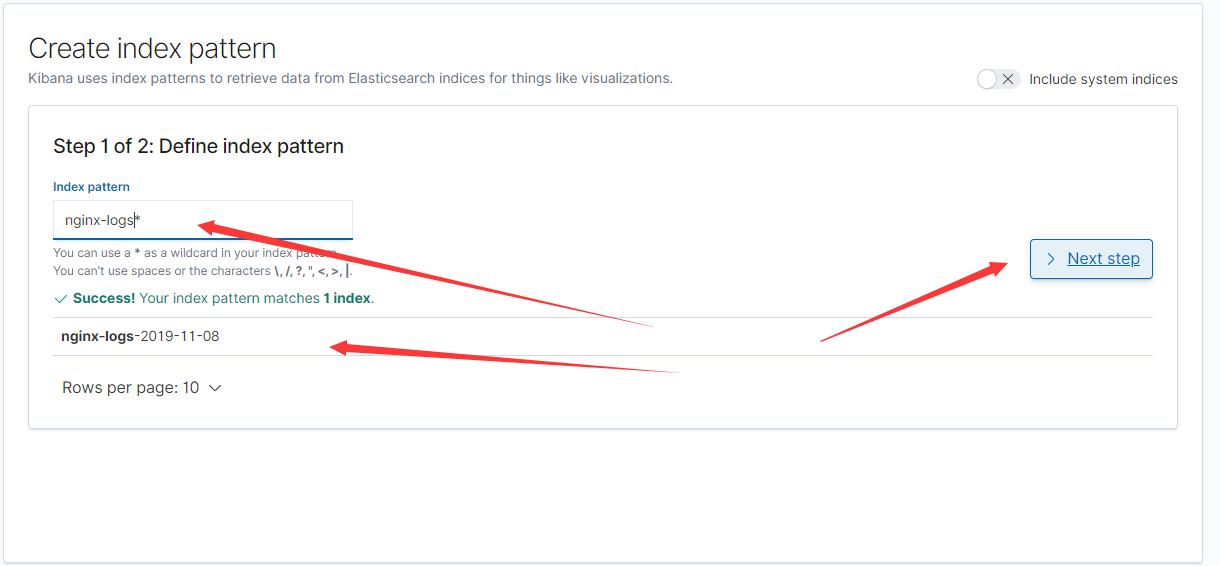
- kibana查看index是否存在
- 加入kibana

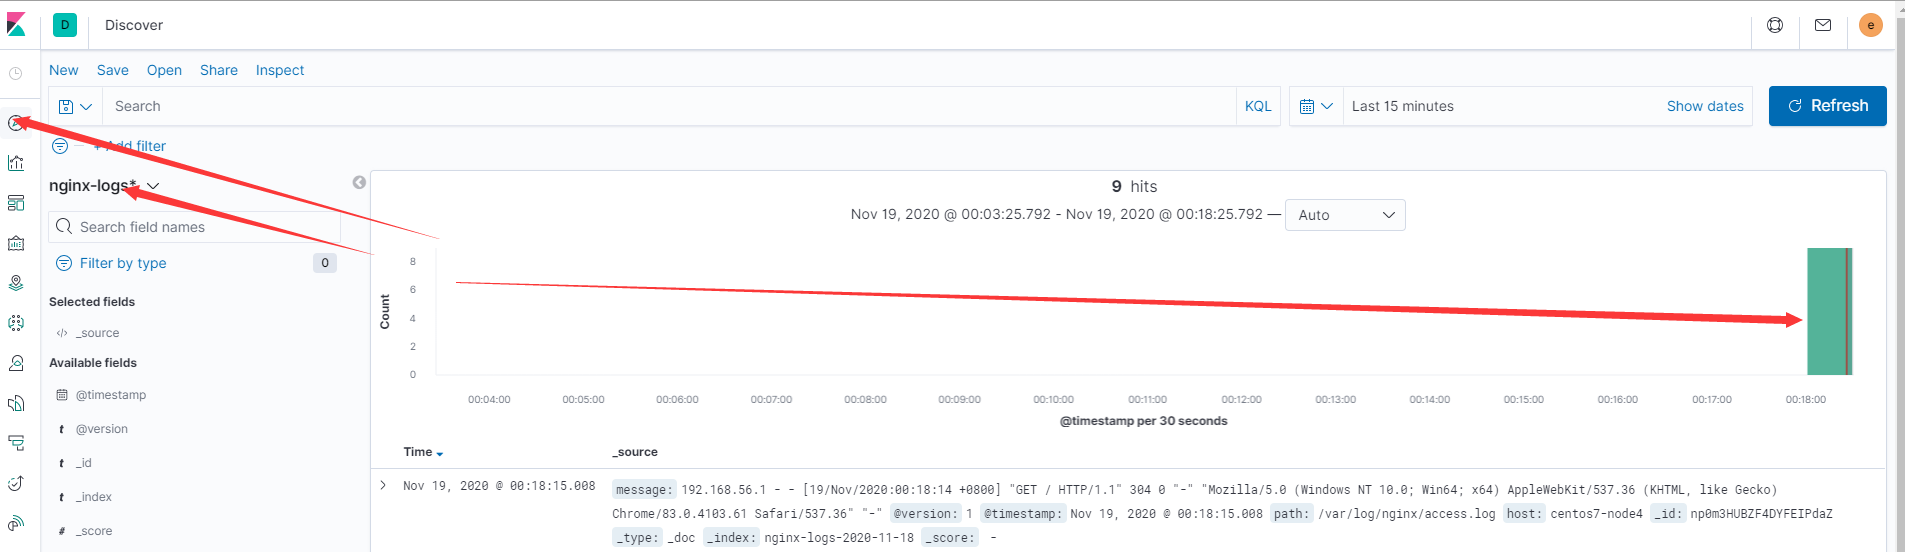
- 数据写入查看
Logstash正则提取Nginx日志
为什么要提取nginx日志?
- 使用一整行日志无法分析,需要提取单独的字段
- 分析哪个IP的访问量最大
- 分析nginx的相应状态码
nginx默认日志的格式与配置
- 日志格式
192.168.56.1 - - [09/Nov/2019:05:24:08 +0800] "GET / HTTP/1.1" 200 4833 "-" "Mozilla/5.0 (Windows NT 10.0; Win64; x64) AppleWebKit/537.36 (KHTML, like Gecko) Chrome/83.0.4103.61 Safari/537.36" "-"
- 日志格式配置
log_format  main  '$remote_addr - $remote_user [$time_local] "$request" '
'$status $body_bytes_sent "$http_referer" '
'"$http_user_agent" "$http_x_forwarded_for"';
Grok日志提取神器
需要掌握正则表达式,借助kibana的grok工具验证提取
- 自写正则提取
- 内置规则提取(提取简化)
[root@centos7-node4 ~]# cat /usr/share/logstash/vendor/bundle/jruby/2.5.0/gems/logstash-patterns-core-4.1.2/patterns/grok-patterns
- 普通正则表达式符号
.表示任意一个字符*表示前面一个字符出现0次或者多次[abc]表示中括号内的任意一个字符[^abc]表示非中括号内的字符[0-9]表示数字[a-z]表示小写字母[A-Z]表示大写字母[a-zA-Z]表示所有字母[a-zA-Z0-9]表示所有字母+数字[^0-9]表示非数字^xxx表示以xxx开头xxx$表示以xxx结尾\s表示空白字符\S表示非空白字符\d表示数字
1.1 kibana日志提取操作
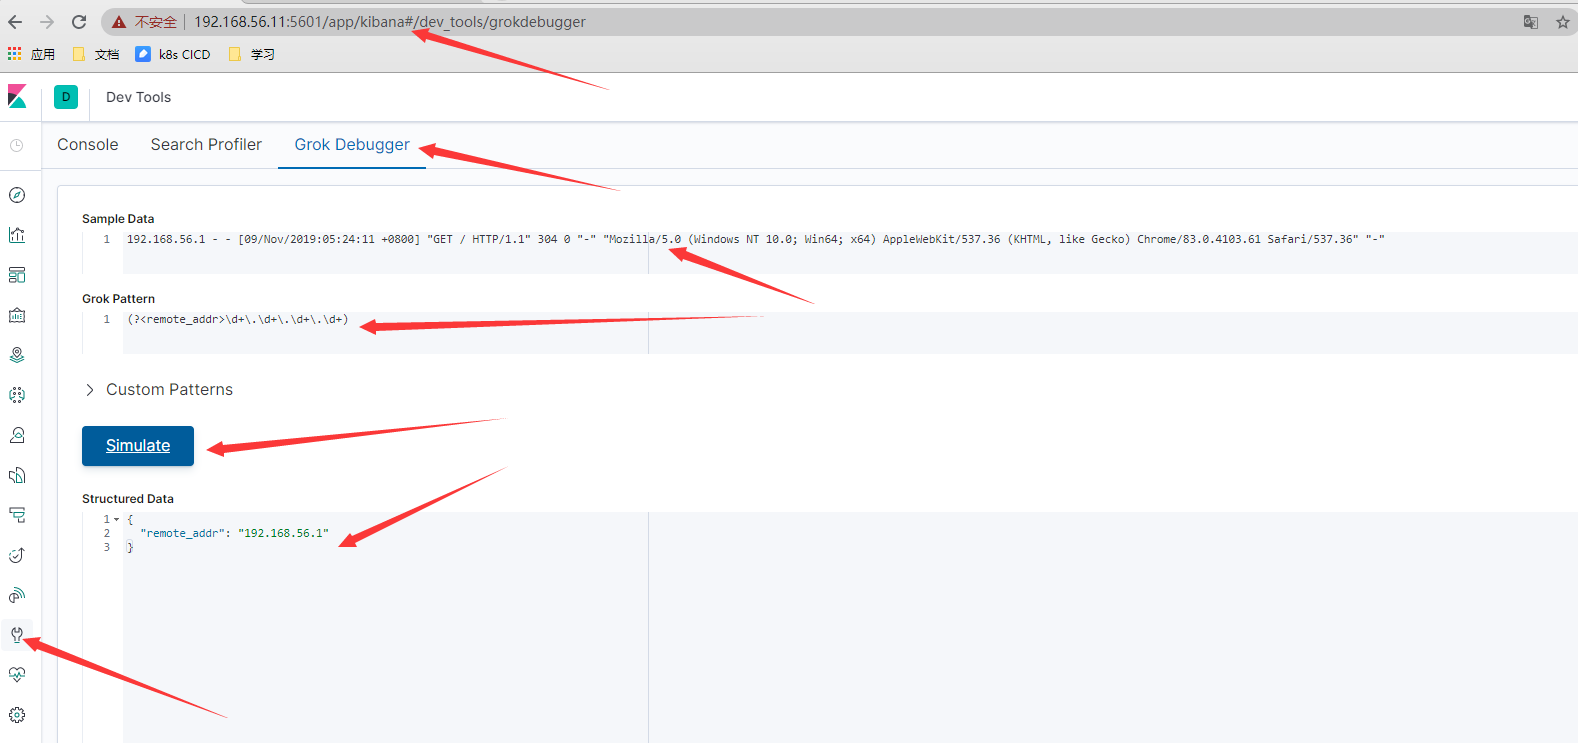
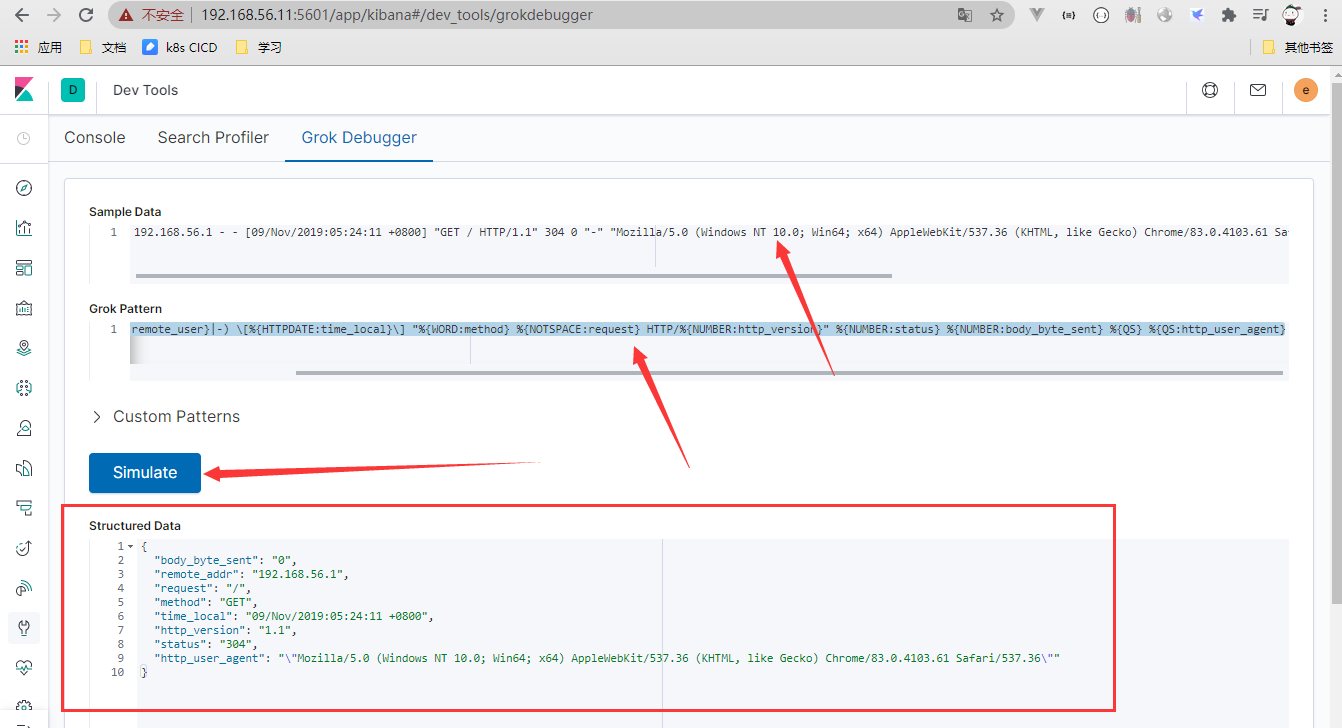
- 拓展正则表达式,在普通正则表达式的基础上再进行拓展
%{IP:remote_addr} - (%{WORD:remote_user}|-) \[%{HTTPDATE:time_local}\] "%{WORD:method} %{NOTSPACE:request} HTTP/%{NUMBER:http_version}" %{NUMBER:status} %{NUMBER:body_byte_sent} %{QS} %{QS:http_user_agent}
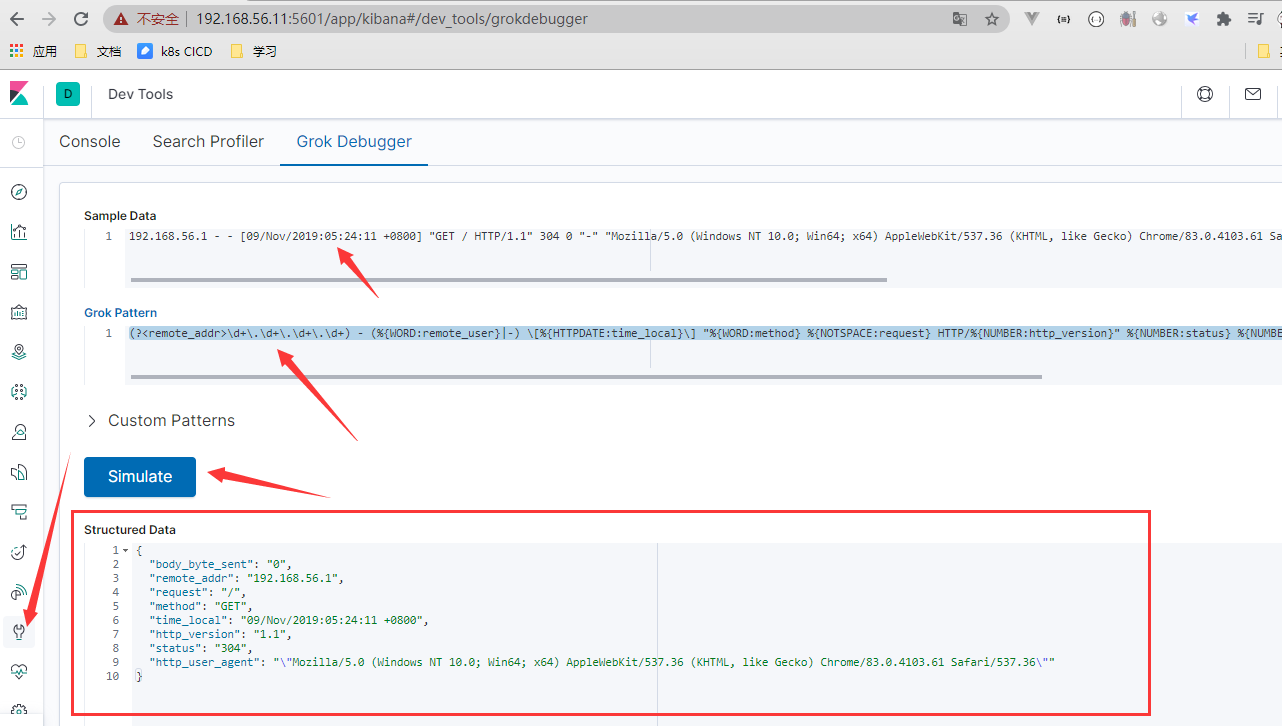
-
混合正则
(?<remote_addr>\d+\.\d+\.\d+\.\d+) - (%{WORD:remote_user}|-) \[%{HTTPDATE:time_local}\] "%{WORD:method} %{NOTSPACE:request} HTTP/%{NUMBER:http_version}" %{NUMBER:status} %{NUMBER:body_byte_sent} %{QS} %{QS:http_user_agent}
logstash grok将日志写入ES
- 配置logstash提取日志配置
[root@centos7-node4 ~]# vim /etc/logstash/conf.d/logstash.conf
input {
file {
path => "/var/log/nginx/access.log"
}
}

filter {
grok {
match => {
"message" => '%{IP:remote_addr} - (%{WORD:remote_user}|-) \[%{HTTPDATE:time_local}\] "%{WORD:method} %{NOTSPACE:request} HTTP/%{NUMBER}" %{NUMBER:status} %{NUMBER:body_bytes_sent} %{QS} %{QS:http_user_agent}'
}
remove_field => ["message"]
}
}

output {
elasticsearch {
hosts => ["http://192.168.56.11:9200","192.168.56.12:9200","192.168.56.13:9200"]
user  => "elastic"
password  => "elastic"
index  => "nginx-logs-%{+YYYY-MM-dd}"
}
}
- 重启logstash
[root@centos7-node4 ~]# systemctl restart logstash
[root@centos7-node4 ~]# tail -f /var/log/logstash/logstash-plain.log
[root@centos7-node4 ~]# ps -ef | grep logstash
- 访问nginx(192.168.56.14)
Nginx模拟用户访问
while true;do
curl 192.168.56.14/wanghui666
curl 127.0.0.1
sleep 2
done
- 查看kibana
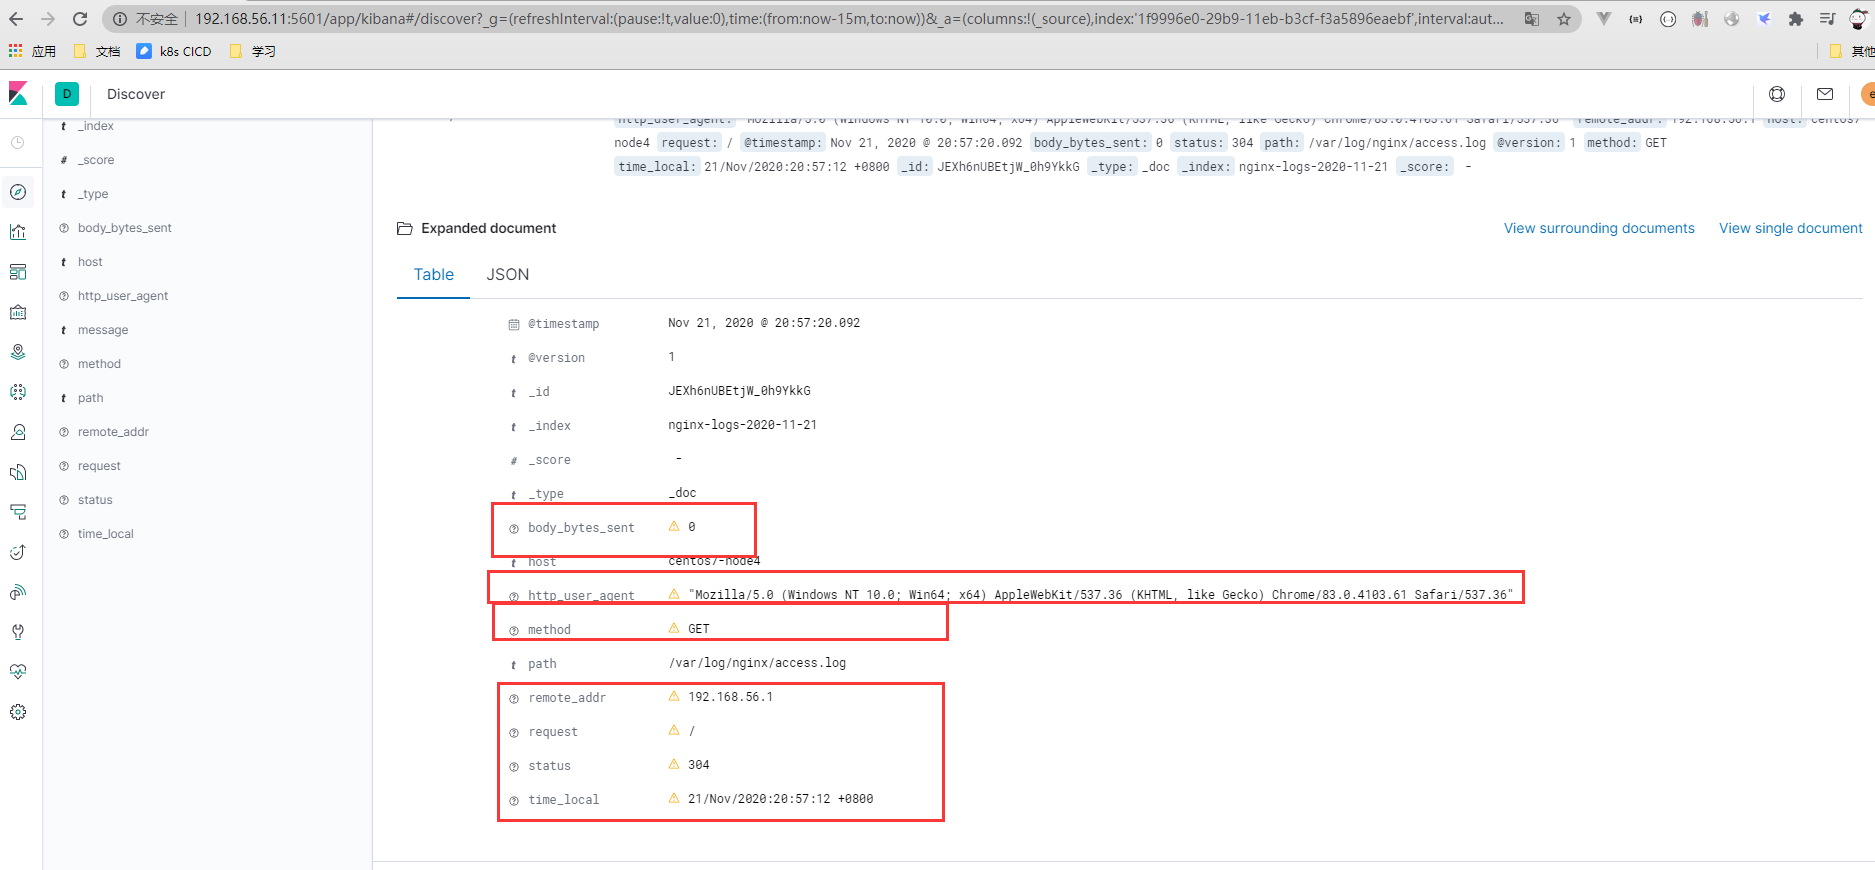
kibana显示感叹号问题的处理
出现感叹号的原因就是重新加入分词,日志字段出现多个的场景
- kibana索引刷新
- Kibana索引的操作并不会影响到数据,删除重建也没问题

- 查看索引
Logstash特殊字段处理与替换
- 去除字段中的引号
mutate {
gsub => ["http_user_agent",'"',""]
}
- 数字类型的字符串转换成整型
mutate {
convert => { "status" => "integer" }
convert => { "body_bytes_sent" => "integer" }
}
- 完整logstash如下:
[root@centos7-node4 ~]# vim /etc/logstash/conf.d/logstash.conf
input {
file {
path => "/var/log/nginx/access.log"
}
}

filter {
grok {
match => {
"message" => '%{IP:remote_addr} - (%{WORD:remote_user}|-) \[%{HTTPDATE:time_local}\] "%{WORD:method} %{NOTSPACE:request} HTTP/%{
NUMBER}" %{NUMBER:status} %{NUMBER:body_bytes_sent} %{QS} %{QS:http_user_agent}'
}
remove_field => ["message"]
}
mutate {
gsub => ["http_user_agent",'"',""]
convert => { "status" => "integer" }
convert => { "body_bytes_sent" => "integer" }
}
}

output {
elasticsearch {
hosts => ["http://192.168.56.11:9200","192.168.56.12:9200","192.168.56.13:9200"]
user  => "elastic"
password  => "elastic"
index  => "nginx-logs-%{+YYYY-MM-dd}"
}
}
- 重启logstash
[root@centos7-node4 ~]# kill -1 $(ps -ef | grep logstash | grep -v grep | awk '{print $2}')
- 访问nginx
- 查看kibana结果
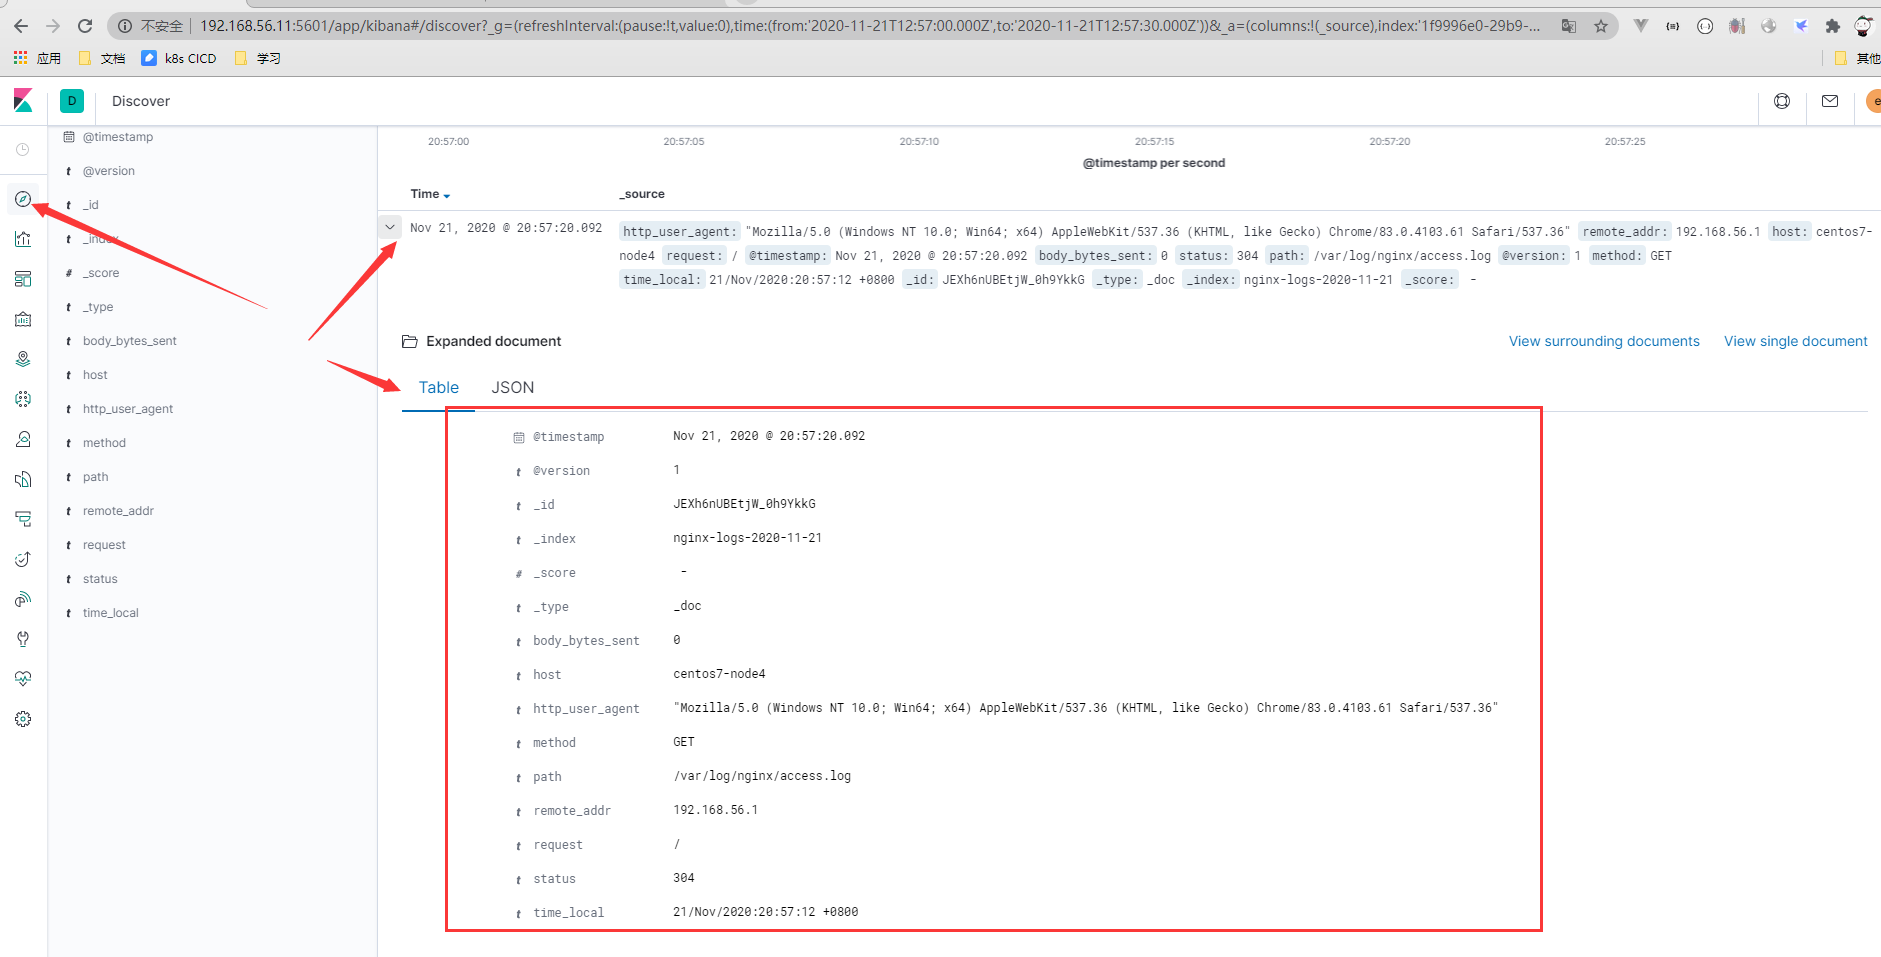
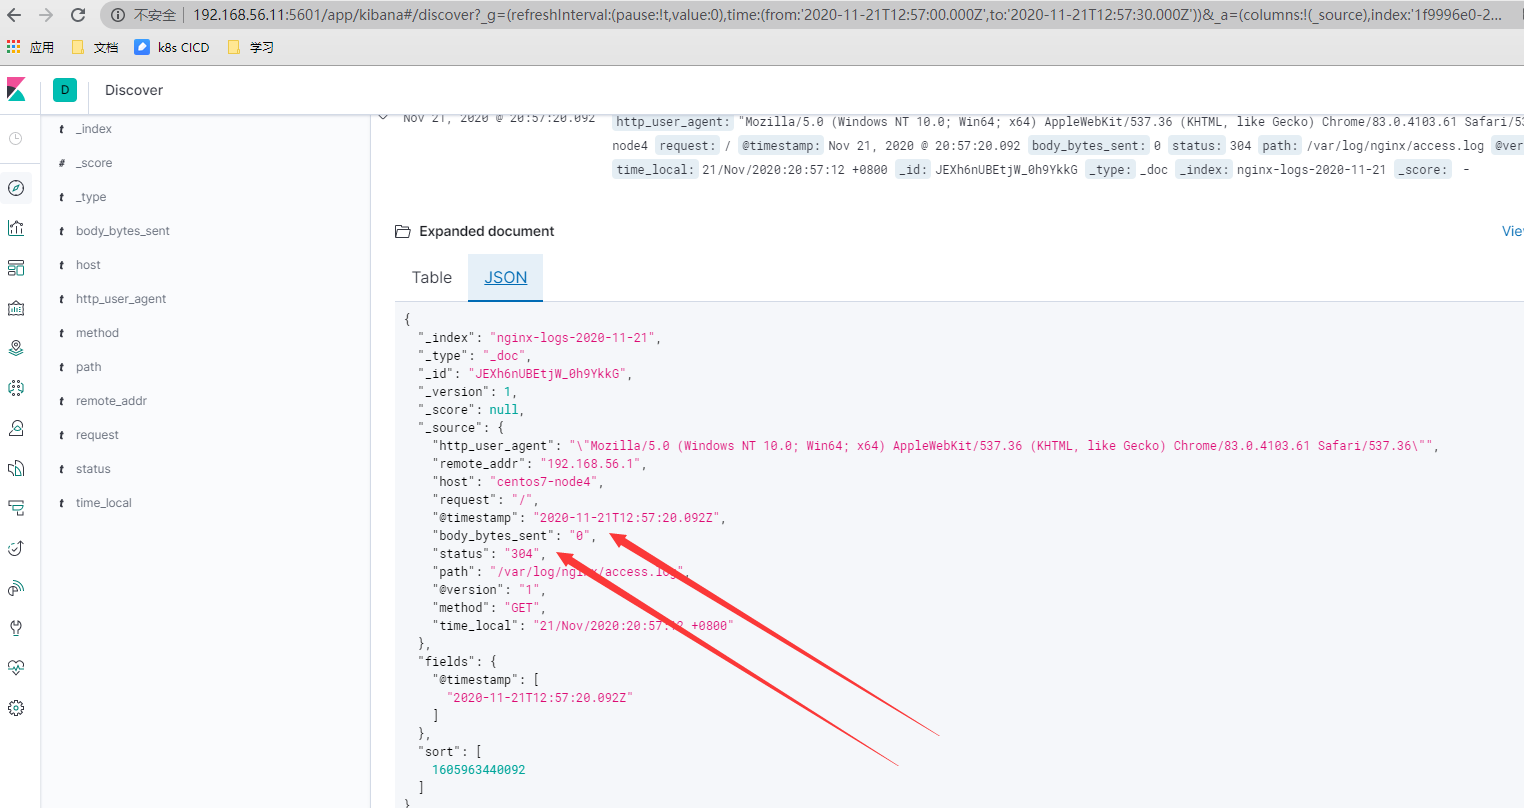
Logstash替换时间戳timestamp
存在的问题:
处理过程如下:
- 删除index
- 修改logstash
[root@centos7-node4 ~]# vim /etc/logstash/conf.d/logstash.conf
input {
file {
path => "/var/log/nginx/access.log"
start_position => "beginning"
sincedb_path => "/dev/null"
}
}

filter {
grok {
match => {
"message" => '%{IP:remote_addr} - (%{WORD:remote_user}|-) \[%{HTTPDATE:time_local}\] "%{WORD:method} %{NOTSPACE:request} HTTP/%{
NUMBER}" %{NUMBER:status} %{NUMBER:body_bytes_sent} %{QS} %{QS:http_user_agent}'
}
remove_field => ["message"]
}
mutate {
gsub => ["http_user_agent",'"',""]
convert => { "status" => "integer" }
convert => { "body_bytes_sent" => "integer" }
}
}

output {
elasticsearch {
hosts => ["http://192.168.56.11:9200","192.168.56.12:9200","192.168.56.13:9200"]
user  => "elastic"
password  => "elastic"
index  => "nginx-logs-%{+YYYY-MM-dd}"
}
}
- 重启logstash
[root@centos7-node4 ~]# kill -1 $(ps -ef | grep logstash | grep -v grep | awk '{print $2}')
[root@centos7-node4 ~]# tail -f /var/log/messages
- 问题浮现
使用nginx日志中的访问日期覆盖kibana上的时间
- logstash配置如下
[root@centos7-node4 ~]# vim /etc/logstash/conf.d/logstash.conf
input {
file {
path => "/var/log/nginx/access.log"
start_position => "beginning"
sincedb_path => "/dev/null"
}
}

filter {
grok {
match => {
"message" => '%{IP:remote_addr} - (%{WORD:remote_user}|-) \[%{HTTPDATE:time_local}\] "%{WORD:method} %{NOTSPACE:request} HTTP/%{
NUMBER}" %{NUMBER:status} %{NUMBER:body_bytes_sent} %{QS} %{QS:http_user_agent}'
}
remove_field => ["message"]
}
date {
match => ["time_local", "dd/MMM/yyyy:HH:mm:ss Z"]
target => "@timestamp"
}
mutate {
gsub => ["http_user_agent",'"',""]
convert => { "status" => "integer" }
convert => { "body_bytes_sent" => "integer" }
remove_field => ["time_local"]
}
}

output {
elasticsearch {
hosts => ["http://192.168.56.11:9200","192.168.56.12:9200","192.168.56.13:9200"]
user  => "elastic"
password  => "elastic"
index  => "nginx-logs-%{+YYYY-MM-dd}"
}
}
- 删除日志索引
- 重启logstash
[root@centos7-node4 ~]# kill -1 $(ps -ef | grep logstash | grep -v grep | awk '{print $2}')
[root@centos7-node4 ~]# tail -f /var/log/messages
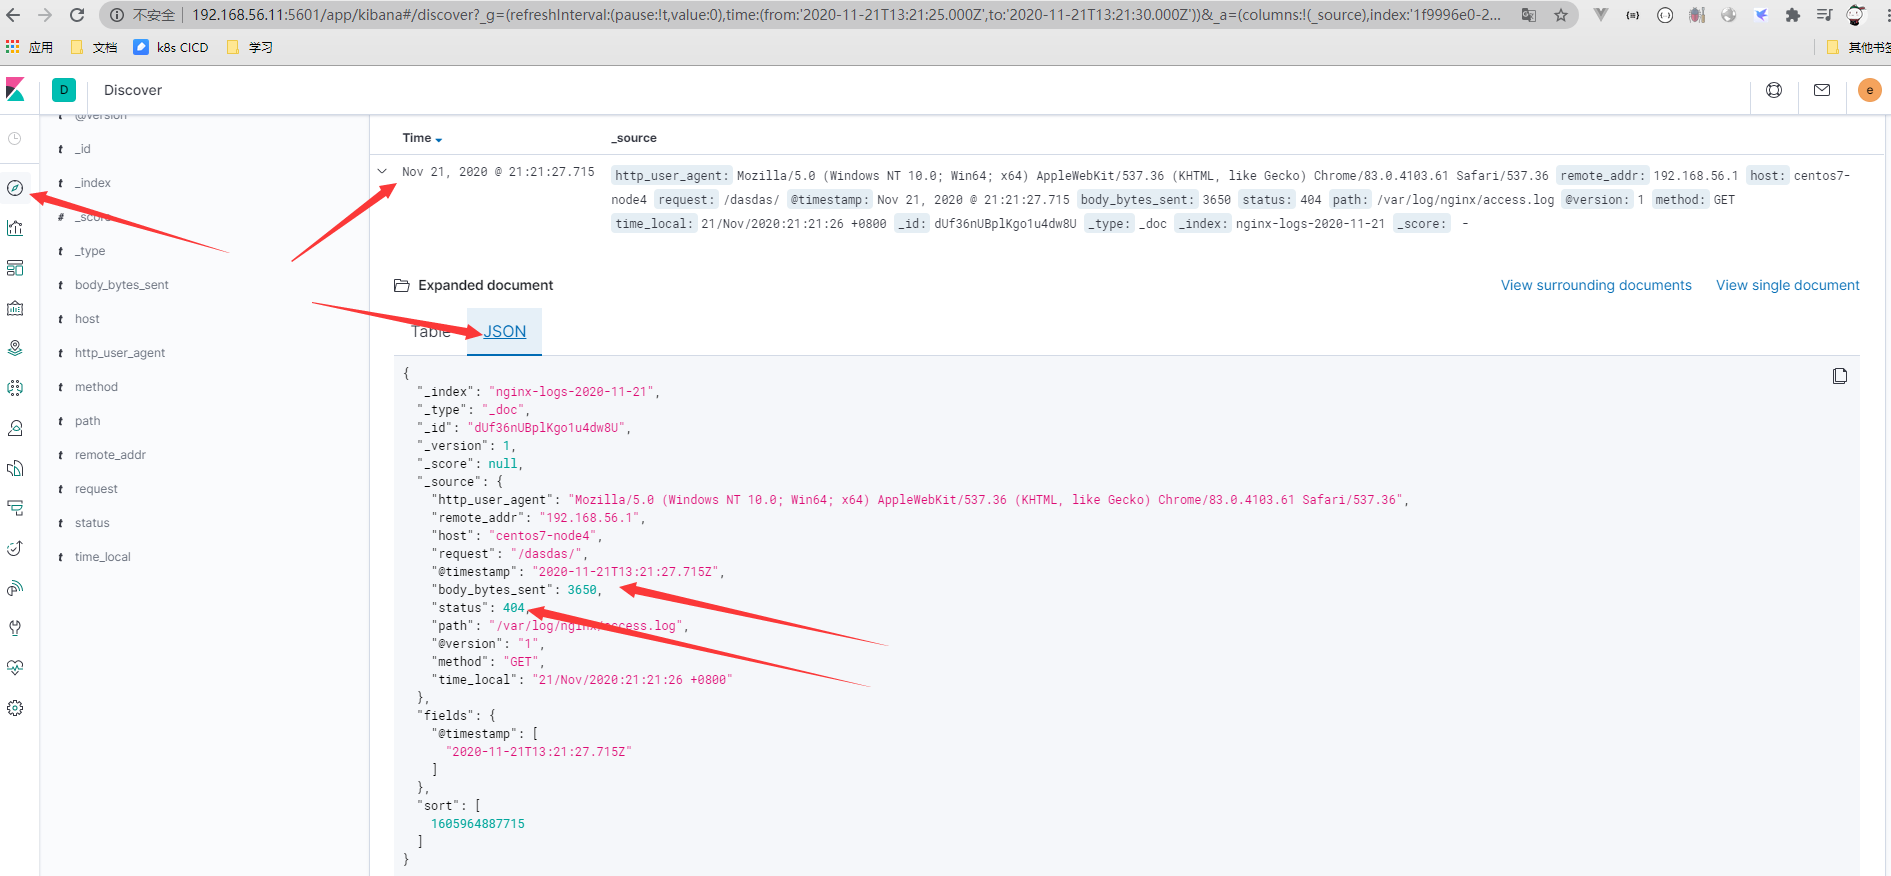
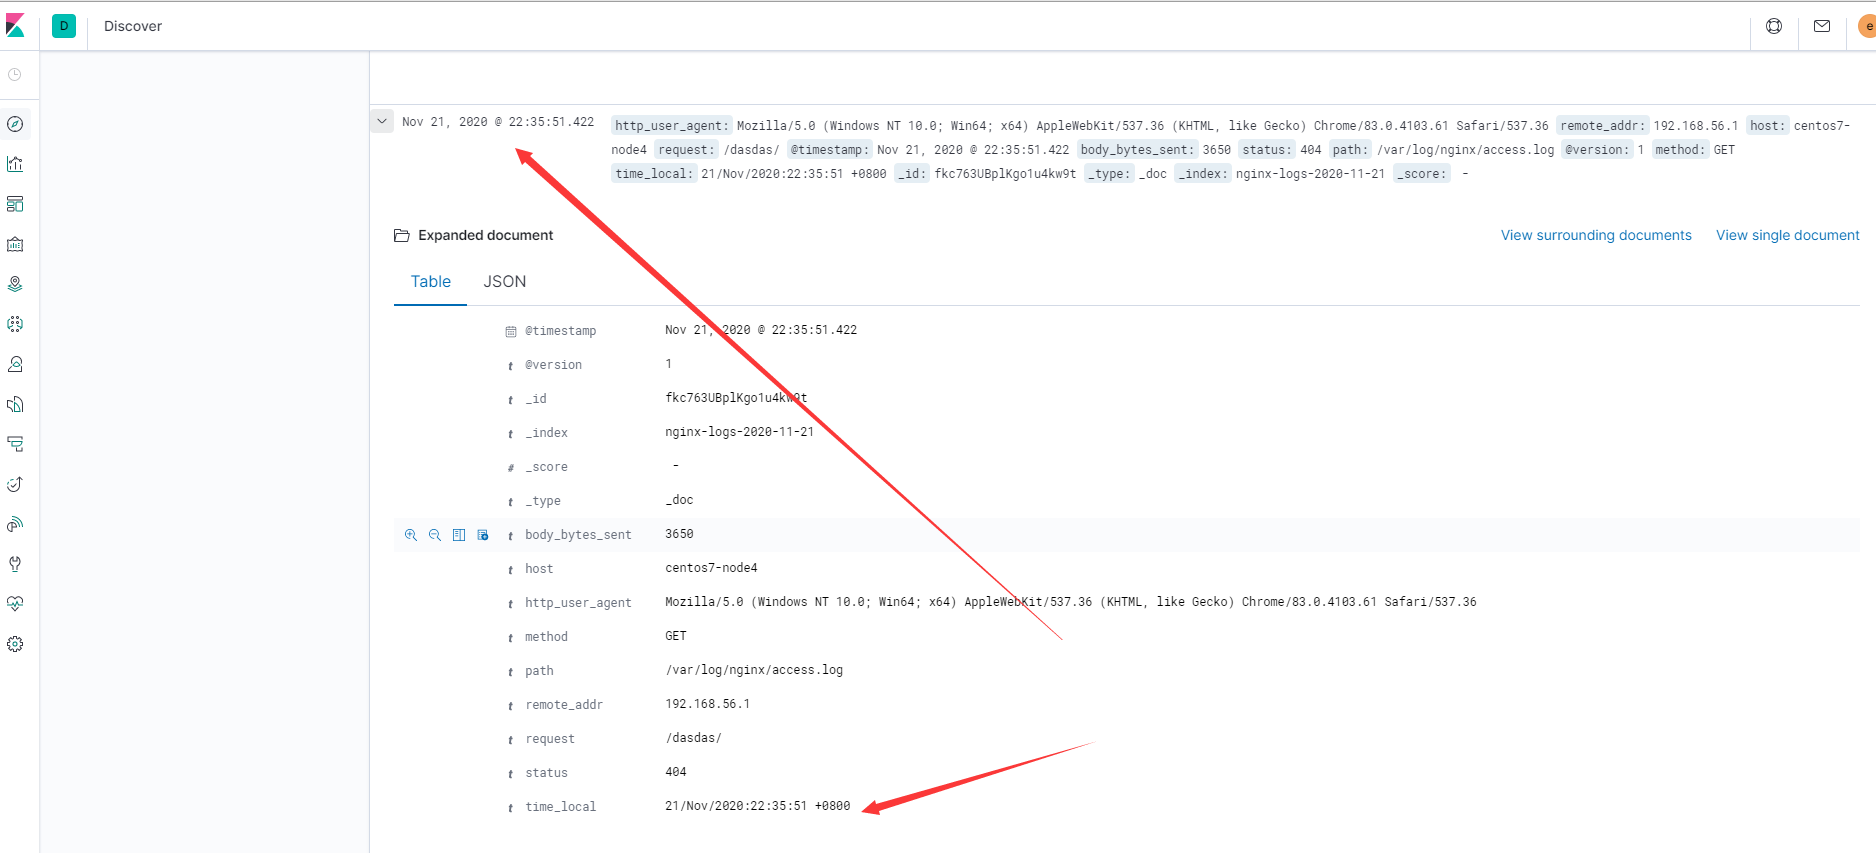
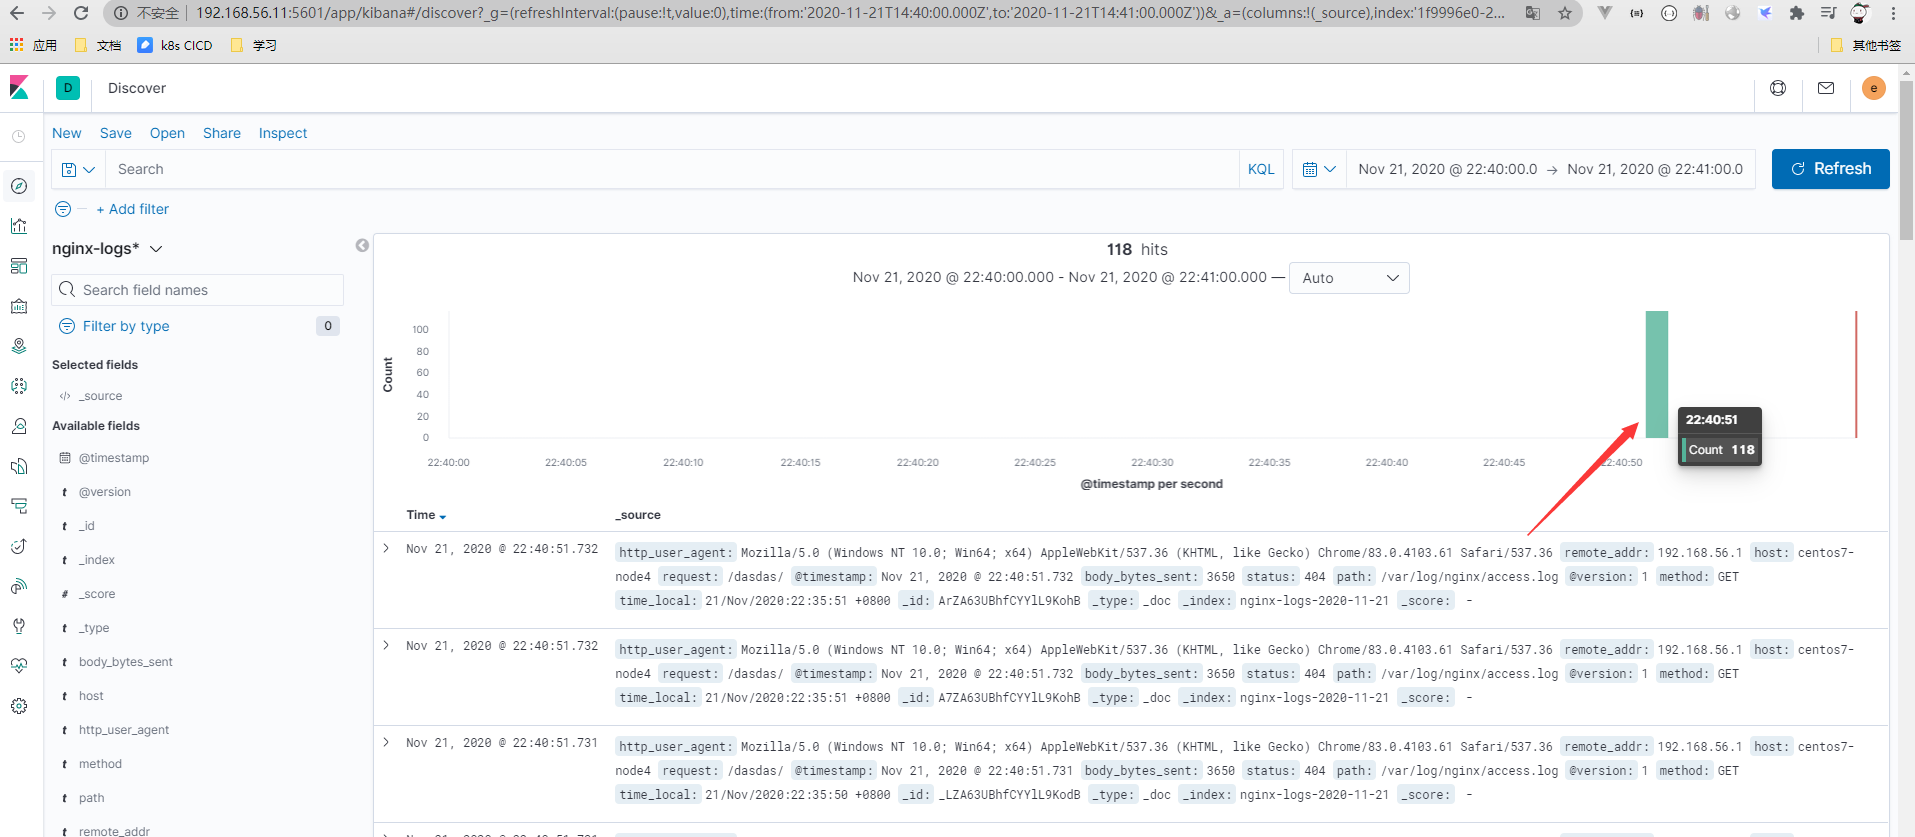
- kibana展示查看
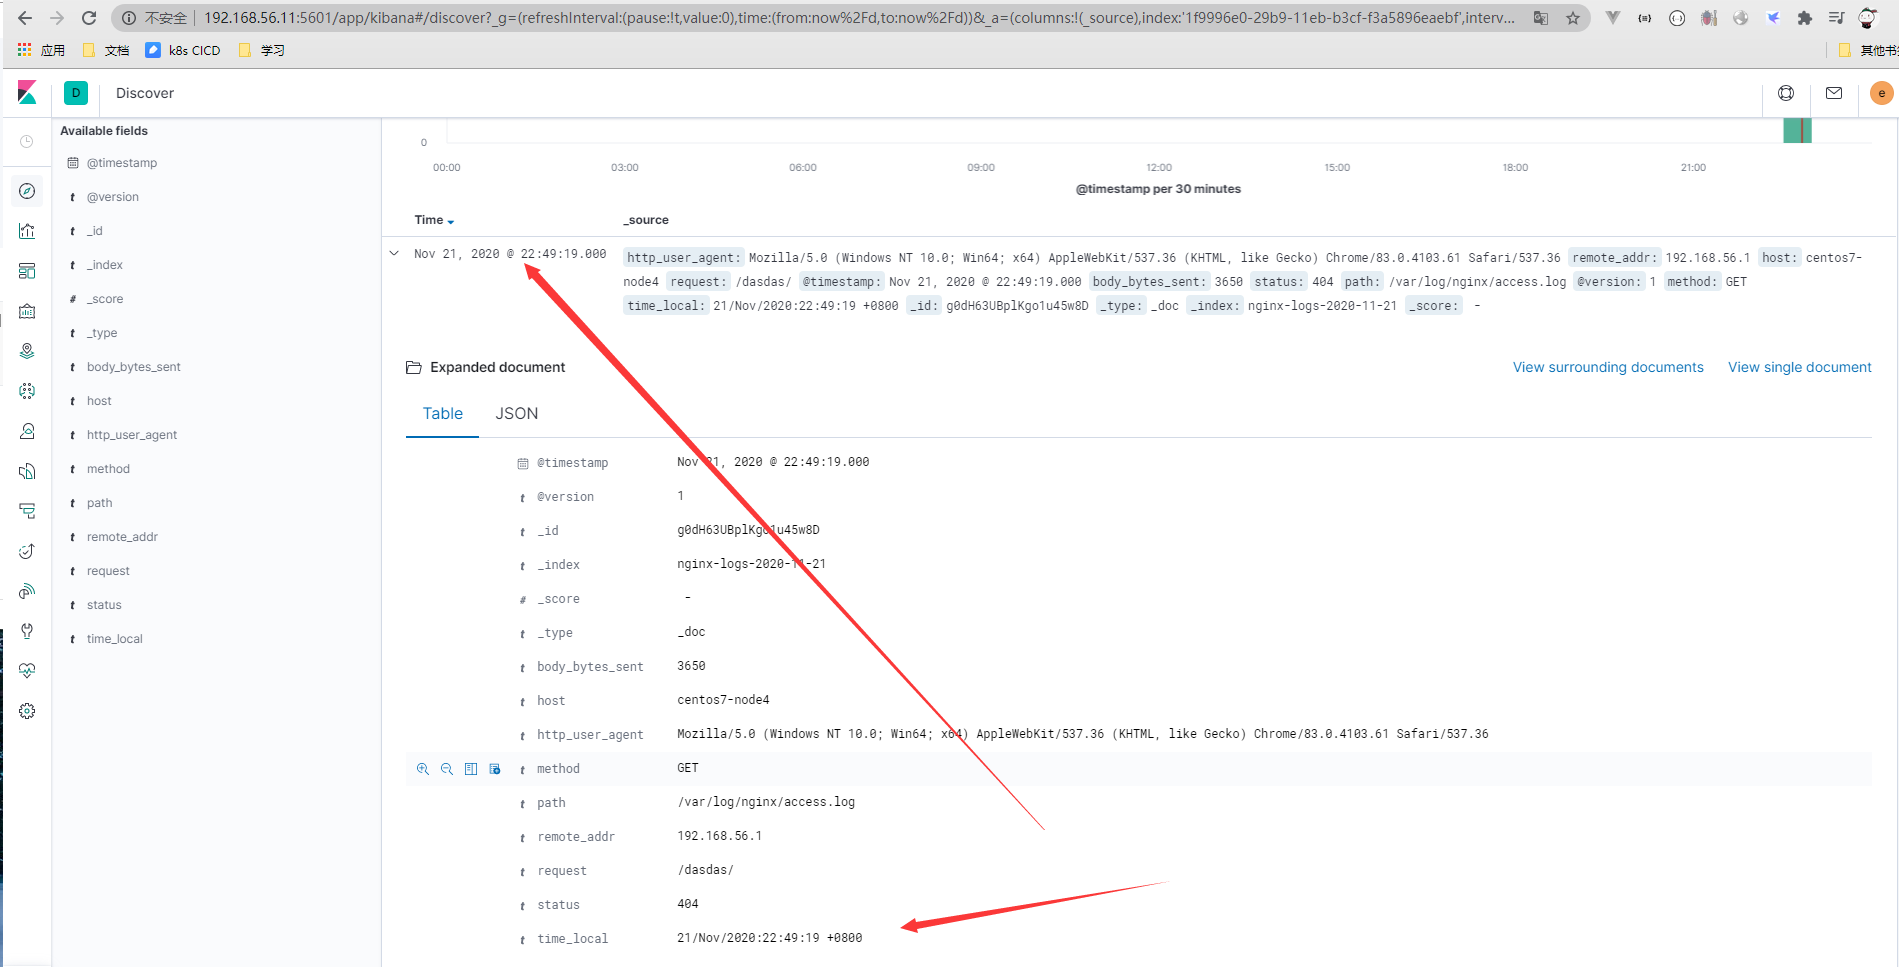
注意
日志里如果有不同的时间格式,覆盖的时候格式要对应
20/Feb/2019:14:50:06 -> dd/MMM/yyyy:HH:mm:ss
2016-08-24 18:05:39,830 -> yyyy-MM-dd HH:mm:ss,SSS
Logstash正则提取与异常处理
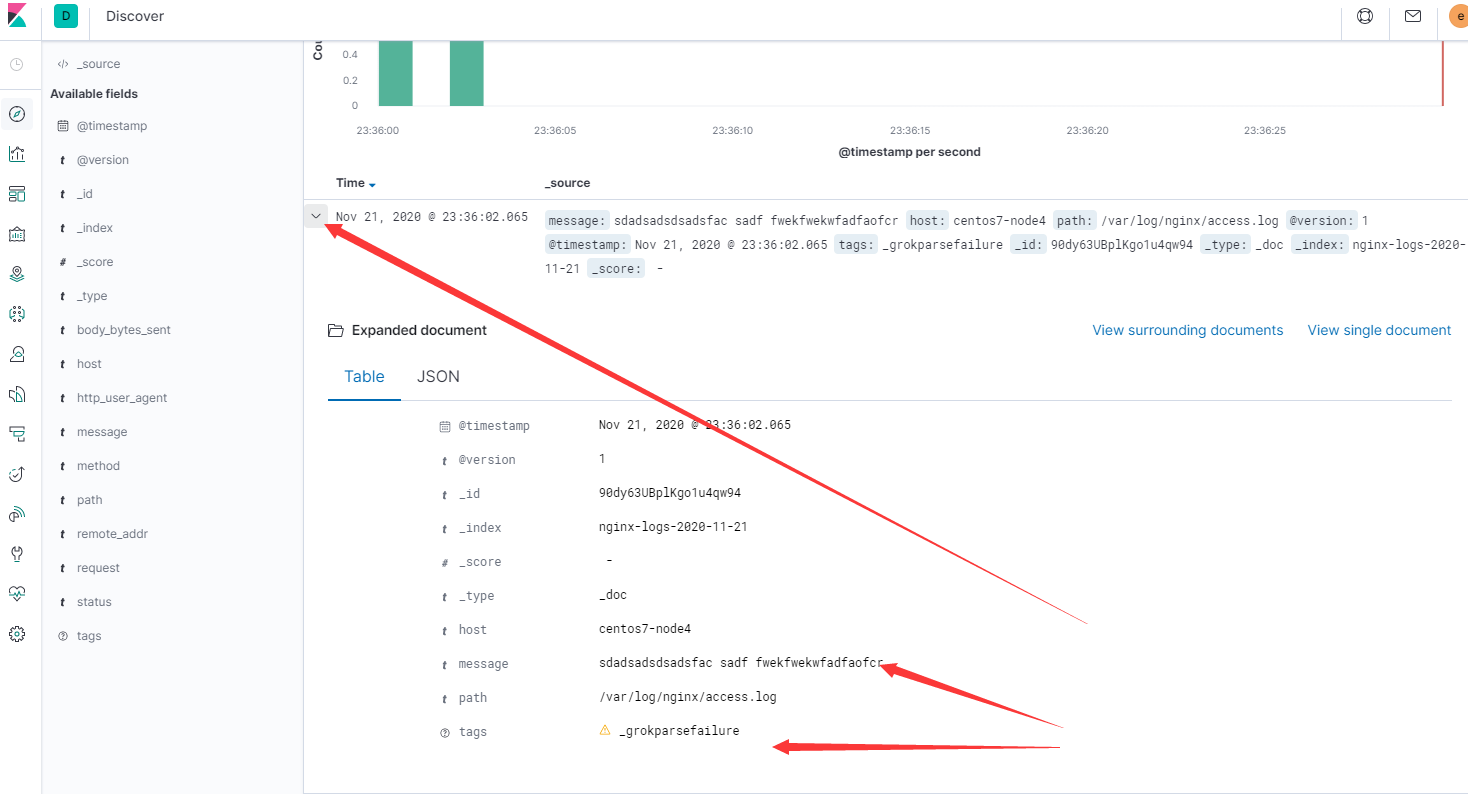
- 在nginx日志中加入异常字段
[root@centos7-node4 ~]# echo "sdadsadsdsadsfac sadf fwekfwekwfadfaofcr" >> /var/log/nginx/access.log
[root@centos7-node4 ~]# echo "sdadsadsdsadsfac sadf fwekfwekwfadfaofcr" >> /var/log/nginx/access.log
[root@centos7-node4 ~]# echo "sdadsadsdsadsfac sadf fwekfwekwfadfaofcr" >> /var/log/nginx/access.log
[root@centos7-node4 ~]# echo "sdadsadsdsadsfac sadf fwekfwekwfadfaofcr" >> /var/log/nginx/access.log
[root@centos7-node4 ~]# echo "sdadsadsdsadsfac sadf fwekfwekwfadfaofcr" >> /var/log/nginx/access.log
[root@centos7-node4 ~]# echo "sdadsadsdsadsfac sadf fwekfwekwfadfaofcr" >> /var/log/nginx/access.log
[root@centos7-node4 ~]# echo "sdadsadsdsadsfac sadf fwekfwekwfadfaofcr" >> /var/log/nginx/access.log
- kibana查看到异常的日志
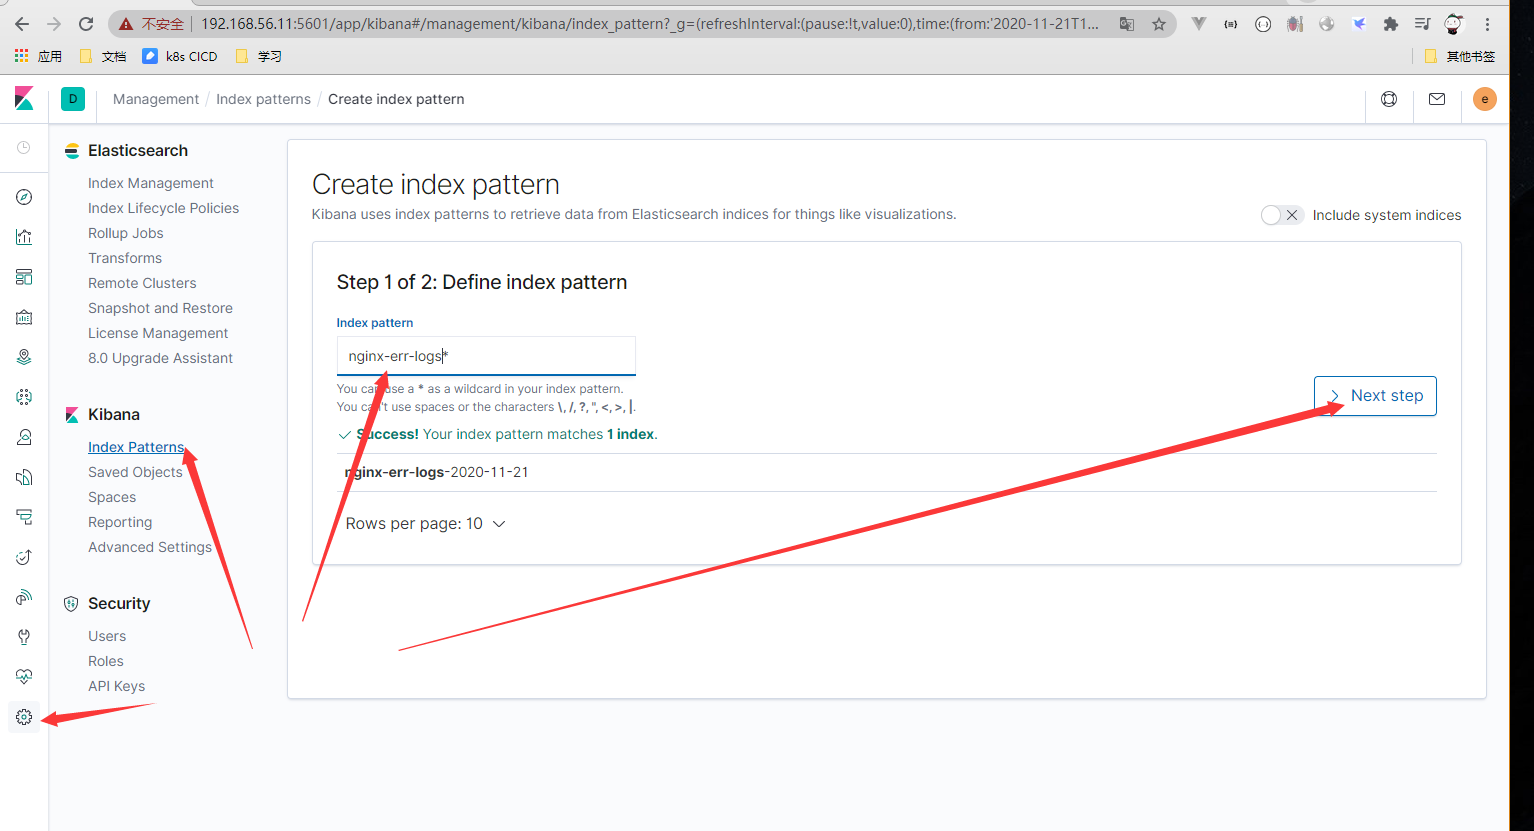
- 将异常数据发送到另外的index
[root@centos7-node4 ~]# vim /etc/logstash/conf.d/logstash.conf
input {
file {
path => "/var/log/nginx/access.log"
start_position => "beginning"
sincedb_path => "/dev/null"
}
}
hosts => ["http://192.168.238.90:9200", "http://192.168.238.92:9200"]
hosts => ["http://192.168.238.90:9200", "http://192.168.238.92:9200"]
output {
elasticsearch {
hosts => ["http://192.168.56.11:9200","192.168.56.12:9200","192.168.56.13:9200"]
user  => "elastic"
password  => "elastic"
index  => "nginx-logs-%{+YYYY-MM-dd}"
}
}

input {
file {
path => "/var/log/nginx/access.log"
start_position => "beginning"
sincedb_path => "/dev/null"
}
}

filter {
grok {
match => {
"message" => '%{IP:remote_addr} - (%{WORD:remote_user}|-) \[%{HTTPDATE:time_local}\] "%{WORD:method} %{NOTSPACE:request} HTTP/%{
NUMBER}" %{NUMBER:status} %{NUMBER:body_bytes_sent} %{QS} %{QS:http_user_agent}'
}
remove_field => ["message"]
}
date {
match => ["time_local", "dd/MMM/yyyy:HH:mm:ss Z"]
target => "@timestamp"
}
mutate {
gsub => ["http_user_agent",'"',""]
convert => { "status" => "integer" }
convert => { "body_bytes_sent" => "integer" }
remove_field => ["time_local"]
}
}

output {
if "_grokparsefailure" not in [tags] and "_dateparsefailure" not in [tags] {
elasticsearch {
hosts => ["http://192.168.56.11:9200","192.168.56.12:9200","192.168.56.13:9200"]
user => "elastic"
password => "elastic"
index => "nginx-logs-%{+YYYY-MM-dd}"
}
}
else{
elasticsearch {
hosts => ["http://192.168.56.11:9200","192.168.56.12:9200","192.168.56.13:9200"]
user => "elastic"
password => "elastic"
index => "nginx-err-logs-%{+YYYY-MM-dd}"
}
}
}
- 重启logstash
[root@centos7-node4 ~]# kill -1 $(ps -ef | grep logstash | grep -v grep | awk '{print $2}')
[root@centos7-node4 ~]# tail -f /var/log/messages
- 再次写入异常数据
[root@centos7-node4 ~]# echo "sdadsadsdsadsfac sadf fwekfwekwfadfaofcr" >> /var/log/nginx/access.log
[root@centos7-node4 ~]# echo "sdadsadsdsadsfac sadf fwekfwekwfadfaofcr" >> /var/log/nginx/access.log
[root@centos7-node4 ~]# echo "sdadsadsdsadsfac sadf fwekfwekwfadfaofcr" >> /var/log/nginx/access.log
[root@centos7-node4 ~]# echo "sdadsadsdsadsfac sadf fwekfwekwfadfaofcr" >> /var/log/nginx/access.log
- 新增kibana 数据
Kibana图形使用简介
- 模拟数据(nginx 所在机器)
[root@centos7-node4 ~]# while true;do curl 192.168.56.14/cropy666; curl 127.0.0.1; sleep 2; done
-
首页区域
可以根据时间查看访问量:每分钟访问量
可以根据某个字段查询
可以单独看某个字段的统计 -
Kibana图形有建立,选择terms去查看对应的数据
饼图的创建 pie_remote_addr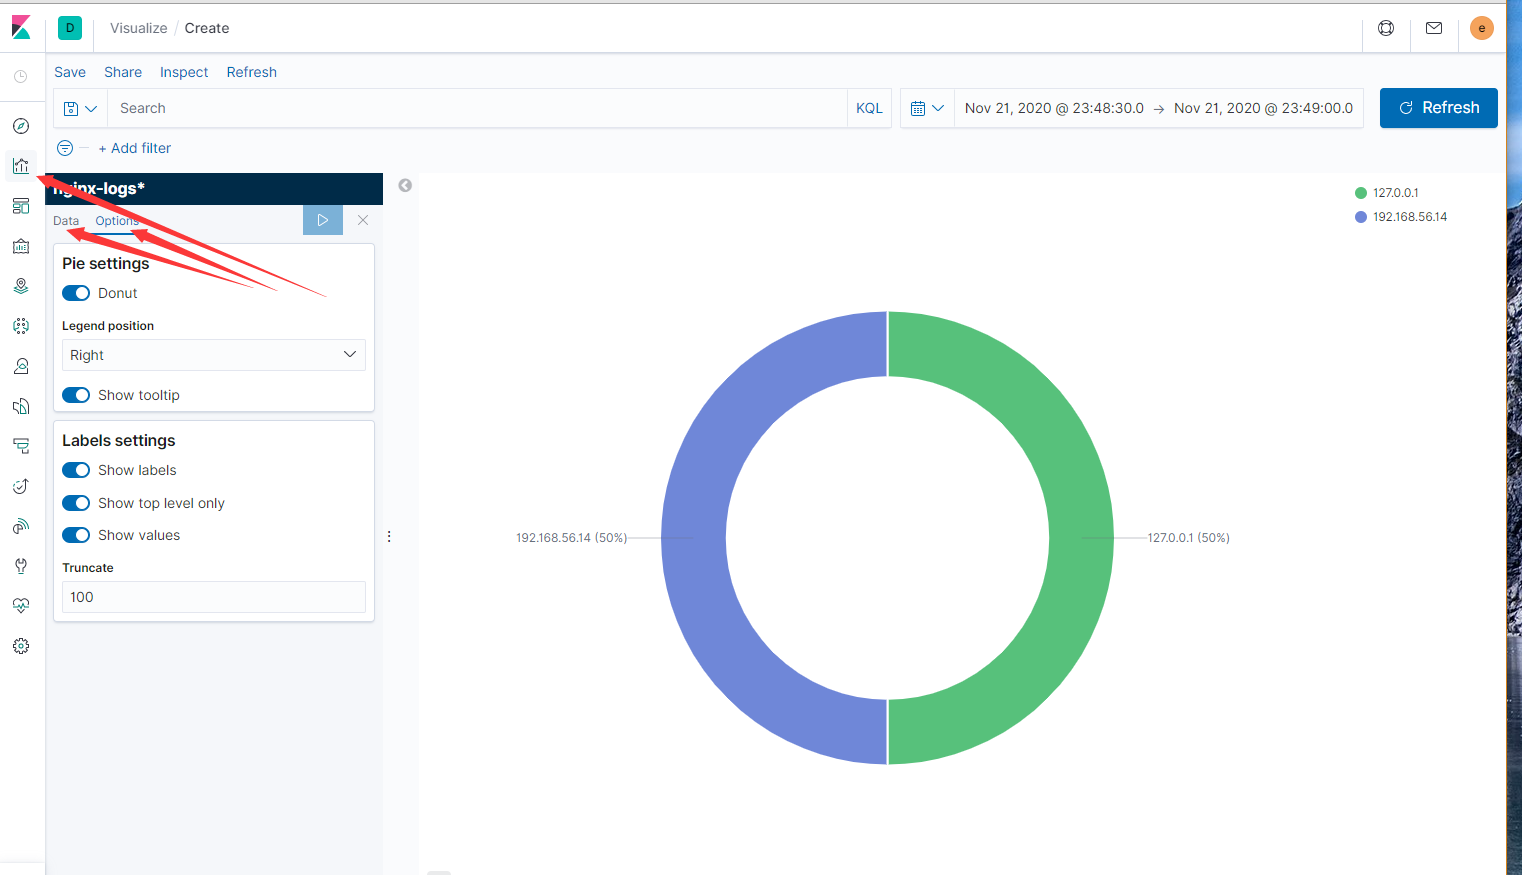
表的创建 table_remote_addr

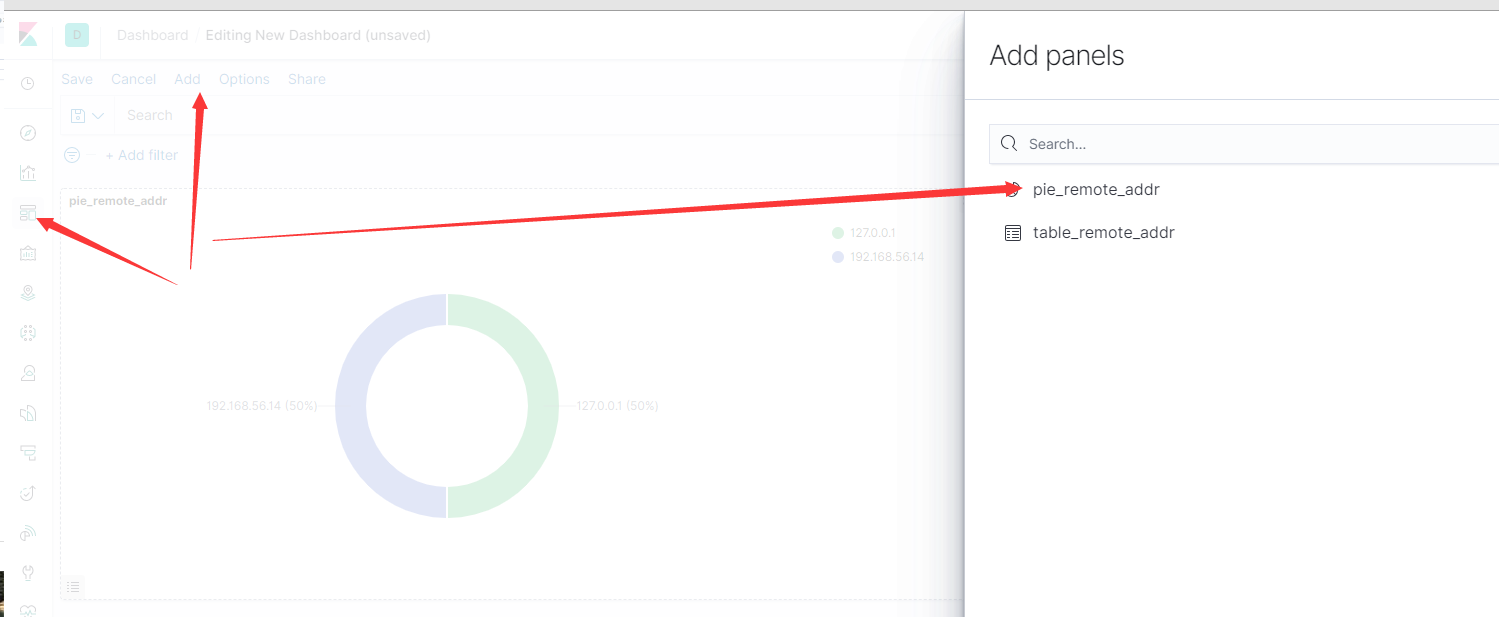
- Kibana面板的创建cropy_dash
创建面板
在面板上添加图形
- 建议采用Grafana展示
Logstash分析Linux系统日志
- 系统日志
[root@centos7-node4 ~]# cat /var/log/secure
Nov 21 20:47:54 centos7-node4 polkitd[712]: Registered Authentication Agent for unix-process:2314:2063304 (system bus name :1.177 [/usr/bin/pkttyagent --notify-fd 5 --fallback], object path /org/freedesktop/PolicyKit1/AuthenticationAgent, locale en_US.UTF-8)
Nov 21 20:47:56 centos7-node4 polkitd[712]: Unregistered Authentication Agent for unix-process:2314:2063304 (system bus name :1.177, object path /org/freedesktop/PolicyKit1/AuthenticationAgent, locale en_US.UTF-8) (disconnected from bus)
- 修改系统日志让支持年份
[root@centos7-node4 ~]# vim /etc/rsyslog.conf
# Use default timestamp format
# $ActionFileDefaultTemplate RSYSLOG_TraditionalFileFormat
$template tycformat,"%$NOW% %TIMESTAMP:8:15% %hostname% %syslogtag% %msg%\n"
$ActionFileDefaultTemplate tycformat

[root@centos7-node4 ~]# systemctl restart rsyslog
- 验证是否生效
[root@centos7-node4 ~]# tail -f /var/log/secure
Nov 21 20:47:54 centos7-node4 polkitd[712]: Registered Authentication Agent for unix-process:2314:2063304 (system bus name :1.177 [/usr/bin/pkttyagent --notify-fd 5 --fallback], object path /org/freedesktop/PolicyKit1/AuthenticationAgent, locale en_US.UTF-8)
Nov 21 20:47:56 centos7-node4 polkitd[712]: Unregistered Authentication Agent for unix-process:2314:2063304 (system bus name :1.177, object path /org/freedesktop/PolicyKit1/AuthenticationAgent, locale en_US.UTF-8) (disconnected from bus)
Nov 22 00:05:36 centos7-node4 polkitd[712]: Registered Authentication Agent for unix-process:5177:3249450 (system bus name :1.308 [/usr/bin/pkttyagent --notify-fd 5 --fallback], object path /org/freedesktop/PolicyKit1/AuthenticationAgent, locale en_US.UTF-8)
2020-11-22 00:05:36 centos7-node4 polkitd[712]: Unregistered Authentication Agent for unix-process:5177:3249450 (system bus name :1.308, object path /org/freedesktop/PolicyKit1/AuthenticationAgent, locale en_US.UTF-8) (disconnected from bus)
2020-11-22 00:06:23 centos7-node4 sshd[5191]: Accepted password for root from 192.168.56.1 port 57635 ssh2
2020-11-22 00:06:23 centos7-node4 sshd[5191]: pam_unix(sshd:session): session opened for user root by (uid=0)
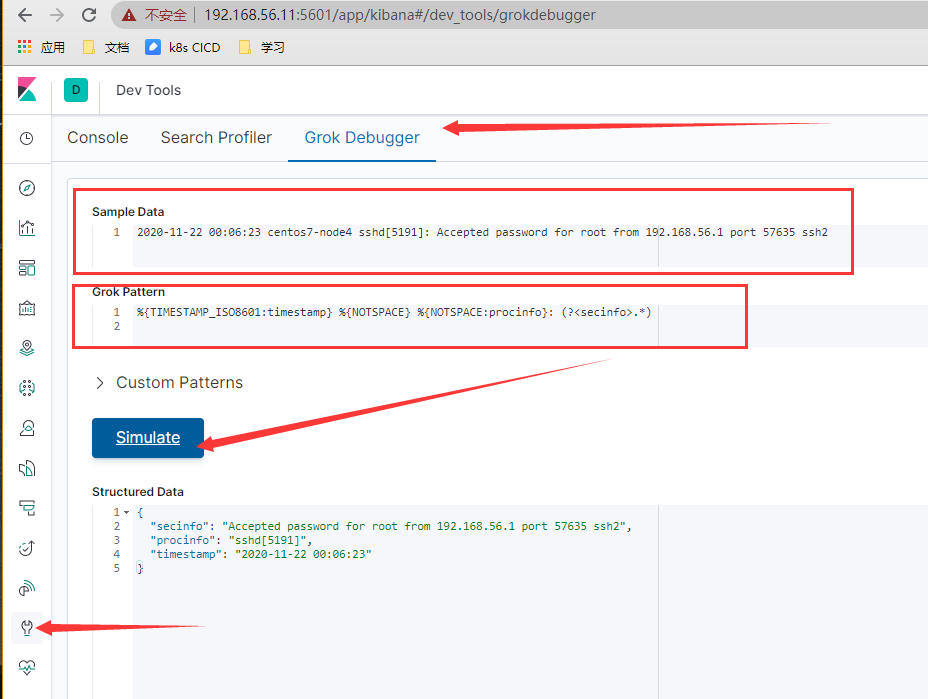
- kibana grok debug 解决日志格式问题
2020-11-22 00:06:23 centos7-node4 sshd[5191]: Accepted password for root from 192.168.56.1 port 57635 ssh2

%{TIMESTAMP_ISO8601:timestamp} %{NOTSPACE} %{NOTSPACE:procinfo}: (?<secinfo>.*)
- logstash采集系统日志(message 日志也类似)
[root@centos7-node4 ~]# chmod +r /var/log/secure
[root@centos7-node4 ~]# vim /etc/logstash/conf.d/logstash-sys.conf
input {
file {
path => "/var/log/secure"
}
}
filter {
grok {
match => {
"message" => '%{TIMESTAMP_ISO8601:timestamp} %{NOTSPACE} %{NOTSPACE:procinfo}: (?<secinfo>.*)'
}
remove_field => ["message"]
}
date {
match => ["timestamp", "yyyy-MM-dd HH:mm:ss"]
target => "@timestamp"
}
mutate {
remove_field => ["timestamp"]
}
}
output {
elasticsearch {
hosts => ["http://192.168.56.11:9200","192.168.56.12:9200","192.168.56.13:9200"]
user => "elastic"
password => "elastic"
index => "system-secure-%{+YYYY.MM.dd}"
}
}
- 重启logstash
[root@centos7-node4 ~]# systemctl restart logstash
[root@centos7-node4 ~]# tail -f /var/log/messages
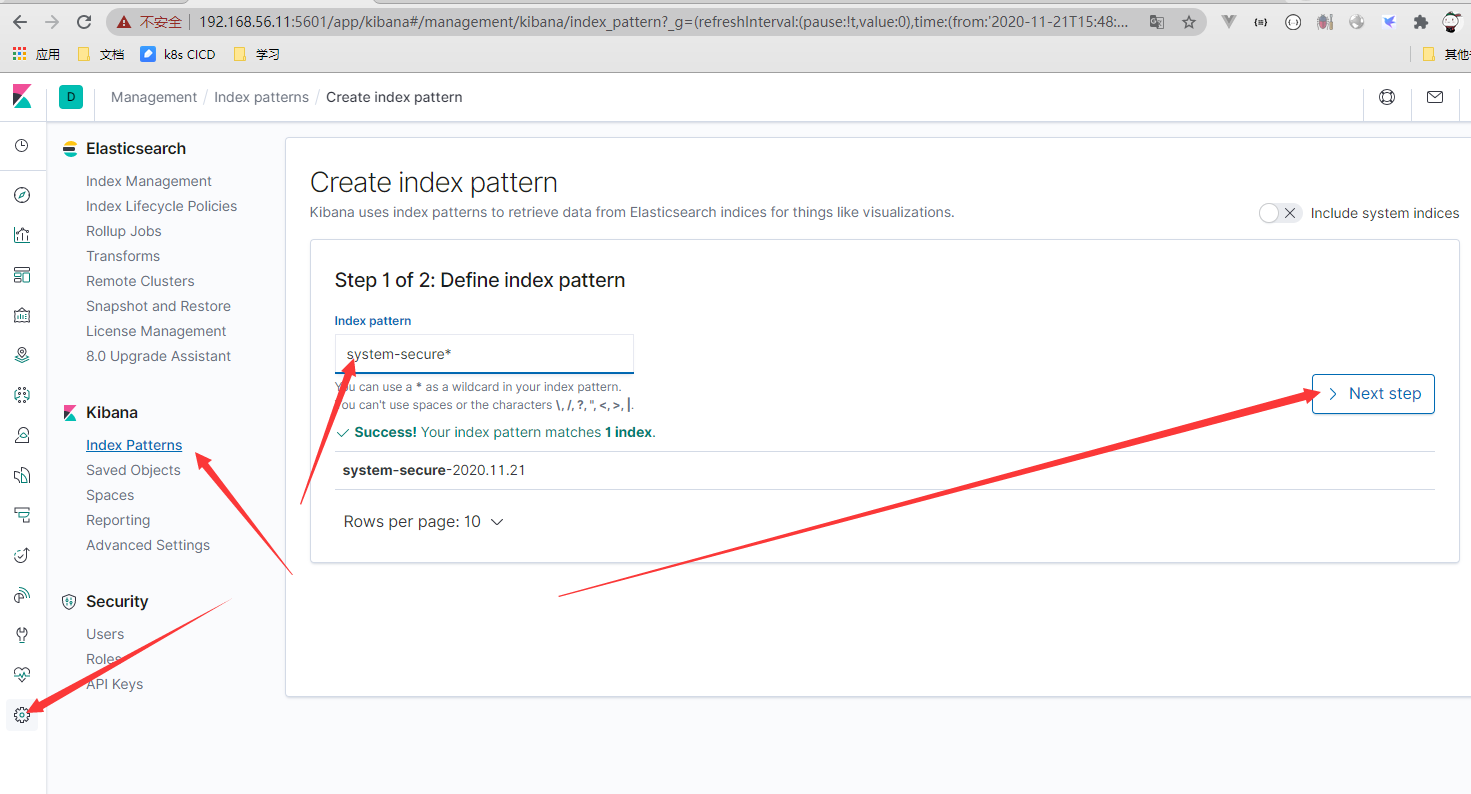
- kibana加入index

- 系统运行日志基础数据分析
- linux学习入门 基础部分(9)[1.系统日志默认分类2.日志管理服务rsyslog3.日志分析工具journa4.时间同步5.timedatectl命令]
- RHEL 5基础篇—分析系统日志
- ELK日志分析系统-ELK搭建篇
- Android应用程序框架层和系统运行库层日志系统源代码分析
- CentOS 7文件系统与日志分析详解
- python分析iis服务器系统日志
- 大数据日志分析系统-介绍
- ELK 日志分析系统
- 使用GoAccess构建简单实时日志分析系统
- 用Kibana和logstash快速搭建实时日志查询、收集与分析系统
- 企业日志大数据分析系统ELK+KAFKA实现【转】
- Android应用程序框架层和系统运行库层日志系统源代码分析
- 用Kibana和logstash快速搭建实时日志查询、收集与分析系统
- Linux系统日志分析的基本教程
- Logstash学习6_LogStash日志分析展示系统
- 搭建ELK(ElasticSearch+Logstash+Kibana)日志分析系统(五) 通过redis扩展logstash
- 【Apache运维基础(6)】Apache的日志管理与分析
- Docker 入门到实战教程(十二)ELK+Filebeat搭建日志分析系统
- 海量结构化日志分析系统