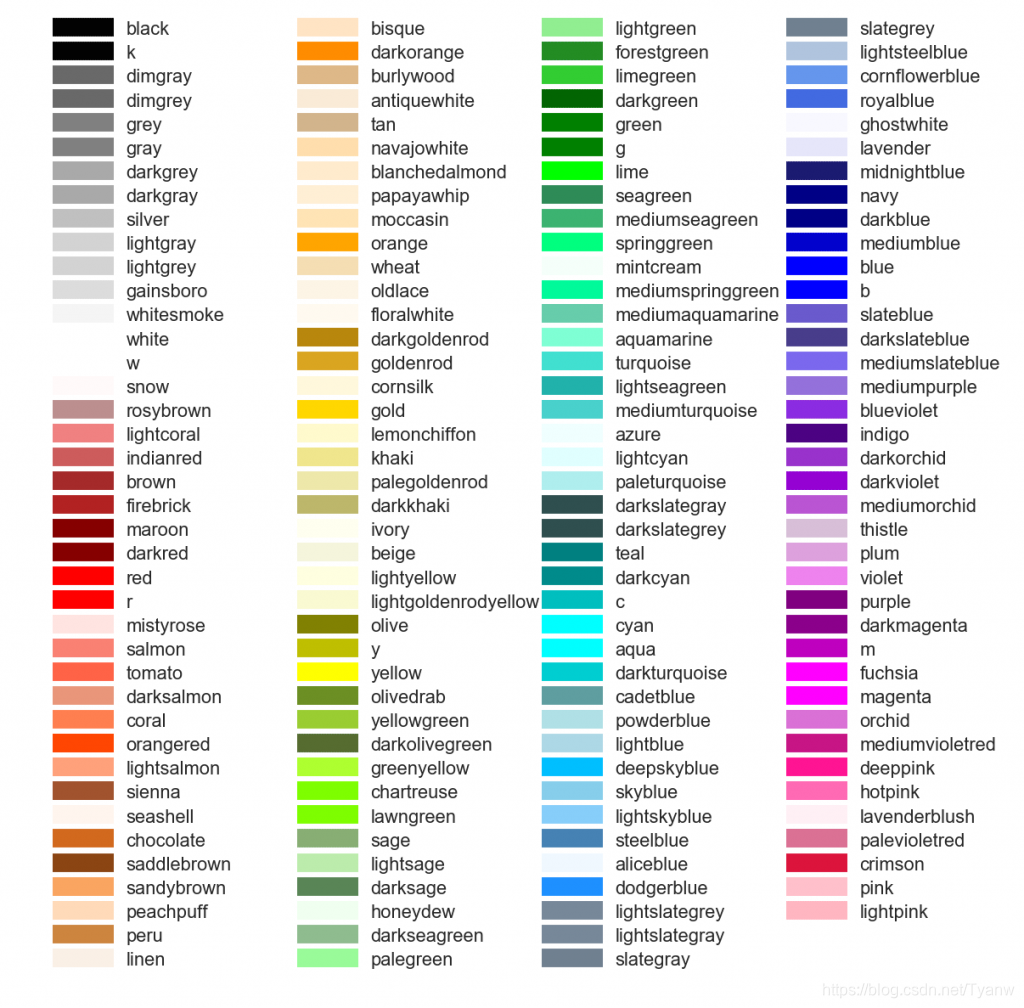
matplotlib color &次坐标轴
2020-07-16 09:54
78 查看
color = 'colorname'
fig, ax1 = plt.subplots()
ax2 = ax1.twinx()
ax1.plot(x,y)
ax2.plot(x, y, color='darkorange')

相关文章推荐
- php 验证码
- 3.2、STP原理与配置
- 3.3、RSTP原理与配置
- 5.2、FTP原理与配置
- HCIE——STP、MSTP、RSTP
- HCIE--MAC,ARP&STP
- matplotlib 库安装教程
- PHP连接MySQL数据库的三种方式
- TP5使用phpmailer发送邮件
- Yii2之数据库迁移
- 记录一次FTP遇到的坑-主动模式与被动模式
- Liunx服务管理之ftp
- Windows10系统怎么在电脑上搭建ftp服务器?ftp用户名密码忘了怎么查看?
- PHP踩坑记录之explode分割字符串函数
- PHP踩坑记录之成功解决json解析异常
- The error may involve defaultParameterMap ### The error occurred while setting paramete
- PHP将解析xml变为数组方法
- 利用laravel框架实现CMS应用
- potplay如何设置加速不变声
- Zend Studio控件安装