springboot整合Echarts绘制动态饼状及条形图
2020-02-01 08:26
681 查看
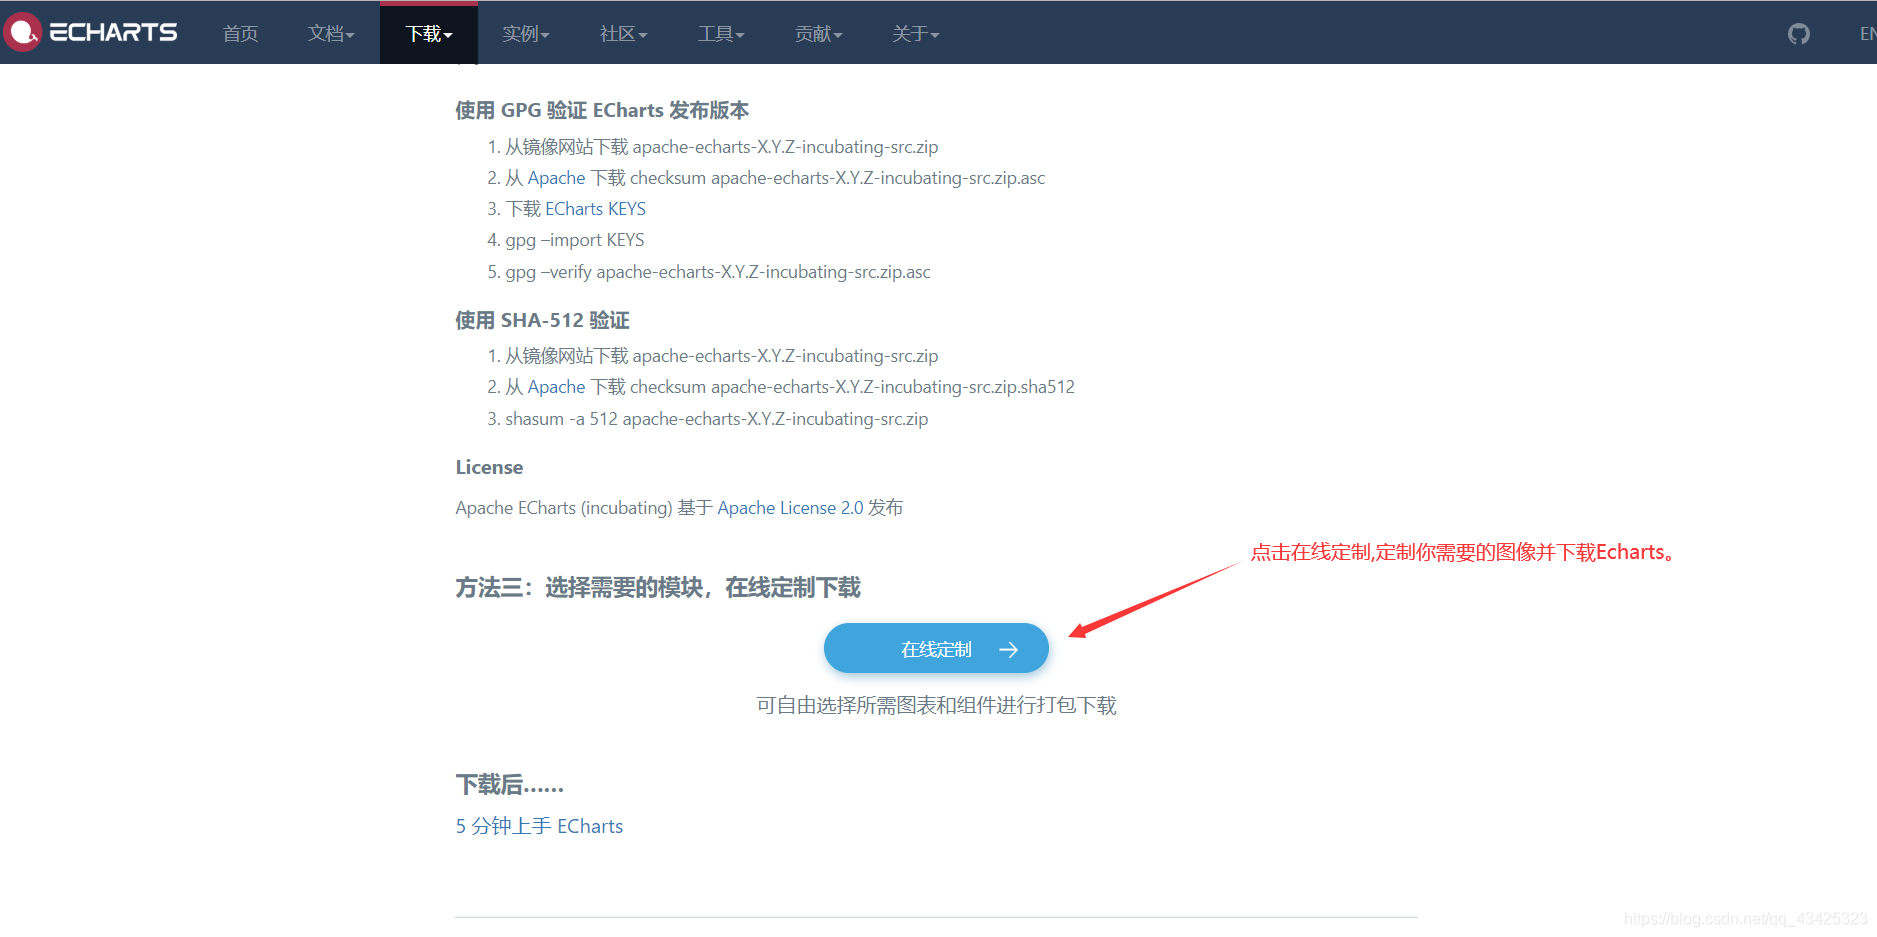
一 下载Echarts
Echarts官网: http://echarts.baidu.com/index.html

二 创建springboot项目
导入相关依赖,及配置文件(数据库自创)
将下载好的Echarts包放入静态资源文件夹下

三 编写后端代码
pojo层
package com.dy.echats.pojo;

import lombok.Data;

import javax.persistence.*;
import java.io.Serializable;

@Data
@Entity
@Table(name = "echarts")
public class Echarts  implements Serializable {

@Id
@GeneratedValue(strategy=GenerationType.IDENTITY)
@Column(name = "id")
private Integer id;

@Column(name = "name")
private String name;

@Column(name = "value")
private Integer value;
}
DAO层
package com.dy.echats.dao;

import com.dy.echats.pojo.Echarts;
import org.springframework.data.jpa.repository.JpaRepository;
import org.springframework.stereotype.Repository;

@Repository
public interface EchatsRepository extends JpaRepository<Echarts,Integer> {

}
Service层
package com.dy.echats.service;

import com.dy.echats.dao.EchatsRepository;
import com.dy.echats.pojo.Echarts;
import org.springframework.beans.factory.annotation.Autowired;
import org.springframework.stereotype.Service;

import java.util.List;

@Service
public class EchatsService {

@Autowired
EchatsRepository echatsRepository;
public List<Echarts> getdemo(){
return  echatsRepository.findAll();
}
}
controller层
package com.dy.echats.spark;

import com.dy.echats.pojo.Echarts;
import com.dy.echats.service.EchatsService;
import org.springframework.beans.factory.annotation.Autowired;
import org.springframework.web.bind.annotation.RequestMapping;
import org.springframework.web.bind.annotation.RequestMethod;
import org.springframework.web.bind.annotation.RestController;
import org.springframework.web.servlet.ModelAndView;

import java.util.List;

@RestController
public class HelloSpringBoot {
@Autowired
EchatsService echatsService;

@RequestMapping(value="/courseClickCount",method = RequestMethod.POST)
public List<Echarts> courseClickCountStat(){
return echatsService.getdemo();//跟templates文件夹下的demo.html名字一样,返回这个界面
}
}
三 编写前端JS代码
在resource\templates\下创建index.html、index2.html页面,分别显示饼状图、条形图。
条形图:
<!DOCTYPE html>
<html lang="en">
<head>
<meta charset="UTF-8">
<title>Demo</title>
<!-- 引入 ECharts 文件 -->
<script src="../static/js/echarts.min.js"></script>
<script src="../static/js/jquery-1.8.3.js"></script>
</head>
<body>
<!-- 为 ECharts 准备一个具备大小(宽高)的 DOM -->
<div id="main" style="width: 600px;height:400px;position:absolute;top:50%;left: 50%;margin-top: -200px;margin-left: -300px;"></div>

<script type="text/javascript">
// 基于准备好的dom,初始化echarts实例
var myChart = echarts.init(document.getElementById("main"));//main是<div id="main" style="width: 600px;height:400px;"></div>的id

// 指定图表的配置项和数据
var names=[];
var values=[];
//数据加载完之前先显示一段简单的loading动画
myChart.showLoading();
$.ajax({
type : "post",
async : true,            //异步请求(同步请求将会锁住浏览器,用户其他操作必须等待请求完成才可以执行)
url : "/courseClickCount",    //请求发送到dataActiont处
data : {},
dataType : "json",        //返回数据形式为json
success : function(result) {
//请求成功时执行该函数内容,result即为服务器返回的json对象
if (result) {
for(var i=0;i<result.length;i++){
names.push(result[i].name);
values.push(result[i].value);
}
myChart.hideLoading();    //隐藏加载动画
myChart.setOption(
{
title: {
text: '商品件数',
x: 'center'
},
tooltip: {
trigger: 'item',
formatter: "{a} <br/>{b} : {c} ({d}%)"
},
legend: {
orient: 'vertical',
left: 'left',
data: names
},
series: [
{
name: '物料来源',
type: 'pie',
radius: '55%',
center: ['50%', '60%'],
data: result,
itemStyle: {
emphasis: {
shadowBlur: 10,
shadowOffsetX: 0,
shadowColor: 'rgba(0, 0, 0, 0.5)'
}
}
}
]
}
);
}
},
error : function(errorMsg) {
//请求失败时执行该函数
alert("图表请求数据失败!");
myChart.hideLoading();
}
});//end ajax
</script>
</body>
</html>
效果如下:

条形图:
<!DOCTYPE html>
<html lang="en">
<head>
<meta charset="UTF-8">
<title>Title</title>
<!-- 引入 ECharts 文件 -->
<script src="../static/js/echarts.min.js"></script>
<script src="../static/js/jquery-1.8.3.js"></script>
</head>
<body>
<!-- 为 ECharts 准备一个具备大小(宽高)的 DOM -->
<div id="main" style="width: 600px;height:400px;position:absolute;top:50%;left: 50%;margin-top: -200px;margin-left: -300px;">

</div>

<script type="text/javascript">
// 基于准备好的dom,初始化echarts实例
var myChart = echarts.init(document.getElementById('main'));//main是<div id="main" style="width: 600px;height:400px;"></div>的id
// 指定图表的配置项和数据
var names=[];
var values=[];
//数据加载完之前先显示一段简单的loading动画
myChart.showLoading();
$.ajax({
type : "post",
async : true,            //异步请求(同步请求将会锁住浏览器,用户其他操作必须等待请求完成才可以执行)
url : "/courseClickCount",    //请求发送到dataActiont处
data : {},
dataType : "json",        //返回数据形式为json
success : function(result) {
//请求成功时执行该函数内容,result即为服务器返回的json对象
if (result) {
for(var i=0;i<result.length;i++){
names.push(result[i].name);
values.push(result[i].value);
}
myChart.hideLoading();    //隐藏加载动画
myChart.setOption(
{
title: {
text: '商品销量'
},
tooltip: {},
legend: {
data:['销量']
},
xAxis: {
data: names
},
yAxis: {},
series: [{
name: '销量',
type: 'bar',
data: values
}]
}
);
}
},
error : function(errorMsg) {
//请求失败时执行该函数
alert("图表请求数据失败!");
myChart.hideLoading();
}
});//end ajax
</script>
</body>
</html>
效果如下:

到此,springboot整合Echarts绘制动态饼状及条形图就完成了!
- 点赞 1
- 收藏
- 分享
- 文章举报
 Ddyu丶
发布了8 篇原创文章 · 获赞 8 · 访问量 512
私信
关注
Ddyu丶
发布了8 篇原创文章 · 获赞 8 · 访问量 512
私信
关注

相关文章推荐
- Spring Boot整合Echarts对数据库表数据绘制静态数据柱状图、饼图
- SpringBoot系列十一:SpringBoot整合Restful架构(使用 RestTemplate 模版实现 Rest 服务调用、Swagger 集成、动态修改日志级别)
- SpringBoot整合Quartz-动态读取任务执行(2.2.1)
- springboot整合Quartz实现动态配置定时任务
- springboot+shiro+redis(单机redis版)整合教程-续(添加动态角色权限控制)
- SpringBoot整合mybatis、shiro、redis实现基于数据库的细粒度动态权限管理系统实例
- SpringBoot整合mybatis、shiro、redis实现基于数据库的细粒度动态权限管理系统实例(转)
- spring boot 整合swagger2 实现动态生成接口文档
- SpringBoot+Echarts+SpringDataJpa实现请求后台数据显示饼状图和条形图
- SpringBoot整合mybatis、shiro、redis实现基于数据库的细粒度动态权限管理系统实例
- springboot整合rabbitmq,动态创建queue和监听queue
- spring-boot 整合JSP实现java web动态应用程序
- springboot动态配置定时任务2种方式,整合Quartz多线程并发执行多个定时任务配置
- springboot 学习(整合动态数据源 及 各个spring-boot-starter)
- springboot动态配置定时任务2种方式,整合Quartz多线程并发执行多个定时任务配置
- springboot整合echarts
- SpringBoot+Echarts实现请求后台数据显示饼状图
- SpringBoot整合mybatis、shiro、redis实现基于数据库的细粒度动态权限管理系统实例
- springboot整合Quartz实现动态配置定时任务
- springboot整合Quartz实现动态配置定时任务