python编程从入门到实践——数据可视化之使用api(第17章)
2020-01-14 06:48
585 查看
python 之api使用
这章主要介绍requests模块 请求网页url获取数据(通常为json/csv),实现通过api请求GitHub数据处理响应返回体数据,
这里是返回字典,所以对字典处理通过筛选、排序得到星级数对应项目名的映射,再利用Pygal实现可视化,这节还挑出对于style包的运用可以灵活自定义图表的样式,使得界面更美化实用。
这节内容较少但实用。
目录
hn_submission.py是用Hacker News网站api调用的实验
代码
python_repos.py
"""
查询github目前所有托管的python项目星级最高的信息绘制对应直方图
自定义图表的样式和添加描述、超链接
"""
import requests
import pygal
from pygal.style import LightColorizedStyle as LCS, LightenStyle as LS
URL = 'https://api.github.com/search/repositories?q=language:python&sort=stars'
def print_information(repo_dict):
"""打印筛选后的数据"""
print('Name:', repo_dict['name'])
print('Owner:', repo_dict['owner']['login'])
print('Stars:', repo_dict['stargazers_count'])
print('Repository:', repo_dict['html_url'])
print('Created:', repo_dict['created_at'])
print('Updated:', repo_dict['updated_at'])
print('Description:', repo_dict['description'])
def get_url_items(url):
"""从url调用接口请求获取"""
r = requests.get(url)
print("status code:", r.status_code)
# 将api响应存储在一个变量中
ressponse_dict = r.json()
print('Total Repositories is:', ressponse_dict['total_count'])
print(ressponse_dict.keys())
return ressponse_dict['items']
def _main__():
"""主函数
绘制githab上星级的所有项目直方图"""
# 执行api调用并存储响应 sort 按星级排序
repo_dicts = get_url_items(URL)
# 研究第一个仓库
repo_dict = repo_dicts[0]
print(repo_dict, "\nkeys:", len(repo_dict))
# for key in repo_dict.keys():
# print(key)
# 打印第一个项目的信息
print('\nSelected information about first repository:')
print_information(repo_dict)
# 获取每个项目的信息
names, stars, links = [], [], []
for repo_dict in repo_dicts:
names.append(repo_dict['name'])
stars.append(repo_dict['stargazers_count'])
links.append(repo_dict['html_url'])
# pygal绘制每个项目对应星数的直方图
# style模块设置图表的样式color深蓝色 背景为浅灰色
my_style = LS(color='#333366', base_style=LCS)
# 自定义设置样式
my_conf = pygal.Config() # 创config实例
my_conf.x_label_rotation = 45 # x标签旋转程度
my_conf.show_legend = False # 是否隐藏图例
my_conf.title_font_size = 24 # 图表标题大小
my_conf.label_font_size = 14 # 图表标签大小
my_conf.truncate_label = 15 # 将标签长度限制在15
my_conf.show_y_guides = False # 隐藏水平线
my_conf.width = 1000 # 设置图表显示的宽度
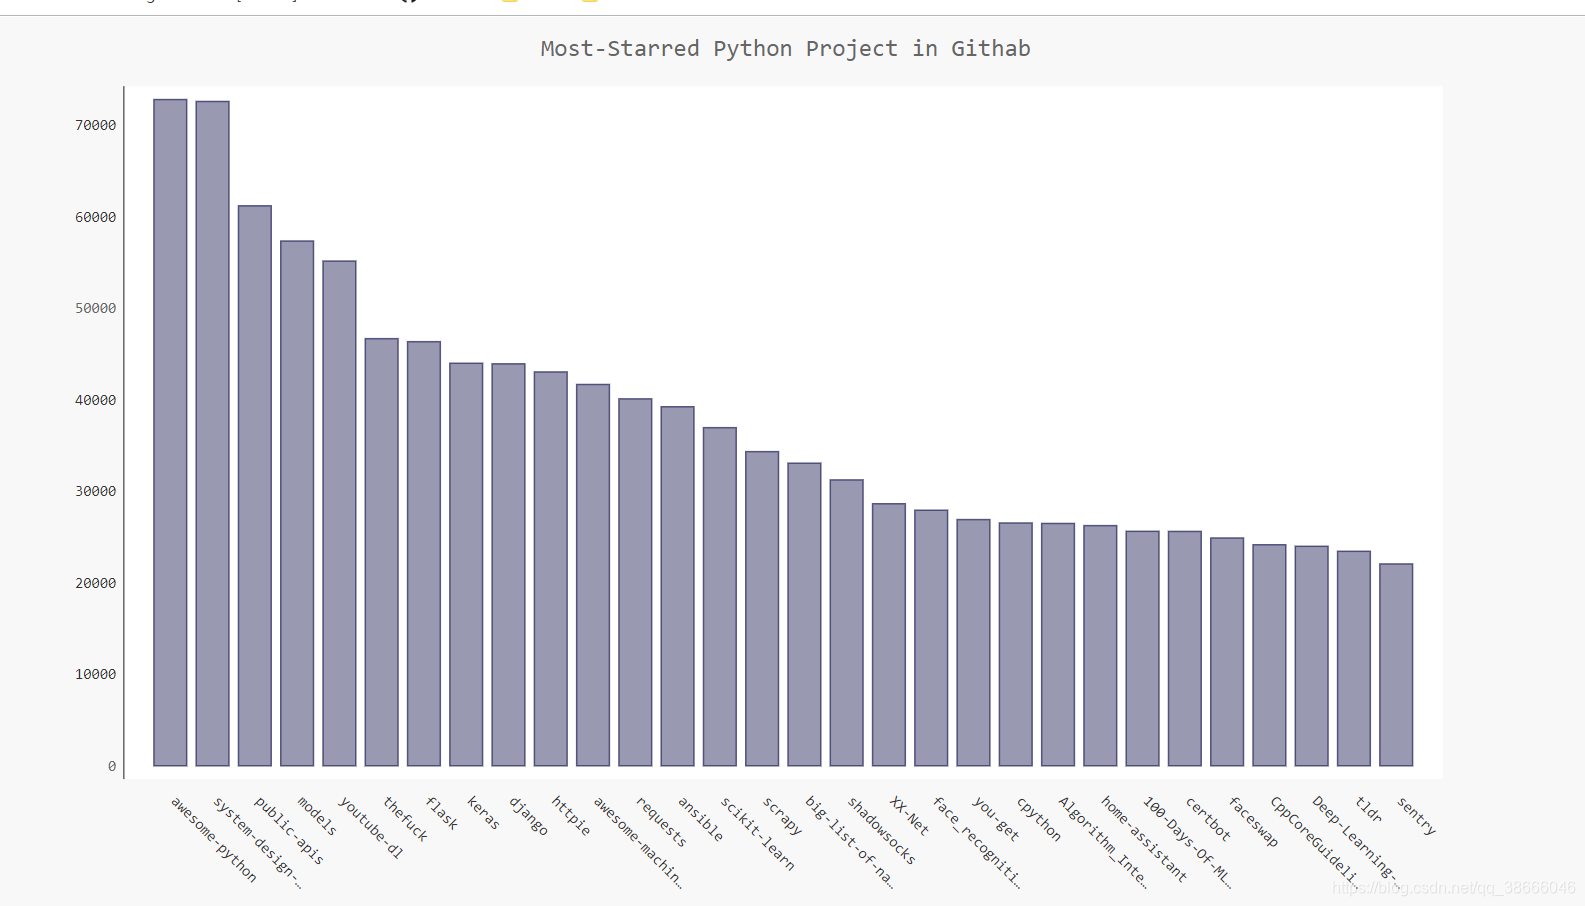
chart = pygal.Bar(my_conf, style=my_style)
chart.title = 'Most-Starred Python Project in Githab'
chart.x_labels = names
chart.add('', stars)
chart.render_to_file('python_repos.svg')
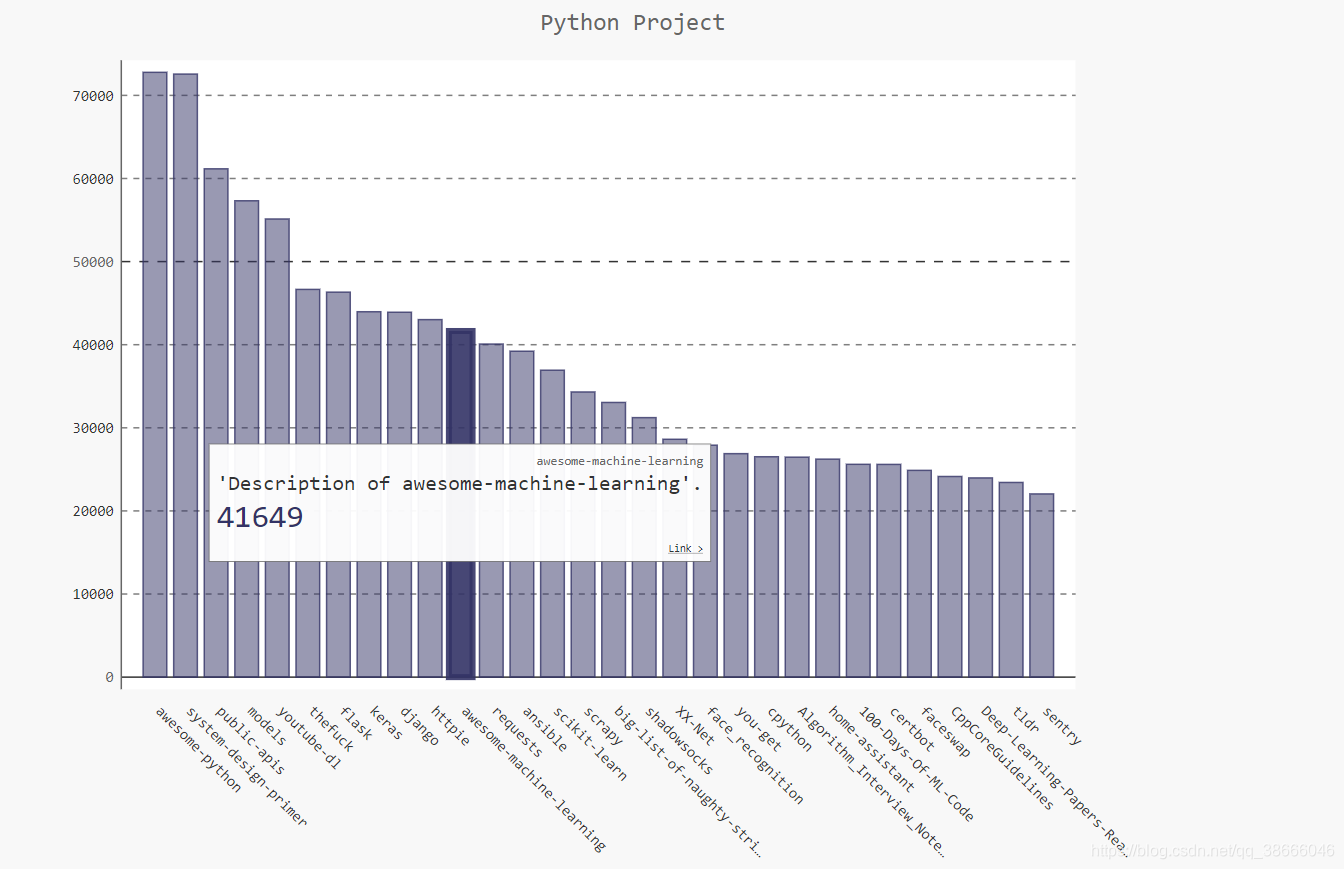
# 自定义工具提示和添加link,add()方法接受str和字典
# style模块设置图表的样式color深蓝色 背景为浅灰色,x标签旋转45°,隐藏图例
chart = pygal.Bar(style=my_style, x_label_rotation=45, show_legend=False)
plot_dicts = [] # 以字典形式传给add()
for num in range(len(stars)):
dict = {}
dict['value'] = stars[num]
dict['label'] = "'Description of " + names[num] + "'."
dict['xlink'] = links[num] # 给条形加项目链接
plot_dicts.append(dict)
print(plot_dicts)
chart.x_labels = names
chart.title = 'Python Project'
chart.add('', plot_dicts)
chart.render_to_file('bar_description.svg')
_main__()
运行结果
- 点赞
- 收藏
- 分享
- 文章举报
 一枚纯色考拉
发布了6 篇原创文章 · 获赞 0 · 访问量 360
私信
关注
一枚纯色考拉
发布了6 篇原创文章 · 获赞 0 · 访问量 360
私信
关注

相关文章推荐
- Python编程从入门到实践 -----第2章:变量和简单数据类型(课后习题答案)
- Python编程从入门到实践笔记——变量和简单数据类型
- Python编程从入门到实践笔记——变量和简单数据类型
- Python编程:从入门到实践 学习笔记 基础知识(一) 变量与简单数据类型
- python 编程从入门到实践 第二章 变量和简单数据类型
- Python编程从入门到实践笔记——异常和存储数据
- Python微博地点签到大数据实战 微博API的使用
- python Django 1.7 中文入门 (官网) 07 Django的API使用
- Python数据挖掘入门与实践 彩图 pdf
- Linux进程间通信(IPC)编程实践(七)共享内存的使用-System V共享内存(API)
- 使用python及百度API对百度poi数据进行爬取(三)
- ArcGIS Python API可视化及分析系列教程(一):入门与简介
- 5 种使用 Python 代码轻松实现数据可视化的方法
- python爬虫"Hello World"级入门实例(二),使用json从中国天气网抓取数据
- 《python数据挖掘入门与实践》笔记1
- 数据可视化学习:使用API
- python编程 从入门到实践 第五章 条件判断语句
- [置顶] python爬虫实践——零基础快速入门(五)将爬取的数据存到本地
- python数据挖掘入门与实践---用图挖掘找到感兴趣的人
- python 从入门到实践 第五章习题 (高级编程技巧 week3-1)