基于pygal对GitHub最受欢迎的python项目做可视化分析
2019-05-07 23:05
309 查看
众所周知,GItHub是可以调用API的
API:Web API 是网站的一部分,用于与使用非常具体的URL请求特定信息的程序交互。 这种请求称为API调用。请求的数据将以易于处理的格式(如JSON或CSV)返回。依赖于外部数据资源的大多数应用程序都依赖于API的调用, 如集成社交媒体网站的应用程序。
实现代码如下:
[code]# -*- coding: utf-8 -*-
"""
API 的使用
@author: xiaozuo
"""
import requests
import pygal
from pygal.style import LightColorizedStyle as LCS, LightenStyle as LS
# 执行API调用并存储响应
# http://api.github.com/ 将请求发送到github网站中响应调用API调用的部分
# search/repositories 让API搜索GitHub上的所有仓库
# 问号表示要传递一个实参, q表示查询 =让我们能够开始指定查询(q=)
# language:python 只想要关于python的仓库信息
# &sort=stars 项目按其获得的星级进行排序
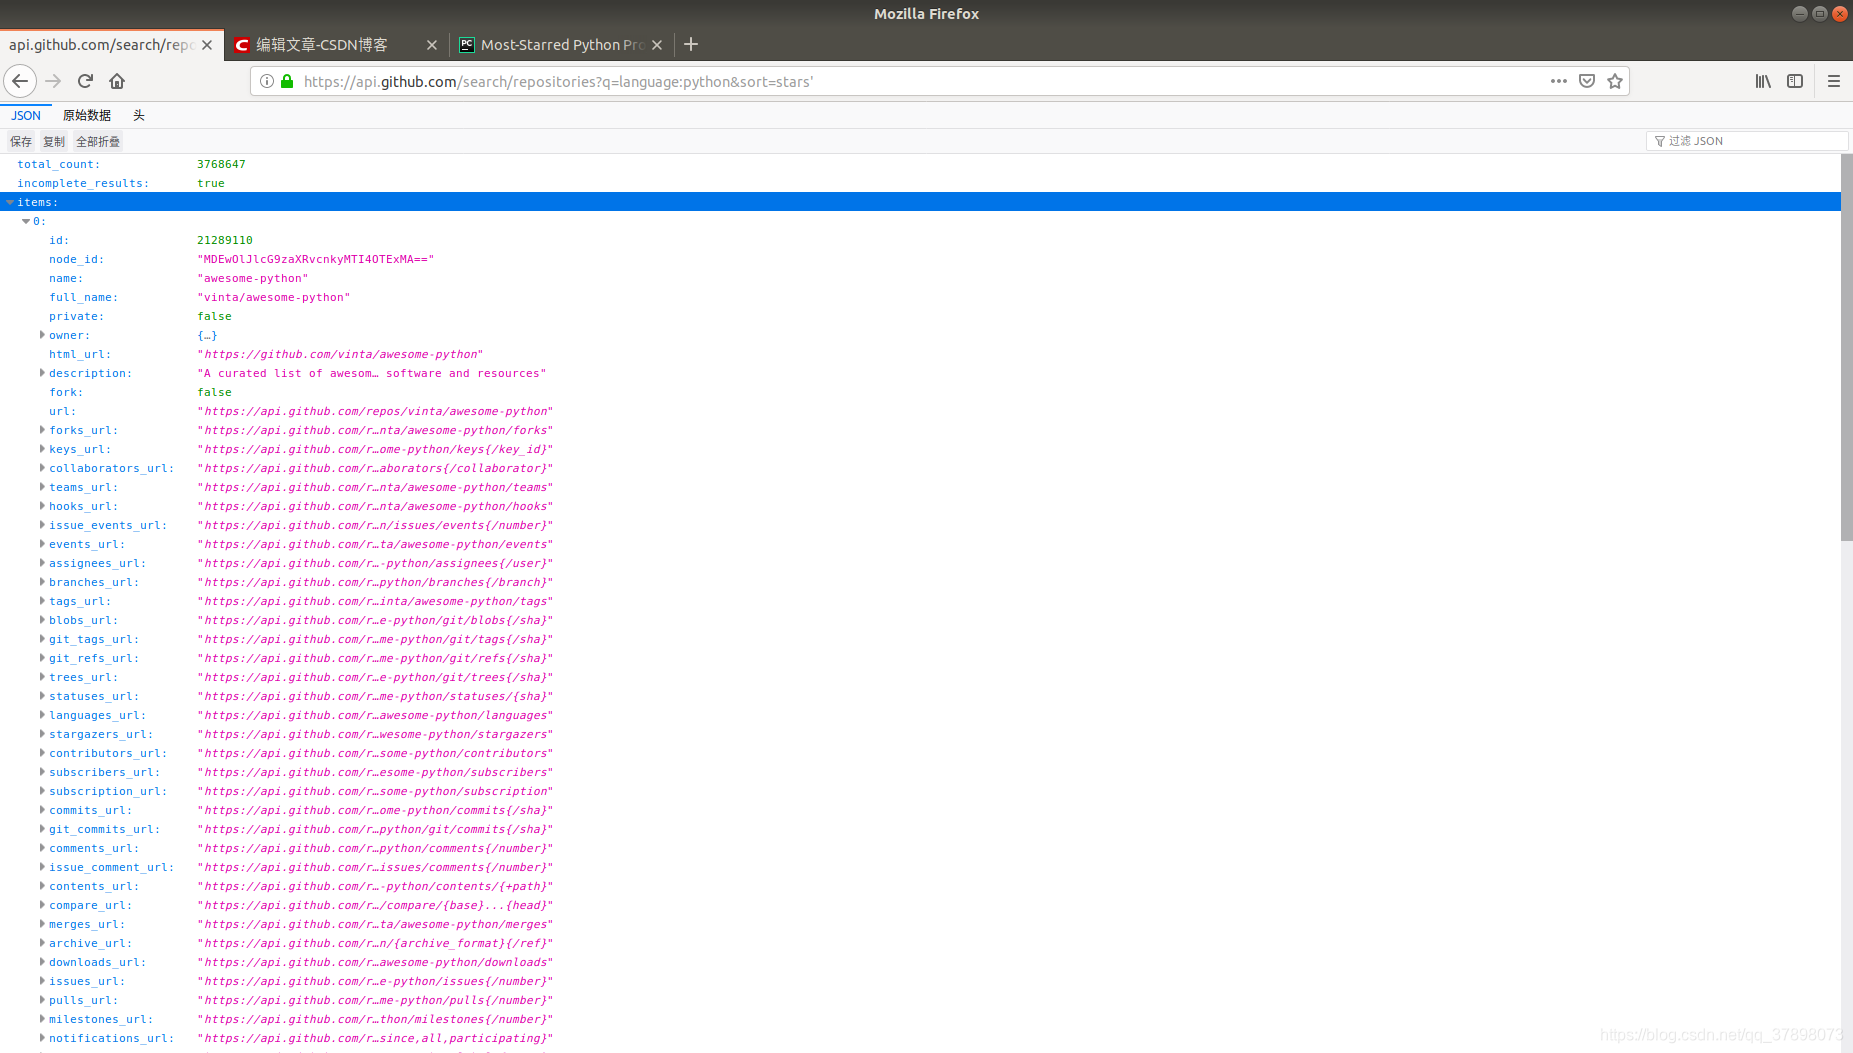
url = 'https://api.github.com/search/repositories?q=language:python&sort=stars'
r = requests.get(url)
print("Status code:", r.status_code)
# 将API响应存储在一个变量中
response_dict = r.json()
print("Total repositories:", response_dict['total_count'])
# 探索有关仓库的信息
repo_dicts = response_dict['items']
names, plot_dicts = [], []
for repo_dict in repo_dicts:
names.append(repo_dict['name'])
plot_dict = {
'value': repo_dict['stargazers_count'], # star数
'label': str(repo_dict['description']), # 描述
'xlink': repo_dict['html_url'], # 链接
}
plot_dicts.append(plot_dict)
#可视化
my_style = LS('#333366', base_style=LCS)
my_config = pygal.Config() # 创建了一个Pygal类Config的实例,命名为my_cpnfig 通过修改my_config的属性, 定制图形外观
my_config.x_label_rotation = 45 # X旋转45度
my_config.show_legend = False # 隐藏图例
my_config.title_font_size = 24
my_config.label_font_size = 14
my_config.major_label_font_size = 18
my_config.truncate_label = 15 # 名字字符限制为15
my_config.show_y_guides = False # 隐藏图表中的水平线
my_config.width = 1000 # 自定义宽度, 让图表充分利用浏览器的可用空间
chart = pygal.Bar(my_config, style=my_style)
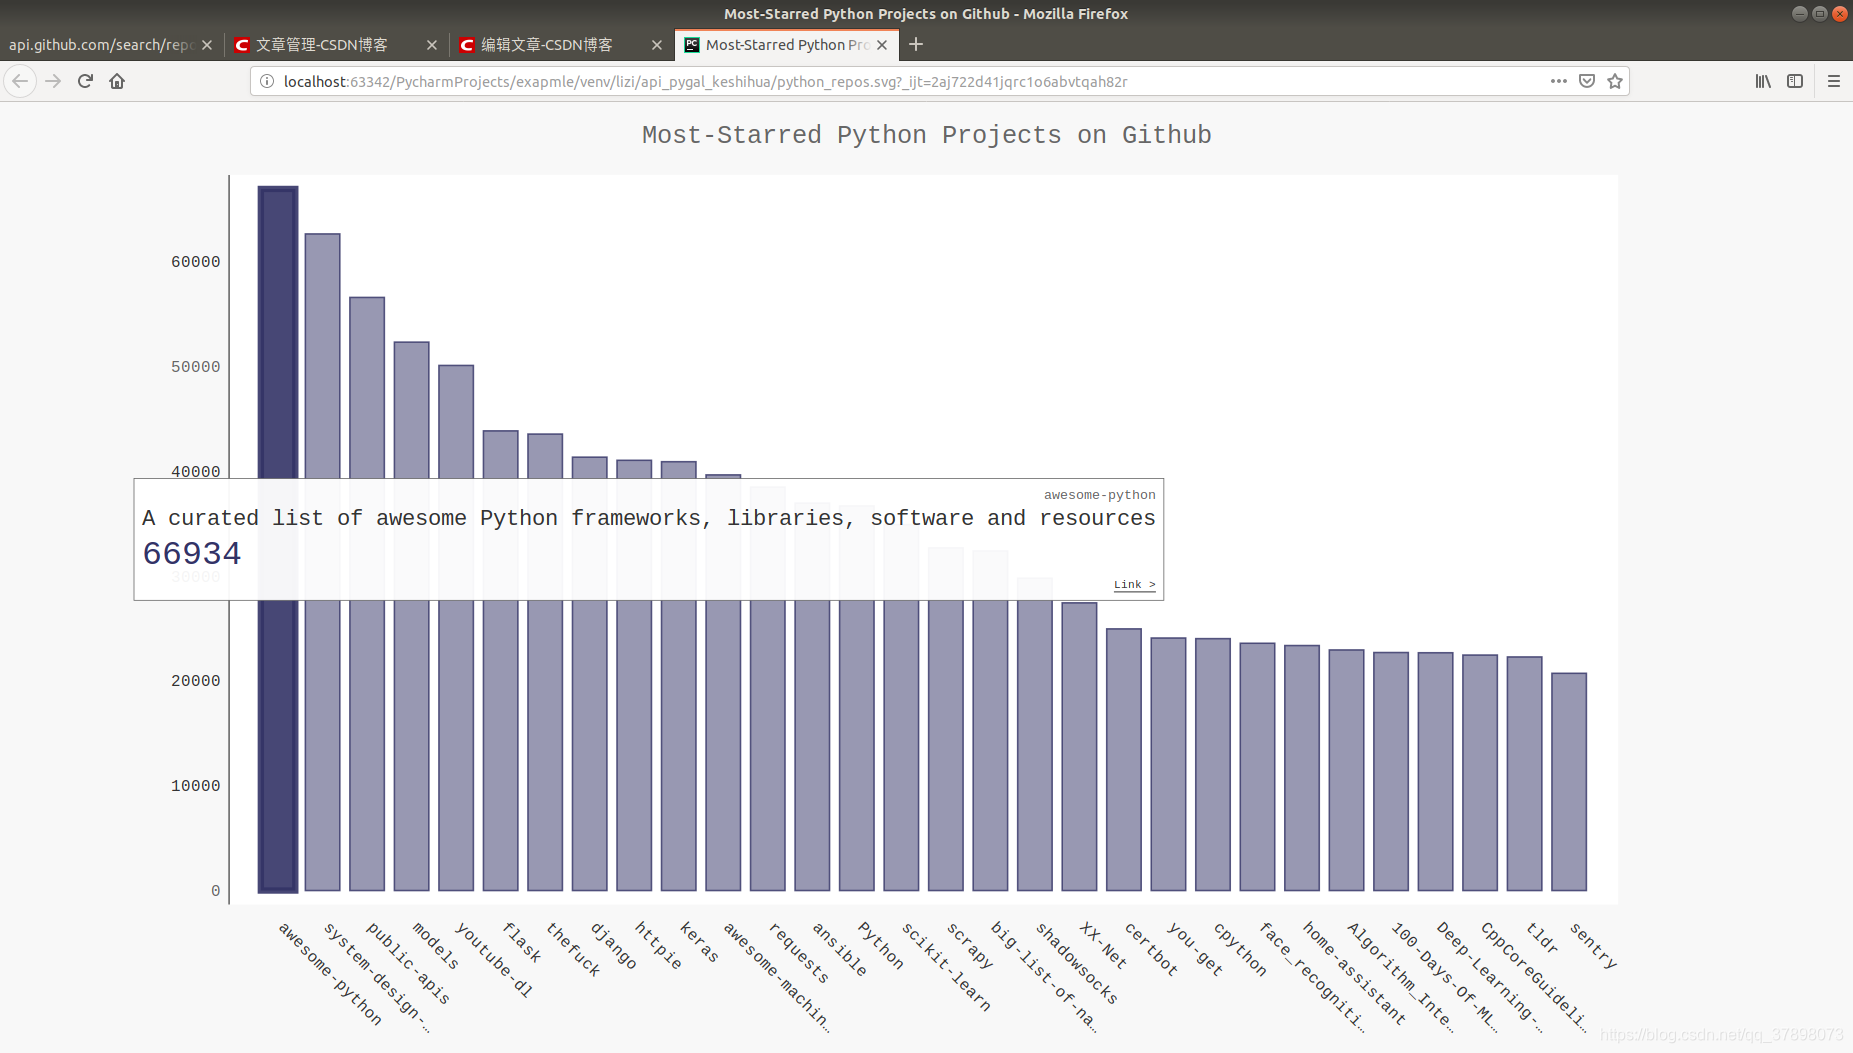
chart.title = 'Most-Starred Python Projects on Github'
chart.x_labels = names
chart.add('', plot_dicts)
chart.render_to_file('python_repos.svg')
结果:
GtiHub API调用:

相关文章推荐
- [源码和文档分享]基于python的B站弹幕数据分析(爬虫+可视化)
- 【Python-3.5】Pygal模拟骰子点数,分析结果可视化
- Pygal可视化github项目信息
- Python 数据分析微专业课程--项目05 多场景下的图表可视化表达
- [源码和文档分享]基于python的B站弹幕数据分析(爬虫+可视化)
- Github社区python项目数据分析
- 基于Python项目的Redis缓存消耗内存数据简单分析(附详细操作步骤)
- Python 爬取Github上Star最多的python项目并可视化
- [源码和文档分享]基于python的B站弹幕数据分析(爬虫+可视化)
- 利用python数据分析——基于Seaborn模块可视化
- 基于pandas python的美团某商家的评论销售数据分析(可视化)
- 40个GitHub上最受欢迎的iOS开源项目
- python数据可视化:基于pyecharts的BI数据大屏
- 基于Docker构建Python后端项目落地总结
- windows下基于gitbash上传项目到github
- 基于Hadoop+Hive+Sqoop+HBase+Zookeeper+MySql日志统计分析项目
- Python 数据分析微专业课程--项目04 多场景下的算法构建
- Net 项目构建基于Jenkins + Github + Mono 的持续集成环境
- python可视化包pygal的安装(利用pip)
- Python 数据分析微专业课程--项目08 中国姓氏排行研究