Python-计算机视觉编程(一)---图像处理
2019-03-04 22:52
405 查看
Python-计算机视觉编程(一)
第一章 图像处理基础
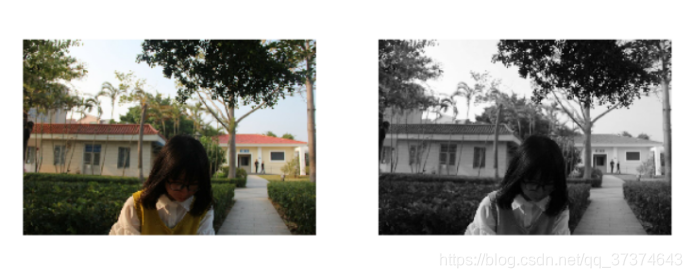
1.1 灰度图
主要内容灰度化,在RGB模型中,如果R=G=B时,则彩色表示一种灰度颜色,其中R=G=B的值叫灰度值,因此,灰度图像每个像素只需一个字节存放灰度值(又称强度值、亮度值),灰度范围为0-255。以下是将彩色图做灰度处理转化为灰度图,利用的是pylab中的gray()。
示例代码# -*- coding: utf-8 -*-
from PIL import Image
from pylab import *
pil_im = Image.open("me.jpg")
gray() # 灰度处理
subplot(121)
axis('off')
imshow(pil_im) # 显示图片
pil_im = Image.open("me.jpg").convert('L')
subplot(122)
axis('off')
imshow(pil_im)
show()
运行结果
1.2 调整尺寸及旋转
主要内容要对一幅图像的尺寸进行调整,可以调用resize()方法,元组中放置的便是你要调整尺寸的大小。如果要对图像进行旋转变换的话,可以调用rotate()方法。以下是对图片进行灰度处理、拷贝原图粘贴到原图上、调整重新设置图片的尺寸和进行图片旋转
示例代码# -*- coding: utf-8 -*-
from PIL import Image
from pylab import *
from matplotlib.font_manager import FontProperties
font = FontProperties(fname=r"c:\windows\fonts\SimSun.ttc", size=14)
figure()
pil_im = Image.open("me.jpg")
print pil_im.mode, pil_im.size, pil_im.format
subplot(231)
title(u'原图', fontproperties=font)
axis('off')
imshow(pil_im)
pil_im = Image.open("me.jpg").convert('L')
gray()
subplot(232)
title(u'灰度图', fontproperties=font)
axis('off')
imshow(pil_im)
pil_im = Image.open("me.jpg")
box = (100,100,400,400)
region = pil_im.crop(box)
region = region.transpose(Image.ROTATE_180)
pil_im.paste(region,box)
subplot(233)
title(u'拷贝粘贴区域', fontproperties=font)
axis('off')
imshow(pil_im)
# 缩略图
pil_im = Image.open("me.jpg")
size = 128, 128
pil_im.thumbnail(size)
print pil_im.size
subplot(234)
title(u'缩略图', fontproperties=font)
axis('off')
imshow(pil_im)
pil_im = Image.open("me.jpg")
pil_im = pil_im.resize(size)
print pil_im.size
subplot(235)
title(u'调整尺寸后的图像', fontproperties=font)
axis('off')
imshow(pil_im)
pil_im = Image.open("me.jpg")
pil_im = pil_im.rotate(45)
subplot(236)
title(u'旋转45°后的图像', fontproperties=font)
axis('off')
imshow(pil_im)
show()
运行结果

1.3 画图、描点和线
主要内容给图片加上坐标轴进行绘图
示例代码# -*- coding: utf-8 -*-
from PIL import Image
from pylab import *
# 添加中文字体支持
from matplotlib.font_manager import FontProperties
font = FontProperties(fname=r"c:\windows\fonts\SimSun.ttc", size=14)
im = array(Image.open("me.jpg"))
figure()
# 画有坐标轴的
subplot(121)
imshow(im)
x = [100, 100, 400, 400]
y = [200, 500, 200, 500]
plot(x, y, 'r*')
plot(x[:2], y[:2])
title(u'绘图: "me.jpg"', fontproperties=font)
# 不显示坐标轴
subplot(122)
imshow(im)
x = [100, 100, 400, 400]
y = [200, 500, 200, 500]
plot(x, y, 'r*')
plot(x[:2], y[:2])
axis('off') #显示坐标轴
title(u'绘图: "me.jpg"', fontproperties=font)
show()
运行结果

1.4 图像轮廓和直方图
主要内容对图片进行RGB转灰度处理、提取图像轮廓并绘制出图像直方图。contour()表示检测图像轮廓,hist()表示创建直方图
示例代码# -*- coding: utf-8 -*-
from PIL import Image
from pylab import *
# 添加中文字体支持
from matplotlib.font_manager import FontProperties
font = FontProperties(fname=r"c:\windows\fonts\SimSun.ttc", size=14)
im = array(Image.open("C:\\Users\\yume4\\Pictures\\Saved Pictures\\me.jpg").convert('L')) # 打开图像,并转成灰度图像
figure()
# 使用颜色信息
subplot(121)
gray()
# 在原点的左上角显示轮廓图像
contour(im, origin='image')
axis('equal')
axis('off')
title(u'图像轮廓', fontproperties=font)
subplot(122)
hist(im.flatten(), 128)
title(u'图像直方图', fontproperties=font)
plt.xlim([0,260])
plt.ylim([0,11000])
show()
运行结果

1.5 灰度变换
主要内容以下对图片进行不同程度的灰度处理
示例代码# -*- coding: utf-8 灰度变换-*-
from PIL import Image
from numpy import *
from pylab import *
im = array(Image.open("C:\\Users\\yume4\\Pictures\\Saved Pictures\\me.jpg").convert('L'))
print int(im.min()), int(im.max())
im2 = 255 - im # 反色
print int(im2.min()), int(im2.max())
im3 = (100.0/255) * im + 100 # clamp to interval 100...200
print int(im3.min()), int(im3.max())
im4 = 255.0 * (im/255.0)**2 # squared
print int(im4.min()), int(im4.max())
figure()
gray()
subplot(1, 3, 1)
imshow(im2)
axis('off')
title(r'$f(x)=255-x$')
subplot(1, 3, 2)
imshow(im3)
axis('off')
title(r'$f(x)=\frac{1
4000
00}{255}x+100$')
subplot(1, 3, 3)
imshow(im4)
axis('off')
title(r'$f(x)=255(\frac{x}{255})^2$')
show()
运行结果

1.6 直方图均衡化
主要内容在图像处理中,直方图均衡化一般用来均衡图像的强度,或增加图像的对比度。示例是对图片进行灰度处理及进行直方图均衡化,显示处理后的图片和直方图。
示例代码# -*- coding: utf-8 -*-
from PIL import Image
from pylab import *
from numpy import *
from PCV.tools import imtools
# 添加中文字体支持
from matplotlib.font_manager import FontProperties
font = FontProperties(fname=r"c:\windows\fonts\SimSun.ttc", size=14)
im = array(Image.open("C:\\Users\\yume4\\Pictures\\Saved Pictures\\me.jpg").convert('L')) # 打开图像,并转成灰度图像
#im = array(Image.open('../data/AquaTermi_lowcontrast.JPG').convert('L'))
im2, cdf = imtools.histeq(im)
figure()
subplot(2, 2, 1)
axis('off')
gray()
title(u'原始图像', fontproperties=font)
imshow(im)
subplot(2, 2, 2)
axis('off')
title(u'直方图均衡化后的图像', fontproperties=font)
imshow(im2)
subplot(2, 2, 3)
axis('off')
title(u'原始直方图', fontproperties=font)
#hist(im.flatten(), 128, cumulative=True, normed=True)
hist(im.flatten(), 128, normed=True)
subplot(2, 2, 4)
axis('off')
title(u'均衡化后的直方图', fontproperties=font)
#hist(im2.flatten(), 128, cumulative=True, normed=True)
hist(im2.flatten(), 128, normed=True)
show()
运行结果

1.7 滤波
主要内容滤波的意思就是对原图像的每个像素周围一定范围内的像素进行运算,运算的范围就称为掩膜。均值滤波是用相邻元素灰度值的平均值代替该元素的灰度值。高斯滤波一般针对的是高斯噪声,能够很好的抑制图像输入时随机引入的噪声,将像素点跟邻域像素看作是一种高斯分布的关系,它的操作是将图像和一个高斯核进行卷积操作。中值滤波是将将每一像素点的灰度值设置为该点某邻域窗口内的所有像素点灰度值的中值。双边滤波是结合图像的空间邻近度和像素值相似度的一种折中处理,同时考虑空域信息和灰度相似性,达到保边去噪的目的,具有简单,非迭代、局部的特点,示例分别对图片进行以上四种滤波处理
示例代码# -*- coding: utf-8-*-
import numpy as np
import cv2
import matplotlib.pyplot as plt
img = cv2.imread("C:\\Users\\yume4\\Pictures\\Saved Pictures\\me.jpg")
# 均值滤波
img_mean = cv2.blur(img, (5,5))
# 高斯滤波
img_Guassian = cv2.GaussianBlur(img,(5,5),0)
# 中值滤波
img_median = cv2.medianBlur(img, 5)
# 双边滤波
img_bilater = cv2.bilateralFilter(img,9,75,75)
# 展示不同的图片
titles = ['srcImg','mean', 'Gaussian', 'median', 'bilateral']
imgs = [img, img_mean, img_Guassian, img_median, img_bilater]
for i in range(5):
plt.subplot(2,3,i+1)# 注意,这和matlab中类似,没有0,数组下标从1开始
plt.imshow(imgs[i])
plt.title(titles[i])
plt.show()
运行结果


相关文章推荐
- python计算机视觉编程——第一章(基本的图像操作和处理)
- [置顶] Python计算机视觉Learning(一)-- Python图像处理类库--PIL
- Python计算机视觉编程练习13:文件(夹)批量更名、图像批量resize
- OpenCV3计算机视觉Python语言实现(三):使用OpenCV3处理图像
- Python计算机视觉:第一章 图像处理基础
- Mahotas(Python 计算机视觉、图像处理库)安装
- 【计算机视觉】python 基础图像处理
- Python计算机视觉:第一章 图像处理基础
- Python计算机视觉:第一章 图像处理基础
- 图像处理与计算机视觉基础,经典以及最近发展
- Matlab计算机视觉/图像处理工具箱
- Python计算机视觉编程练习12:os模块学习
- 图像处理与计算机视觉 基础、经典以及最近发展
- 计算机视觉与图像处理的 Matlab/Octave 代码集合
- Python计算机视觉:第六章 图像聚类
- 图像处理与计算机视觉:基础,经典以及最近发展(1)序
- 【计算机视觉】【图像处理】图像平滑-均值平滑+中值平滑
- 图像处理\计算机视觉资源
- Matlab计算机视觉/图像处理工具箱推荐
- 机器视觉开源处理库汇总-介绍n款计算机视觉库/人脸识别开源库/软件 -几种图像处理类库的比较-视觉相关网站