cs231n---Python Numpy教程(第三弹)---终
2018-03-02 16:40
549 查看
下面介绍一下SciPy
numpy提供了高性能得多维数组,以及计算和操作数组得基本工具。SciPy基于numpy,提供了大量得计算和操作数组得函数,这些函数对于不同类型得科学和工程计算非常有用。
熟悉SciPy的最好方法就是阅读文档。这里强调得是对于本课程有用的部分。
图像操作
SciPy提供了一些操作图像得基本函数。比如,将图像从硬盘读入到数组得函数,也提供了将数组中数据写入到硬盘成为图像得函数:# SciPy 图像操作
from scipy.misc import imread, imsave, imresize
# Read an JPEG image into a numpy array
img = imread('fig.jpg')
print(img.dtype, img.shape) # uint8 (489, 595, 3)
# 我们可以用一个不同的标量常数缩放每一个颜色通道来给图像着色。图像有形状(489, 595, 3);
# we multiply it by the array [1, 0.95, 0.9] of shape (3,);
# numpy broadcasting means that this leaves the red channel unchanged,
# and multiplies the green and blue channels by 0.95 and 0.9 respectively.
img_tinted = img * [1, 0.15, 0.9]
# Resize the tinted image to be 300 by 300 pixels.
img_tinted = imresize(img_tinted, (300, 300))
# Write the tinted image back to disk
imsave('fig_change.jpg', img_tinted)
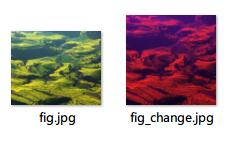
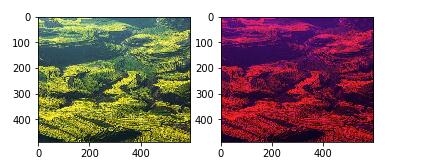
左边是原始图片,右边是变色和变形的图片。
如果运行这段代码出现类似ImportError: cannot import name imread的报错,那么请利用pip进行Pillow(oyth)的下载,可以解决问题。命令:pip install Pillow。
Matpoltlib
matplotlib做为一个做图库。首先简要介绍matplotlib.pyplot模块,它的功能和matlab中作图功能类似。
绘图
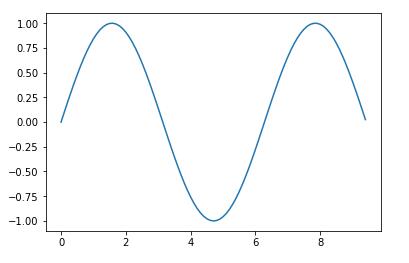
matpoltlib库中最重要得函数是plot。该函数能做出2D图形。# matplotlib.pyplot----plot for 2D fig
import numpy as np
import matplotlib.pyplot as plt
# 生成正弦曲线上的点的x和y坐标 Compute the x and y coordinates for points on a sine curve
x = np.arange(0, 3 * np.pi, 0.1)
y = np.sin(x)
# Plot the points using matplotlib
plt.plot(x, y)
plt.show() # You must call plt.show() to make graphics appear. 这步必须有,才能做出图!!!结果如下图所示:
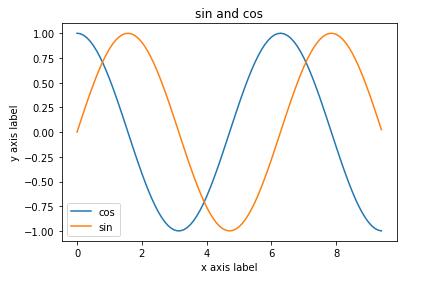
接下来,在一次画多个图像并加上标签,坐标轴。import numpy as np
import matplotlib.pyplot as plt
x = np.arange(0, 3 * np.pi, 0.1)
y_cos = np.cos(x)
y_sin = np.sin(x)
plt.plot(x, y_cos)
plt.plot(x, y_sin)
plt.xlabel('x axis label')
plt.ylabel('y axis label')
plt.title('sin and cos')
plt.legend(['cos', 'sin'])
plt.show() # You must call plt.show() to make graphics appear. 这步必须有,才能做出图!!!结果如下图所示:
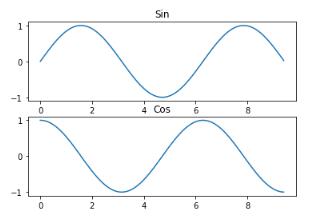
绘制多个图像
使用subplot函数来将多张图一起画出来:import numpy as np
import matplotlib.pyplot as plt
# Compute the x and y coordinates for points on sine and cosine curves
x = np.arange(0, 3 * np.pi, 0.1)
y_sin = np.sin(x)
y_cos = np.cos(x)
# Set up a subplot grid that has height 2 and width 1,
# and set the first such subplot as active.
plt.subplot(2, 1, 1)
# Make the first plot
plt.plot(x, y_sin)
plt.title('Sin')
# Set the second subplot as active, and make the second plot.
plt.subplot(2, 1, 2)
plt.plot(x, y_cos)
plt.title('Cos')
# Show the figure.
plt.show()
图像
使用imshow函数来显示图像:# 使用 imshow 函数来显示图像
import numpy as np
from scipy.misc import imread, imresize
import matplotlib.pyplot as plt
img = imread('fig.jpg')
img_tinted = img * [1, 0.15, 0.9]
# 显示原始图像
plt.subplot(1, 2, 1)
plt.imshow(img)
# Set the second subplot as active
plt.subplot(1, 2, 2)
# A slight gotcha with imshow is that it might give strange results
# if presented with data that is not uint8. To work around this, we
# explicitly cast the image to uint8 before displaying it.
#对imshow的一个小问题是,
#如果给出的不是uint8的数据,它可能会给出奇怪的结果。
#为了解决这个问题,我们在显示之前显式地将图像转换为uint8。
plt.imshow(np.uint8(img_tinted))
# plt.imshow(img_tinted)
plt.show()
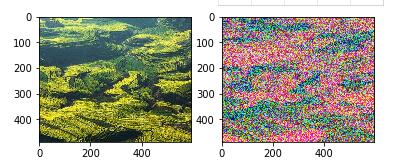
若不将图像转换为unit8的数据直接显示图像,会产生奇怪的效果:plt.imshow(img_tinted)
以上内容转载整理来自知乎专栏点击打开链接,侵删侵删。
numpy提供了高性能得多维数组,以及计算和操作数组得基本工具。SciPy基于numpy,提供了大量得计算和操作数组得函数,这些函数对于不同类型得科学和工程计算非常有用。
熟悉SciPy的最好方法就是阅读文档。这里强调得是对于本课程有用的部分。
图像操作
SciPy提供了一些操作图像得基本函数。比如,将图像从硬盘读入到数组得函数,也提供了将数组中数据写入到硬盘成为图像得函数:# SciPy 图像操作
from scipy.misc import imread, imsave, imresize
# Read an JPEG image into a numpy array
img = imread('fig.jpg')
print(img.dtype, img.shape) # uint8 (489, 595, 3)
# 我们可以用一个不同的标量常数缩放每一个颜色通道来给图像着色。图像有形状(489, 595, 3);
# we multiply it by the array [1, 0.95, 0.9] of shape (3,);
# numpy broadcasting means that this leaves the red channel unchanged,
# and multiplies the green and blue channels by 0.95 and 0.9 respectively.
img_tinted = img * [1, 0.15, 0.9]
# Resize the tinted image to be 300 by 300 pixels.
img_tinted = imresize(img_tinted, (300, 300))
# Write the tinted image back to disk
imsave('fig_change.jpg', img_tinted)
左边是原始图片,右边是变色和变形的图片。
如果运行这段代码出现类似ImportError: cannot import name imread的报错,那么请利用pip进行Pillow(oyth)的下载,可以解决问题。命令:pip install Pillow。
Matpoltlib
matplotlib做为一个做图库。首先简要介绍matplotlib.pyplot模块,它的功能和matlab中作图功能类似。
绘图
matpoltlib库中最重要得函数是plot。该函数能做出2D图形。# matplotlib.pyplot----plot for 2D fig
import numpy as np
import matplotlib.pyplot as plt
# 生成正弦曲线上的点的x和y坐标 Compute the x and y coordinates for points on a sine curve
x = np.arange(0, 3 * np.pi, 0.1)
y = np.sin(x)
# Plot the points using matplotlib
plt.plot(x, y)
plt.show() # You must call plt.show() to make graphics appear. 这步必须有,才能做出图!!!结果如下图所示:
接下来,在一次画多个图像并加上标签,坐标轴。import numpy as np
import matplotlib.pyplot as plt
x = np.arange(0, 3 * np.pi, 0.1)
y_cos = np.cos(x)
y_sin = np.sin(x)
plt.plot(x, y_cos)
plt.plot(x, y_sin)
plt.xlabel('x axis label')
plt.ylabel('y axis label')
plt.title('sin and cos')
plt.legend(['cos', 'sin'])
plt.show() # You must call plt.show() to make graphics appear. 这步必须有,才能做出图!!!结果如下图所示:
绘制多个图像
使用subplot函数来将多张图一起画出来:import numpy as np
import matplotlib.pyplot as plt
# Compute the x and y coordinates for points on sine and cosine curves
x = np.arange(0, 3 * np.pi, 0.1)
y_sin = np.sin(x)
y_cos = np.cos(x)
# Set up a subplot grid that has height 2 and width 1,
# and set the first such subplot as active.
plt.subplot(2, 1, 1)
# Make the first plot
plt.plot(x, y_sin)
plt.title('Sin')
# Set the second subplot as active, and make the second plot.
plt.subplot(2, 1, 2)
plt.plot(x, y_cos)
plt.title('Cos')
# Show the figure.
plt.show()
图像
使用imshow函数来显示图像:# 使用 imshow 函数来显示图像
import numpy as np
from scipy.misc import imread, imresize
import matplotlib.pyplot as plt
img = imread('fig.jpg')
img_tinted = img * [1, 0.15, 0.9]
# 显示原始图像
plt.subplot(1, 2, 1)
plt.imshow(img)
# Set the second subplot as active
plt.subplot(1, 2, 2)
# A slight gotcha with imshow is that it might give strange results
# if presented with data that is not uint8. To work around this, we
# explicitly cast the image to uint8 before displaying it.
#对imshow的一个小问题是,
#如果给出的不是uint8的数据,它可能会给出奇怪的结果。
#为了解决这个问题,我们在显示之前显式地将图像转换为uint8。
plt.imshow(np.uint8(img_tinted))
# plt.imshow(img_tinted)
plt.show()
若不将图像转换为unit8的数据直接显示图像,会产生奇怪的效果:plt.imshow(img_tinted)
以上内容转载整理来自知乎专栏点击打开链接,侵删侵删。

相关文章推荐
- cs231n---Python Numpy教程(第二弹)
- cs231n---Python Numpy教程(第一弹)
- CS231n课程笔记翻译1:Python Numpy教程
- CS231n课程Python Numpy教程三:SciPy
- CS231n课程笔记翻译(一):Python Numpy教程
- CS231n(1):Python Numpy教程
- CS231n课程笔记翻译:Python Numpy教程
- CS231n课程Python Numpy教程四:Matplotlib
- Python2.7+pycharm Win7 64bit安装教程 附:机器学习numpy+scipy+sklearn安装组
- 循环神经网络教程-第二部分 用python numpy theano实现RNN
- Python中的Numpy入门教程
- Python教程:numpy的基本介绍
- 【Python】NumPy的详细教程(基础篇)
- Python中的Numpy、SciPy、MatPlotLib安装教程
- Python中的Numpy入门教程
- Python中的Numpy入门教程
- 【Python】NumPy的详细教程(进阶篇)
- python numpy教程
- [Python]Numpy入门教程
- Python中的Numpy入门教程