JVM 性能调优实战之:使用阿里开源工具 TProfiler 在海量业务代码中精确定位性能代码(实测可用)
2018-01-23 10:39
951 查看
1.
实测可用的TProfiler-master.zip到CSDN 资源:http://download.csdn.net/download/q915730058/10219235
2018.1.29目前最新的
2.登录需要监控的远程服务器主机,为 TProfiler 新建安装和日志路径:
mkdir /opt/tprofiler 安装路径
mkdir /opt/log 日志路径
3.进入下载的TProfiler目录中,进入dist解压TProfiler_1.0.1 解压缩将dist 目录下的 profile.properties 以及 dist/lib 目录下的 tprofiler-1.0.1.jar 移动到tprofiler 目录下。
4.最后将远程服务器 /opt/tprofiler 目录及其下所有文件的所有者改为启动 Tomcat 进程的用户及其所在用户组。
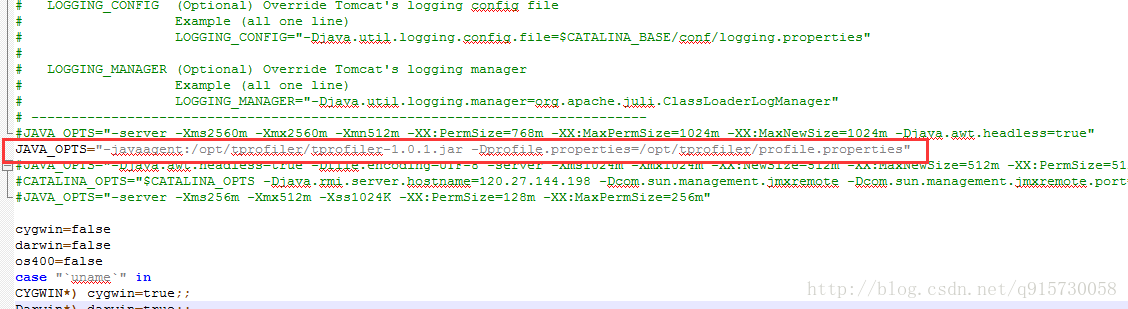
-javaagent:/opt/tprofiler/tprofiler-1.0.1.jar -Dprofile.properties=/opt/tprofiler/profile.properties
tomcat启动项是bin里的 catalina.sh
5.profile.propertie配置文件设置
#basic configuration items
startProfTime = 9:00:00 开始profile的时间点
endProfTime = 11:00:00 结束profile的时间点
eachProfUseTime = 5 profile时间长度(单位秒)
eachProfIntervalTime = 50 两次profile的时间间隔(单位秒)
samplerIntervalTime = 20 两次采样的时间间隔(单位秒)
debugMode = false 是否进入调试模式
needNanoTime = false 是否需要用纳秒记录时间
ignoreGetSetMethod = true 是否忽略采集get/set方法
#file paths
logFilePath = /opt/log/tprofiler.log log的存放位置
methodFilePath =/opt/log/tmethod.log log的存放位置
samplerFilePath = /opt/log/tsampler.log log的存放位置
#include & excludes items
excludeClassLoader = org.eclipse.osgi.internal.baseadaptor.DefaultClassLoader 不注入的类加载器(分号分割)(使用默认的就可以)
includePackageStartsWith = com.taobao(重点,这个一定需要使用自己的类包名)
excludePackageStartsWith = com.alibaba;com.taobao.forest.domain.dataobject 不进行profile的类包名(分号分割)(使用默认就可以了)
6. TProfiler操作和监控命令
java -cp /opt/tprofiler/tprofiler-1.0.1.jar com.taobao.profile.client.TProfilerClient 172.16.1.175 30000 status 查看状态
java -cp /opt/tprofiler/tprofiler-1.0.1.jar com.taobao.profile.client.TProfilerClient 172.16.1.175 30000 stop 关闭
java -cp /opt/tprofiler/tprofiler-1.0.1.jar com.taobao.profile.client.TProfilerClient 172.16.1.175 30000 start 启动
java -cp /opt/tprofiler/tprofiler-1.0.1.jar com.taobao.profile.client.TProfilerClient 172.16.1.175 30000 flushmethod 刷出数据
java -cp /opt/tprofiler/tprofiler-1.0.1.jar com.taobao.profile.analysis.SamplerLogAnalysis /opt/log/tsampler.log /opt/log/method.log /opt/log/thread.log
分析tsampler.log采样文件,输出method.log与thread.log两文件
java -cp /opt/tprofiler/tprofiler-1.0.1.jar com.taobao.profile.analysis.ProfilerLogAnalysis /opt/log/tprofiler.log /opt/log/tmethod.log /opt/log/topmethod.log /opt/log/topobject.log
(最重要就是这个,这个是用来分析的)
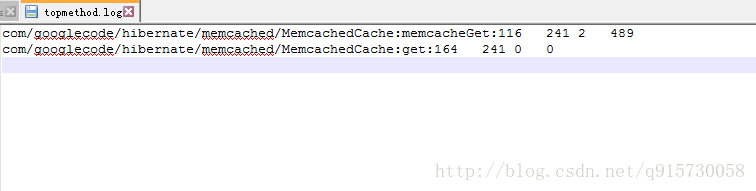
下图是分析topmethod.log 方法名 被调用次数 平均执行时间(ms) 采样内总执行时间(ms)
java -cp /opt/tprofiler/tprofiler-1.0.1.jar com.taobao.profile.analysis.SamplerLogAnalysis /opt/log/tprofiler.log /opt/log/topmethod.log /opt/log/topobject.log
分析tprofiler.log采样文件,输出topmethod.log与topobject.log两文件,需要tmethod.log文件为输入
7.(1)修改配置文件后,一定需要重启tomcat,要不然没有数据的
(2)tmethod.log日志需要时间结束后才会出现在日志里,用刷出数据有时候刷出数据也显示为0上
实测可用的TProfiler-master.zip到CSDN 资源:http://download.csdn.net/download/q915730058/10219235
2018.1.29目前最新的
2.登录需要监控的远程服务器主机,为 TProfiler 新建安装和日志路径:
mkdir /opt/tprofiler 安装路径
mkdir /opt/log 日志路径
3.进入下载的TProfiler目录中,进入dist解压TProfiler_1.0.1 解压缩将dist 目录下的 profile.properties 以及 dist/lib 目录下的 tprofiler-1.0.1.jar 移动到tprofiler 目录下。
4.最后将远程服务器 /opt/tprofiler 目录及其下所有文件的所有者改为启动 Tomcat 进程的用户及其所在用户组。
-javaagent:/opt/tprofiler/tprofiler-1.0.1.jar -Dprofile.properties=/opt/tprofiler/profile.properties
tomcat启动项是bin里的 catalina.sh
5.profile.propertie配置文件设置
#basic configuration items
startProfTime = 9:00:00 开始profile的时间点
endProfTime = 11:00:00 结束profile的时间点
eachProfUseTime = 5 profile时间长度(单位秒)
eachProfIntervalTime = 50 两次profile的时间间隔(单位秒)
samplerIntervalTime = 20 两次采样的时间间隔(单位秒)
debugMode = false 是否进入调试模式
needNanoTime = false 是否需要用纳秒记录时间
ignoreGetSetMethod = true 是否忽略采集get/set方法
#file paths
logFilePath = /opt/log/tprofiler.log log的存放位置
methodFilePath =/opt/log/tmethod.log log的存放位置
samplerFilePath = /opt/log/tsampler.log log的存放位置
#include & excludes items
excludeClassLoader = org.eclipse.osgi.internal.baseadaptor.DefaultClassLoader 不注入的类加载器(分号分割)(使用默认的就可以)
includePackageStartsWith = com.taobao(重点,这个一定需要使用自己的类包名)
excludePackageStartsWith = com.alibaba;com.taobao.forest.domain.dataobject 不进行profile的类包名(分号分割)(使用默认就可以了)
6. TProfiler操作和监控命令
java -cp /opt/tprofiler/tprofiler-1.0.1.jar com.taobao.profile.client.TProfilerClient 172.16.1.175 30000 status 查看状态
java -cp /opt/tprofiler/tprofiler-1.0.1.jar com.taobao.profile.client.TProfilerClient 172.16.1.175 30000 stop 关闭
java -cp /opt/tprofiler/tprofiler-1.0.1.jar com.taobao.profile.client.TProfilerClient 172.16.1.175 30000 start 启动
java -cp /opt/tprofiler/tprofiler-1.0.1.jar com.taobao.profile.client.TProfilerClient 172.16.1.175 30000 flushmethod 刷出数据
java -cp /opt/tprofiler/tprofiler-1.0.1.jar com.taobao.profile.analysis.SamplerLogAnalysis /opt/log/tsampler.log /opt/log/method.log /opt/log/thread.log
分析tsampler.log采样文件,输出method.log与thread.log两文件
java -cp /opt/tprofiler/tprofiler-1.0.1.jar com.taobao.profile.analysis.ProfilerLogAnalysis /opt/log/tprofiler.log /opt/log/tmethod.log /opt/log/topmethod.log /opt/log/topobject.log
(最重要就是这个,这个是用来分析的)
下图是分析topmethod.log 方法名 被调用次数 平均执行时间(ms) 采样内总执行时间(ms)
java -cp /opt/tprofiler/tprofiler-1.0.1.jar com.taobao.profile.analysis.SamplerLogAnalysis /opt/log/tprofiler.log /opt/log/topmethod.log /opt/log/topobject.log
分析tprofiler.log采样文件,输出topmethod.log与topobject.log两文件,需要tmethod.log文件为输入
7.(1)修改配置文件后,一定需要重启tomcat,要不然没有数据的
(2)tmethod.log日志需要时间结束后才会出现在日志里,用刷出数据有时候刷出数据也显示为0上

相关文章推荐
- JVM 性能调优实战之:使用阿里开源工具 TProfiler 在海量业务代码中精确定位性能代码 .
- JVM 性能调优实战之:使用阿里开源工具 TProfiler 在海量业务代码中精确定位性能代码
- [置顶] JVM 性能调优实战之:使用阿里开源工具 TProfiler 在海量业务代码中精确定位性能代码
- JVM 性能调优实战之:使用阿里开源工具 TProfiler 在海量业务代码中精确定位性能代码
- 使用阿里开源工具 TProfiler 在海量业务代码中精确定位性能代码 (jvm性能调优)
- JVM性能调优监控工具jps、jstack、jmap、jhat、jstat、hprof使用详解
- JVM性能调优监控工具jps、jstack、jmap、jhat、jstat、hprof使用详解
- JVM性能调优监控工具jps、jstack、jmap、jhat、jstat、hprof使用详解
- JVM性能调优监控工具jps、jstack、jmap、jhat、jstat使用详解
- JVM性能调优监控工具jps、jstack、jmap、jhat、jstat使用详解
- Unity3D中使用Profiler精确定位性能热点的优化技巧
- JVM性能调优监控工具jps、jstat、jinfo、jmap、jhat、jstack使用详解
- JVM性能调优监控工具jps、jstack、jmap、jhat、jstat使用详解
- JVM性能调优监控工具jps、jstack、jmap、jhat、jstat使用详解
- JVM性能调优监控工具jps、jstack、jmap、jhat、jstat、hprof使用详解
- jvm 性能调优监控工具jps、jstack、jmap、jhat、jstat、hprof使用详解
- JVM性能调优监控工具jps、jstack、jmap、jhat、jstat使用详解
- JVM性能调优监控工具jps、jstack、jmap、jhat、jstat、hprof使用详解
- Unity3D中使用Profiler精确定位性能热点的优化技巧
- JVM性能调优监控工具jps、jstack、jmap、jhat、jstat、hprof使用详解