python+matplotlib绘制饼图散点图实例代码
2018-01-20 08:17
1331 查看
本文是从matplotlib官网上摘录下来的一个实例,实现的功能是Python+matplotlib绘制自定义饼图作为散点图的标记,具体如下。
首先看下演示效果
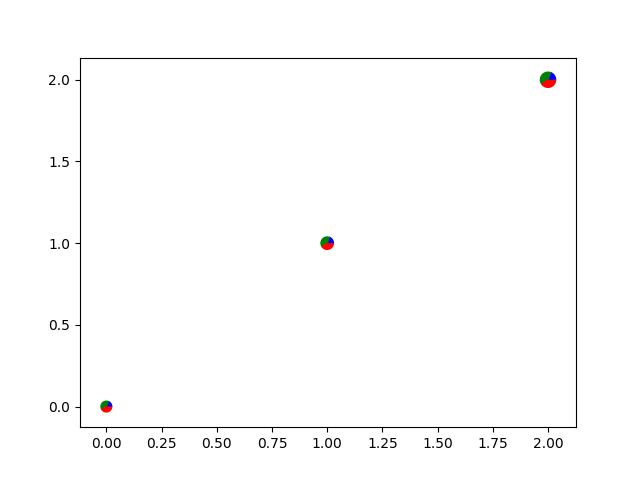
实例代码:
import numpy as np
import matplotlib.pyplot as plt
# first define the ratios
r1 = 0.2    # 20%
r2 = r1 + 0.4 # 40%
# define some sizes of the scatter marker
sizes = np.array([60, 80, 120])
# calculate the points of the first pie marker
#
# these are just the origin (0,0) +
# some points on a circle cos,sin
x = [0] + np.cos(np.linspace(0, 2 * np.pi * r1, 10)).tolist()
y = [0] + np.sin(np.linspace(0, 2 * np.pi * r1, 10)).tolist()
xy1 = list(zip(x, y))
s1 = np.max(xy1)
x = [0] + np.cos(np.linspace(2 * np.pi * r1, 2 * np.pi * r2, 10)).tolist()
y = [0] + np.sin(np.linspace(2 * np.pi * r1, 2 * np.pi * r2, 10)).tolist()
xy2 = list(zip(x, y))
s2 = np.max(xy2)
x = [0] + np.cos(np.linspace(2 * np.pi * r2, 2 * np.pi, 10)).tolist()
y = [0] + np.sin(np.linspace(2 * np.pi * r2, 2 * np.pi, 10)).tolist()
xy3 = list(zip(x, y))
s3 = np.max(xy3)
fig, ax = plt.subplots()
ax.scatter(range(3), range(3), marker=(xy1, 0),
s=s1 ** 2 * sizes, facecolor='blue')
ax.scatter(range(3), range(3), marker=(xy2, 0),
s=s2 ** 2 * sizes, facecolor='green')
ax.scatter(range(3), range(3), marker=(xy3, 0),
s=s3 ** 2 * sizes, facecolor='red')
plt.show()
总结
以上就是本文关于python+matplotlib绘制饼图散点图实例代码的全部内容,希望对大家有所帮助。感兴趣的朋友可以继续参阅本站其他相关专题,如有不足之处,欢迎留言指出。感谢朋友们对本站的支持!
您可能感兴趣的文章:

相关文章推荐
- python+matplotlib绘制旋转椭圆实例代码
- python+matplotlib绘制3D条形图实例代码
- Python+matplotlib绘制不同大小和颜色散点图实例
- python之matplotlib学习绘制动态更新图实例代码
- python+matplotlib实现动态绘制图片实例代码(交互式绘图)
- Python 3基础教程48-Matplotlib绘制散点图和柱状图
- python matplotlib画图实例代码分享
- 180122 特征值与特征向量的几何解释与python代码,附matplotlib绘制多边形
- Python matplotlib画图实例之绘制拥有彩条的图表
- python使用matplotlib模块绘制多条折线图、散点图
- python matplotlib模块——绘制三维图形、三维数据散点图
- Python通过matplotlib绘制动画简单实例
- Python使用matplotlib绘制余弦的散点图示例
- Python数据可视化编程通过Matplotlib创建散点图代码示例
- Python Matplotlib实现三维数据的散点图绘制
- python中Matplotlib实现绘制3D图的示例代码
- python matplotlib从文件中读取数据绘制散点图
- matplotlib在python上绘制3D散点图实例详解
- 用matplotlib.plt作散点图的Python代码
- python+matplotlib演示电偶极子实例代码