Java性能分析工具&&JProfiler
2017-07-01 16:58
435 查看
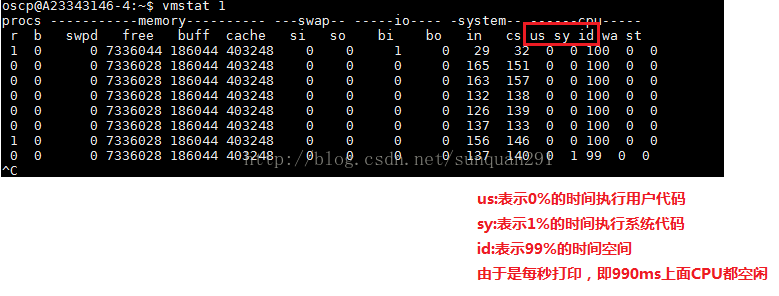
程序性能分析的起点其实与Java无关,它是一组操作系统自带的基本监控工具。
Unix系统中:
vmstata、iostat、prstat、top等
Window系统中:
typeperf等
typeperf -si 1 "\System\Processor Queue Length 显示CPU队列当前长度
系统本身的监控,有很多方法和工具,不多说。
====================================
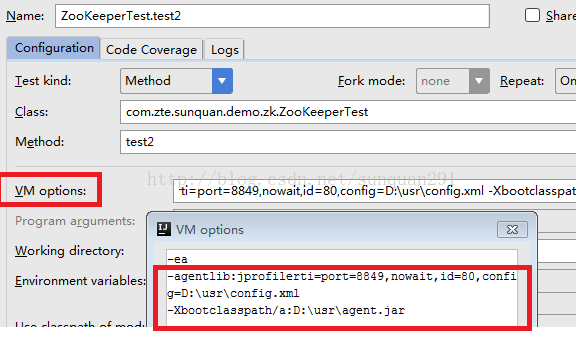
JProfile可以在window和unix使用,其安装都非常方便,但需要注意的是被监控的应用要修改其启动的JAVA_OPTS参数,其中核心的两个参数分别是:
angent.jar 与 config.xml及id指向
config.xml默认可以在系统用户目录中找到
agent.jar默认可在jprofile的安装bin目录中找到(可以拷到单独目录)
id要与config.xml配置session id的保持一致
set JAVA_OPTS=%JAVA_OPTS%
-agentlib:jprofilerti=port=8849,nowait,id=80,config=D:\usr\config.xml -Xbootclasspath/a:D:\usr\agent.jar
在Unix下程序运行的配置:
#DEFAULT_JAVA_DEBUG_OPTS="-agentlib:jdwp=transport=dt_socket,server=y,suspend=n,address=$JAVA_DEBUG_PORT -agentpath:/opt/jprofiler/bin/linux-x64/libjprofilerti.so=port=8849"
下面以主流的开发工具Intelligent为例,介绍下工具的使用:
1.在IDE中进行代码编写,在运行时加入上面的配置,如图:
程序启动

打印以上信息,则配置基本正确。
2.打开Jprofier工具开始进行性能分析
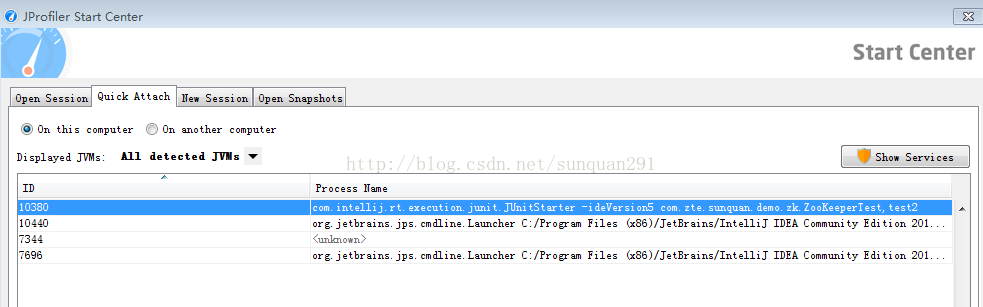
选中程序test2,开始监控
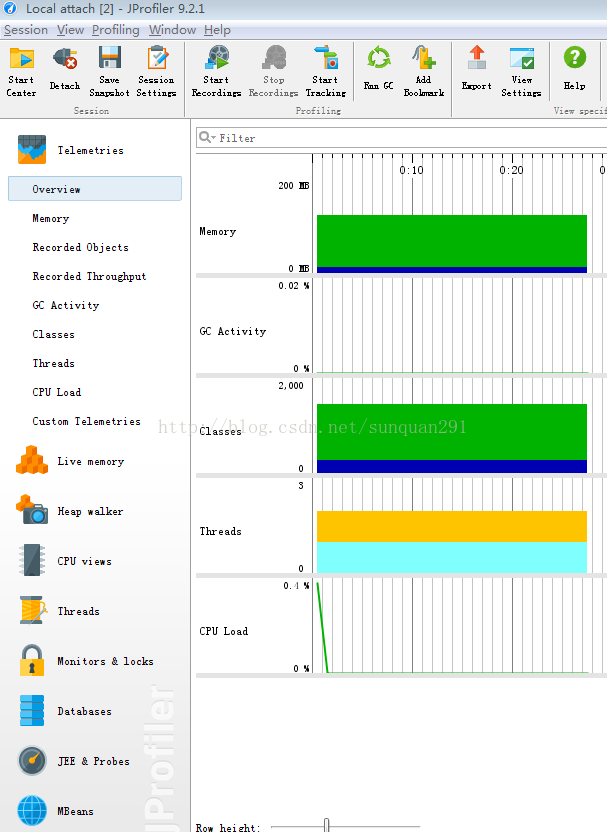
下面通过程序简单介绍性能分担问题:
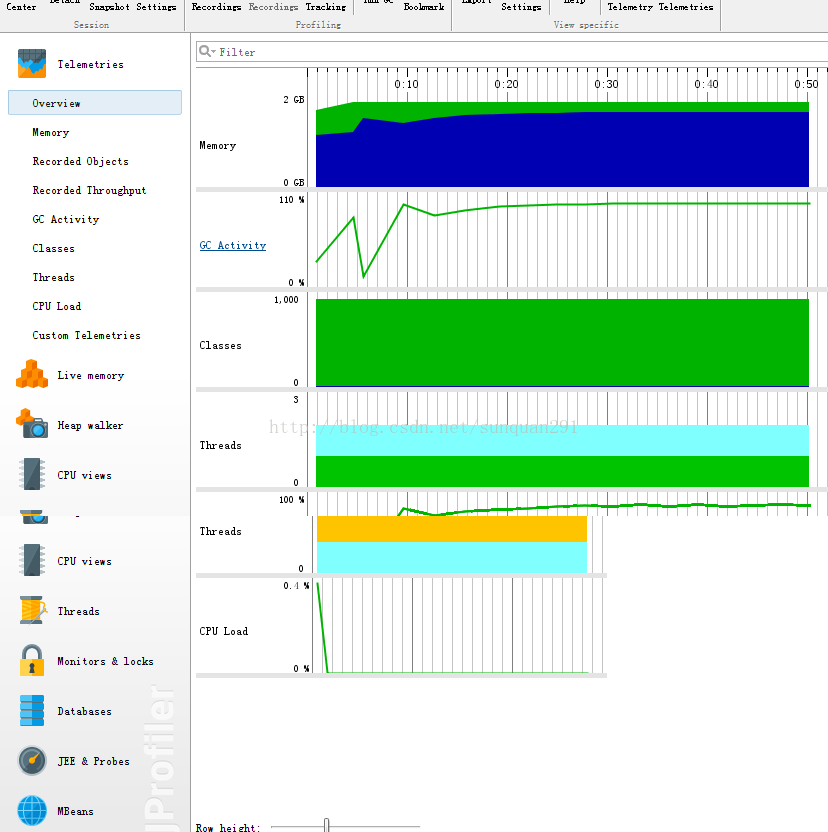
下图中,可以看到gc线程一直在频繁运行当中。说明垃圾回收一直在执行。
查看代码:
private int a;
private double b;
private String abc="acbsfdsfdaaaaaaaaaaaaaaaaaaa";
private BigInteger bigInteger=new BigInteger("3232342222222222");
private int a1;
private double b1;
private String abc1="acbsfdsfdaaaaaaaaaaaaaaaaaaa";
private BigInteger bigInteger1=new BigInteger("3232342222222222");
public static List list = new ArrayList();
public static void main(String[] args) {
while (true) {
for (int i = 0; i < 10000; i++) {
list.add(new ZooKeeperTest());
}
try {
TimeUnit.MILLISECONDS.sleep(5);
} catch (InterruptedException e) {
e.printStackTrace();
}
}
}
是由于list集合在频繁的写入数据导致的
该工具还有许多其它的标签,如hot spots,来做性能分析,屡试不爽的。
Unix系统中:
vmstata、iostat、prstat、top等
Window系统中:
typeperf等
typeperf -si 1 "\System\Processor Queue Length 显示CPU队列当前长度
系统本身的监控,有很多方法和工具,不多说。
====================================
JProfile可以在window和unix使用,其安装都非常方便,但需要注意的是被监控的应用要修改其启动的JAVA_OPTS参数,其中核心的两个参数分别是:
angent.jar 与 config.xml及id指向
config.xml默认可以在系统用户目录中找到
agent.jar默认可在jprofile的安装bin目录中找到(可以拷到单独目录)
id要与config.xml配置session id的保持一致
set JAVA_OPTS=%JAVA_OPTS%
-agentlib:jprofilerti=port=8849,nowait,id=80,config=D:\usr\config.xml -Xbootclasspath/a:D:\usr\agent.jar
在Unix下程序运行的配置:
#DEFAULT_JAVA_DEBUG_OPTS="-agentlib:jdwp=transport=dt_socket,server=y,suspend=n,address=$JAVA_DEBUG_PORT -agentpath:/opt/jprofiler/bin/linux-x64/libjprofilerti.so=port=8849"
下面以主流的开发工具Intelligent为例,介绍下工具的使用:
1.在IDE中进行代码编写,在运行时加入上面的配置,如图:
程序启动
打印以上信息,则配置基本正确。
2.打开Jprofier工具开始进行性能分析
选中程序test2,开始监控
下面通过程序简单介绍性能分担问题:
下图中,可以看到gc线程一直在频繁运行当中。说明垃圾回收一直在执行。
查看代码:
private int a;
private double b;
private String abc="acbsfdsfdaaaaaaaaaaaaaaaaaaa";
private BigInteger bigInteger=new BigInteger("3232342222222222");
private int a1;
private double b1;
private String abc1="acbsfdsfdaaaaaaaaaaaaaaaaaaa";
private BigInteger bigInteger1=new BigInteger("3232342222222222");
public static List list = new ArrayList();
public static void main(String[] args) {
while (true) {
for (int i = 0; i < 10000; i++) {
list.add(new ZooKeeperTest());
}
try {
TimeUnit.MILLISECONDS.sleep(5);
} catch (InterruptedException e) {
e.printStackTrace();
}
}
}
是由于list集合在频繁的写入数据导致的
该工具还有许多其它的标签,如hot spots,来做性能分析,屡试不爽的。

相关文章推荐
- Java性能分析工具之Jprofiler初体验
- c++中类似于java jprofiler/eclispe memoryanalysis的性能以及内存分析工具
- Java性能分析工具JProfiler
- 英特尔软件开发工具介绍—— Intel® VTune 可视化性能分析器
- 5款Java性能分析工具的对比
- java性能监控工具JProfiler的使用
- Java几款性能分析工具的对比
- Java几款性能分析工具的对比
- 网页速度分析 && 网页头文件解析 && 性能优化 && httpwatch工具使用
- java性能测试分析工具
- Java几款性能分析工具的对比
- gprof&mdash;&mdash;GNU性能分析工具
- [java]性能测试分析工具EclipseProfiler
- Java几款性能分析工具的对比
- Java几款性能分析工具的对比
- Java几款性能分析工具的对比
- Java几款性能分析工具的对比
- Java几款性能分析工具的对比
- Java几款性能分析工具的对比
- Java几款性能分析工具的对比