微信小程序图表插件(wx-charts)
2017-06-20 11:01
627 查看
微信小程序图表插件(wx-charts)基于canvas绘制,体积小巧支持图表类型饼图、线图、柱状图 、区域图等图表图形绘制,目前wx-charts是微信小程序图表插件中比较强大好使的一个。
饼图 pie
线图 line
柱状图 column
区域图 area
设置canvas的尺寸为2倍大小,然后缩小到50%,建议都进行这样的设置,图表本身绘制时是按照高清显示配置的,不然整体效果会偏大
opts Object
opts.canvasId String required 微信小程序canvas-id
opts.width Number required canvas宽度,单位为px
opts.height Number required canvas高度,单位为px
opts.type String required 图表类型,可选值为pie, line, column, area
opts.categories Array required (饼图不需要) 数据类别分类
opts.dataLabel Boolean default true 是否在图表中显示数据内容值
opts.yAxis Object Y轴配置
opts.yAxis.format Function 自定义Y轴文案显示
opts.yAxis.min Number Y轴起始值
opts.yAxis.title String Y轴title
opts.series Array required 数据列表
dataItem Object
dataItem.data Array required (饼图为Number) 数据
dataItem.color String 例如#7cb5ec 不传入则使用系统默认配色方案
dataItem.name String 数据名称
dateItem.format Function 自定义显示数据内容
原文地址:http://www.51xuediannao.com/xiaochengxu/wx-charts.html
wx-charts基于canvas绘制的微信小程序图表插件
支持图表类型
饼图 pie线图 line
柱状图 column
区域图 area
高清显示
设置canvas的尺寸为2倍大小,然后缩小到50%,建议都进行这样的设置,图表本身绘制时是按照高清显示配置的,不然整体效果会偏大/* 例如设计图尺寸为320 x 300 */
.canvas {
width: 640px;
height: 600px;
transform: scale(0.5)
}
wx-charts参数说明
opts Objectopts.canvasId String required 微信小程序canvas-id
opts.width Number required canvas宽度,单位为px
opts.height Number required canvas高度,单位为px
opts.type String required 图表类型,可选值为pie, line, column, area
opts.categories Array required (饼图不需要) 数据类别分类
opts.dataLabel Boolean default true 是否在图表中显示数据内容值
opts.yAxis Object Y轴配置
opts.yAxis.format Function 自定义Y轴文案显示
opts.yAxis.min Number Y轴起始值
opts.yAxis.title String Y轴title
opts.series Array required 数据列表
数据列表每项结构定义
dataItem ObjectdataItem.data Array required (饼图为Number) 数据
dataItem.color String 例如#7cb5ec 不传入则使用系统默认配色方案
dataItem.name String 数据名称
dateItem.format Function 自定义显示数据内容
wx-charts图表插件示例
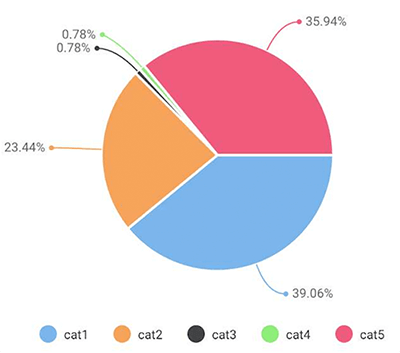
饼图pie chart
var Charts = require('charts.js');
new Charts({
canvasId: 'pieCanvas',
type: 'pie',
series: [{
name: '成交量1',
data: 15,
}, {
name: '成交量2',
data: 35,
}, {
name: '成交量3',
data: 78,
}, {
name: '成交量4',
data: 63,
}],
width: 640,
height: 400,
dataLabel: false
});
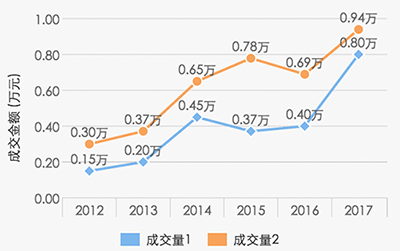
线图line chart
new Charts({
canvasId: 'lineCanvas',
type: 'line',
categories: ['2012', '2013', '2014', '2015', '2016', '2017'],
series: [{
name: '成交量1',
data: [0.15, 0.2, 0.45, 0.37, 0.4, 0.8],
format: function (val) {
return val.toFixed(2) + '万';
}
}, {
name: '成交量2',
data: [0.30, 0.37, 0.65, 0.78, 0.69, 0.94],
format: function (val) {
return val.toFixed(2) + '万';
}
}],
yAxis: {
title: '成交金额 (万元)',
format: function (val) {
return val.toFixed(2);
},
min: 0
},
width: 640,
height: 400
});
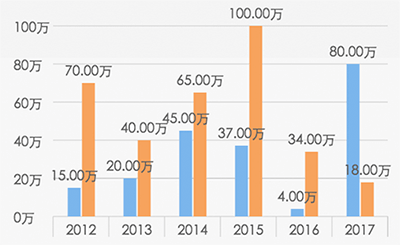
柱状图columnChart
new Charts({
canvasId: 'columnCanvas',
type: 'column',
categories: ['2016-08', '2016-09', '2016-10', '2016-11', '2016-12', '2017'],
series: [{
name: '成交量1',
data: [15, 20, 45, 37, 4, 80]
}, {
name: '成交量2',
data: [70, 40, 65, 100, 34, 18]
}, {
name: '成交量3',
data: [70, 40, 65, 100, 34, 18]
}, {
name: '成交量4',
data: [70, 40, 65, 100, 34, 18]
}],
yAxis: {
format: function (val) {
return val + '万';
}
},
width: 640,
height: 400,
dataLabel: false
});
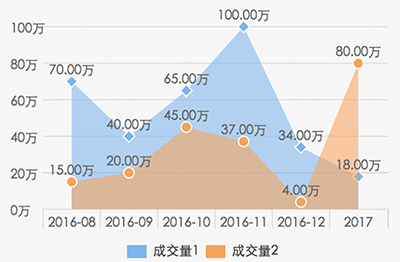
区域图areaChart
new Charts({
canvasId: 'areaCanvas',
type: 'area',
categories: ['2016-08', '2016-09', '2016-10', '2016-11', '2016-12', '2017'],
series: [{
name: '成交量1',
data: [70, 40, 65, 100, 34, 18],
format: function (val) {
return val.toFixed(2) + '万';
}
}, {
name: '成交量2',
data: [15, 20, 45, 37, 4, 80],
format: function (val) {
return val.toFixed(2) + '万';
}
}],
yAxis: {
format: function (val) {
return val + '万';
}
},
width: 640,
height: 400
});原文地址:http://www.51xuediannao.com/xiaochengxu/wx-charts.html

相关文章推荐
- 微信小程序图表插件(wx-charts)
- [置顶] wx-charts 微信小程序图表插件
- 微信小程序图表插件(wx-charts)实例代码
- wx-charts 微信小程序图表插件
- 微信小程序--wx-charts图表插件使用教程
- 微信小程序图表插件(wx-charts)
- 微信小程序开发(十三)富文本插件wxParse的wxParseImgTap的bug修复
- 微信小程序开发之——wx.showToast(OBJECT)的使用
- 微信小程序首个语法高亮插件
- sublime福音:微信小程序组件及API补全插件
- 微信小程序入门教程 - 列表渲染多层嵌套循环及wx:key的使用
- 微信小程序 wxapp画布 canvas详细介绍
- 微信小程序 wxapp导航 navigator详解
- jquery 图表插件highcharts & highstock
- 微信小程序开发之常见问题 不在以下合法域名列表中 wx.request合法域名配置
- 微信小程序 wx.request(接口调用方式)详解及实例
- 微信小程序 wxapp内容组件 text详细介绍
- 【微信小程序】布局插件:wxgrid
- 微信小程序 wxapp内容组件 icon详细介绍
- 微信小程序 教程之wxapp 视图容器 view