运维之我的docker-docker日志收集
2017-05-05 17:44
447 查看
因为docker产生的容器不是一个永久存储的文件,所以无法保证你的文件永久保存。建议大家把容器产生的日志通过fluentd,flume,logstash等工具传送到一个日志仓库,这样保证方便保证数据的安全和管理。由于docker官方的推荐,我们本次讲解是fluentd日志收集组件。
具体使用如下:
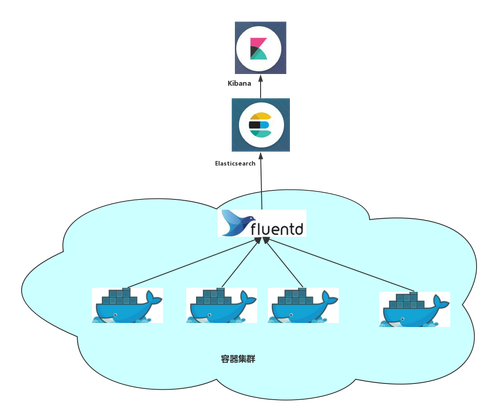
安装ES
1. 初始化环境
2.下载elasticsearch安装包并安装
安装fluentd
下载安装下面是监听本机24224端口收到日志,转发到192.168.199.116节点的ES上,索引名为docker_YYYY_mm
start td-agent
启动容器
1.首先修改nginx的日志格式为json
2.启动容器
使用docker内置的日志驱动把日志传出给fluentd
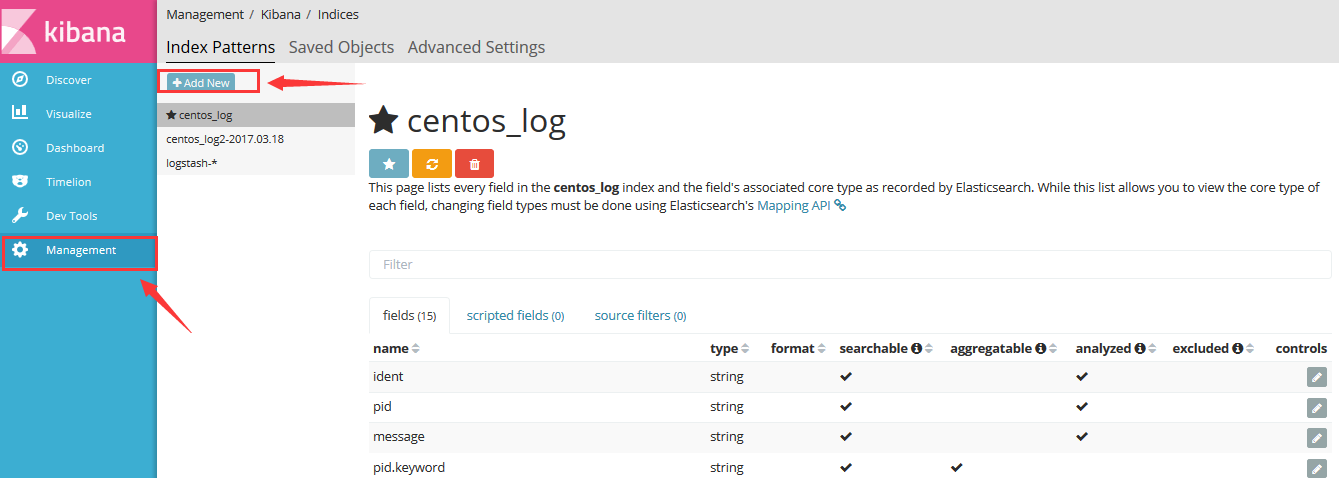
启动kibana
现在对web页面索引搜索进行配置
添加索引


现在你可以去看看你的日志了
查找发现
配置时间
配置最近15分钟的日志
开始搜索

现在大家可以开始通过kibana索搜日志了,但这个架构会出现一个问题,当es重启过程中会丢失部分日志,这时候我们就需要一个稳定的消息管理工具。这里我推荐大家使用kafka。
官网地址:http://kafka.apache.org/
下面是一些我写的其它帮助文档:
0. docker安装
阿里云加速你的docker
运行你第一个镜像实例-docker容器
docker命令参数
docker仓库使用和镜像提交
docker镜像构建构建及参数详解
docker镜像的导入导出
docker的网络
docker网络的测试示例
docker数据卷
docker的api和python sdk
单机多容器的编排-compose
docker-swarm集群的管理-swarm
docker-swarm集群管理详解
docker-swarm集群中删除节点和服务
docker自建仓库Registry
使用技巧和推荐docker集群web页面管理工具
不要再给你的docker安装ssh server
compose快速创建zookeeper集群
具体使用如下:
安装ES
1. 初始化环境
[root@salt-node1 src]# vim /etc/sysctl.conf
vm.max_map_count = 290000

[root@salt-node1 src]#vim/etc/security/limits.conf
*        hard  nproc           20000
*        soft  nproc           20000
*        soft  nofile          290000
*        hard  nofile          290000

[root@salt-node1 src]# cat /etc/security/limits.d/20-nproc.conf
# Default limit for number of user's processes to prevent
# accidental fork bombs.
# See rhbz #432903 for reasoning.

*          soft    nproc    290000
root       soft   nproc     unlimited

[root@salt-node1 src]# sysctl -p
net.ipv4.ip_forward = 1
vm.max_map_count = 290000
[root@salt-node1 src]# su - java
Last login: Sat Mar 18 00:40:54 CST 2017 on pts/1

查看参数是否生效
[java@salt-node1 ~]$ ulimit -n
290000
2.下载elasticsearch安装包并安装
[root@salt-node1 src]# wget https://artifacts.elastic.co/downloads/elasticsearch/elasticsearch-5.2.2.tar.gz [root@salt-node1 src]# tar zxf elasticsearch-5.2.2.tar.gz && mv elasticsearch-5.2.2 /usr/local/elasticsearch
cluster.name: docker_log
network.host: 0.0.0.0
[root@salt-node1 local]# useradd java
[root@salt-node1 local]# chown -R java:java elasticsearch
[java@salt-node1 ~]$ nohup  /usr/local/elasticsearch/bin/elasticsearch &
[java@salt-node1 elasticsearch]$ curl localhost:9200
{
"name" : "t3_jC3D",
"cluster_name" : "elasticsearch",
"cluster_uuid" : "ylQzD_hERziK29YF6O5bYg",
"version" : {
"number" : "5.2.2",
"build_hash" : "f9d9b74",
"build_date" : "2017-02-24T17:26:45.835Z",
"build_snapshot" : false,
"lucene_version" : "6.4.1"
},
"tagline" : "You Know, for Search"
}
安装fluentd
下载安装下面是监听本机24224端口收到日志,转发到192.168.199.116节点的ES上,索引名为docker_YYYY_mm
rpm -ivh http://packages.treasuredata.com.s3.amazonaws.com/2/redhat/7/x86_64/td-agent-2.1.3-0.x86_64.rpm
[root@salt-node1 elasticsearch]# chown 777 /var/log/messages
[root@salt-node1 elasticsearch]# cat /etc/td-agent/td-agent.conf
<source>
type forward
bind 0.0.0.0
port 24224
linger_timeout 0
log_level info
</source>

#下面的filter会把所有标签为docker开头的日志里面的log字段进行单独解析,且这些日志的格式都为json
<filter docker.**>
@type parser
format json
key_name log
</filter>

<match docker.**>
type elasticsearch
host 192.168.198.116
port 9200
logstash_format true
logstash_prefix docker
logstash_dateformat %Y_%m
index_name docker_log
flush_interval 5s
type_name docker
include_tag_key true
</match>
2. 启动fluentd服务systemctl
start td-agent
1.首先修改nginx的日志格式为json
log_format  main  '{"remote_addr": "$remote_addr", "remote_user": "$remote_user","time_local": "$time_local","request": "$request", '
'"status": "$status", "body_bytes_sent":"$body_bytes_sent","http_referer": "$http_referer" ,'
'"http_user_agent": "$http_user_agent", "http_x_forwarded_for":"$http_x_forwarded_for"}';
2.启动容器
使用docker内置的日志驱动把日志传出给fluentd
docker run -dit -p 8080:80\
-v /test/nginx.conf:/etc/nginx/nginx.conf \
--log-driver=fluentd \
--log-opt fluentd-address=localhost:24224 \
--log-opt tag="docker.``.`Name`" \
nginx
#测试docker访问正常
[root@test-node3 ~]# curl localhost:8080
<!DOCTYPE html>
<html>
<head>
<title>Welcome to nginx!</title>
<style>
body {
width: 35em;
margin: 0 auto;
font-family: Tahoma, Verdana, Arial, sans-serif;
}
</style>
</head>
<body>
<h1>Welcome to nginx!</h1>
<p>If you see this page, the nginx web server is successfully installed and
working. Further configuration is required.</p>

<p>For online documentation and support please refer to
<a href="http://nginx.org/">nginx.org</a>.<br/>
Commercial support is available at
<a href="http://nginx.com/">nginx.com</a>.</p>

<p><em>Thank you for using nginx.</em></p>
</body>
</html>
安装kibana
下载kibanawget [root@salt-node1' target='_blank'>https://artifacts.elastic.co/downloads/kibana/kibana-5.2.2-linux-x86_64.tar.gz[code=bash][root@salt-node1 src]# tar zxf kibana-5.2.2-linux-x86_64.tar.gz [root@salt-node1 src]# mv kibana-5.2.2-linux-x86_64 /usr/local/kibana [root@salt-node1 src]# cd /usr/local/kibana/ [root@salt-node1 kibana]# vim config/kibana.yml server.host: "192.168.198.116" elasticsearch.url: "http://localhost:9200"启动kibana
[root@salt-node1 kibana]# ./bin/kibana
log   [17:06:42.720] [info][status][plugin:kibana@5.2.2] Status changed from uninitialized to green - Ready
log   [17:06:42.831] [info][status][plugin:elasticsearch@5.2.2] Status changed from uninitialized to yellow - Waiting for Elasticsearch
log   [17:06:42.877] [info][status][plugin:console@5.2.2] Status changed from uninitialized to green - Ready
log   [17:06:42.970] [info][status][plugin:elasticsearch@5.2.2] Status changed from yellow to green - Kibana index ready
log   [17:06:43.551] [info][status][plugin:timelion@5.2.2] Status changed from uninitialized to green - Ready
log   [17:06:43.559] [info][listening] Server running at http://192.168.198.116:5601 log   [17:06:43.562] [info][status][ui settings] Status changed from uninitialized to green - Ready
现在对web页面索引搜索进行配置
添加索引
现在你可以去看看你的日志了
查找发现
配置时间
配置最近15分钟的日志
开始搜索
现在大家可以开始通过kibana索搜日志了,但这个架构会出现一个问题,当es重启过程中会丢失部分日志,这时候我们就需要一个稳定的消息管理工具。这里我推荐大家使用kafka。
官网地址:http://kafka.apache.org/
下面是一些我写的其它帮助文档:
0. docker安装
阿里云加速你的docker
运行你第一个镜像实例-docker容器
docker命令参数
docker仓库使用和镜像提交
docker镜像构建构建及参数详解
docker镜像的导入导出
docker的网络
docker网络的测试示例
docker数据卷
docker的api和python sdk
单机多容器的编排-compose
docker-swarm集群的管理-swarm
docker-swarm集群管理详解
docker-swarm集群中删除节点和服务
docker自建仓库Registry
使用技巧和推荐docker集群web页面管理工具
不要再给你的docker安装ssh server
compose快速创建zookeeper集群

相关文章推荐
- 日志系统之基于flume收集docker容器日志
- docker日志的故事——详解Docker日志运维
- Docker构建ELK Docker集群日志收集系统
- Docker 容器日志收集
- AVAYA AEP运维之日志收集总结
- 万能日志数据收集器 Fluentd - 每天5分钟玩转 Docker 容器技术(91)
- 6.3.1版本elk+redis+filebeat收集docker+swarm日志分析
- 打造高效的运维日志收集与分析平台
- 万能日志数据收集器 Fluentd - 每天5分钟玩转 Docker 容器技术(91)
- 日志收集平台Graylog2以及Nxlog的安装与配置(基于docker)
- 结合Docker快速搭建ELK日志收集分析平台
- 万能日志数据收集器 Fluentd - 每天5分钟玩转 Docker 容器技术(91)
- 使用Graylog2收集Docker日志
- 万能日志数据收集器 Fluentd - 每天5分钟玩转 Docker 容器技术(91)
- elk6.3.1+zookeeper+kafka+filebeat收集dockerswarm容器日志
- Flume+Kafka收集Docker容器内分布式日志应用实践
- 通过fluentd收集docker日志
- Docker日志收集最佳实践
- Docker 日志都在哪里?怎么收集?
- 数据库中索引重建以及收集统计值-------运维日志31