zabbix3.0.4监控nginx性 推荐
2017-01-16 21:57
288 查看
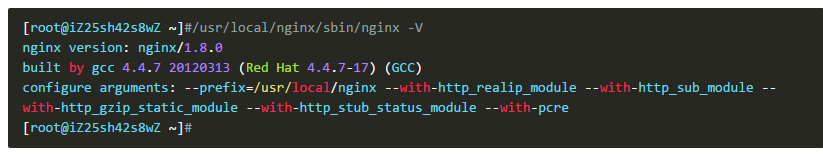
在zabbix agentd客户端上,查看nginx是否加载了–with-http_stub_status_module。因为zabbix监控nginx是根据nginx的Stub Status模块,抓取Status模块所提供的数据。假如以前没开启,现在想启用StubStatus 模块,在编译nginx 的时候要加上参数 –with-http_stub_status_module,执行./configure && make就可以了,不用make install。不过,一般情况下都是安装了的。
检查with-http_stub_status_module有没有安装
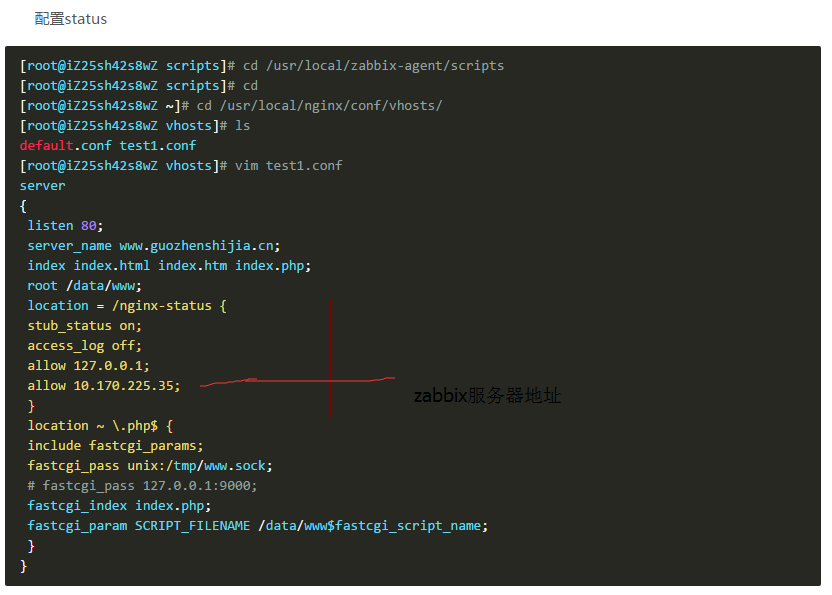
nginx status 开启方法:
启动nginx
用curl做测试
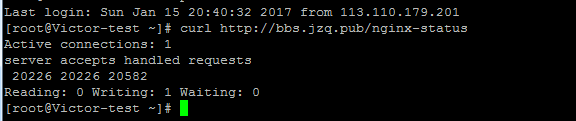
状态页面各项数据的意义:
active connections – 当前 Nginx 正处理的活动连接数。
serveraccepts handled requests — 总共处理了 233851 个连接 , 成功创建 233851 次握手 (证明中间没有失败的 ), 总共处理了 687942 个请求 ( 平均每次握手处理了 2.94 个数据请求 )。
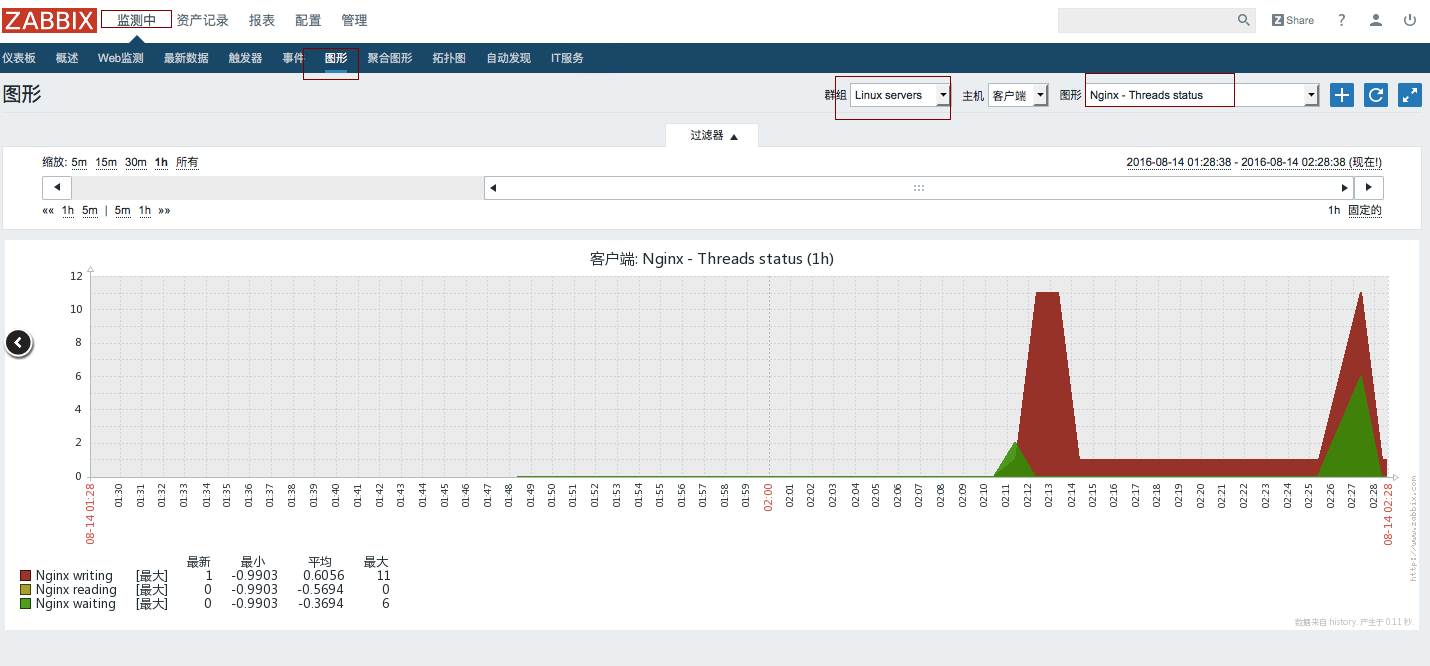
reading — nginx 读取到客户端的 Header 信息数。
writing — nginx 返回给客户端的 Header 信息数。
waiting — 开启 keep-alive 的情况下,这个值等于 active – (reading + writing), 意思就是 Nginx 已经处理完正在等候下一次请求指令的驻留连接。
zabbix-agent 配置有3个步骤,首先是编写获取Nginx信息脚本,接着配置中增加key信息,然后重启agent 服务。①编写Nginx监控脚本,记住路径,后面配置需要用到,注意脚本权限问题,agent运行用户要能执行。
mkidr -p /usr/local/zabbix-agent/scripts/cd /usr/local/zabbix-agent/scriptsvi nginx-check.sh#!/bin/bash
##################################
# Zabbix monitoring script
#
# nginx:
# - anything available via nginx stub-status module
#
##################################
# Contact:
# vincent.viallet@gmail.com
# Zabbix requested parameter
ZBX_REQ_DATA="$1"
ZBX_REQ_DATA_URL="$2"
# Nginx defaults
NGINX_STATUS_DEFAULT_URL="http://bbs.jzq.pub/nginx-status" #(这里写网站的域名)
WGET_BIN="/usr/bin/wget"
#
# Error handling:
# - need to be displayable in Zabbix (avoid NOT_SUPPORTED)
# - items need to be of type "float" (allow negative + float)
#
ERROR_NO_ACCESS_FILE="-0.9900"
ERROR_NO_ACCESS="-0.9901"
ERROR_WRONG_PARAM="-0.9902"
ERROR_DATA="-0.9903" # either can not connect / bad host / bad port
# Handle host and port if non-default
if [ ! -z "$ZBX_REQ_DATA_URL" ]; then
URL="$ZBX_REQ_DATA_URL"
else
URL="$NGINX_STATUS_DEFAULT_URL"
fi
# save the nginx stats in a variable for future parsing
NGINX_STATS=$($WGET_BIN -q $URL -O - 2> /dev/null)
# error during retrieve
if [ $? -ne 0 -o -z "$NGINX_STATS" ]; then
echo $ERROR_DATA
exit 1
fi
#
# Extract data from nginx stats
#
case $ZBX_REQ_DATA in
active_connections) echo "$NGINX_STATS" | head -1 | cut -f3 -d' ';;
accepted_connections) echo "$NGINX_STATS" | grep -Ev '[a-zA-Z]' | cut -f2 -d' ';;
handled_connections) echo "$NGINX_STATS" | grep -Ev '[a-zA-Z]' | cut -f3 -d' ';;
handled_requests) echo "$NGINX_STATS" | grep -Ev '[a-zA-Z]' | cut -f4 -d' ';;
reading) echo "$NGINX_STATS" | tail -1 | cut -f2 -d' ';;
writing) echo "$NGINX_STATS" | tail -1 | cut -f4 -d' ';;
waiting) echo "$NGINX_STATS" | tail -1 | cut -f6 -d' ';;
*) echo $ERROR_WRONG_PARAM; exit 1;;
esac
exit 0
~
agent的配置文件 /etc/zabbix/zabbix_agentd.conf 中定义了其他key的包含目录 Include=/etc/zabbix/zabbix_agentd.d/, 如果没有这个配置请自己添加下。接着在 /etc/zabbix/zabbix_agentd.d/ 目录新建一个文件 nginx-params.conf, 内容如下
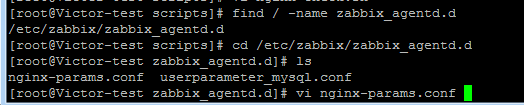
加入以下内容:
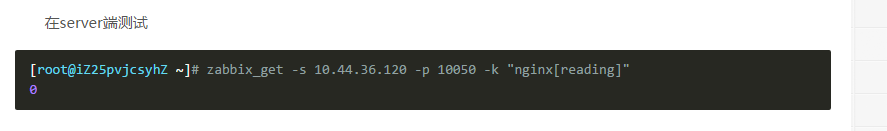
UserParameter=nginx[*],/usr/local/zabbix-agent/scripts/nginx-check.sh "$1"

/etc/init.d/zabbix-agent restart
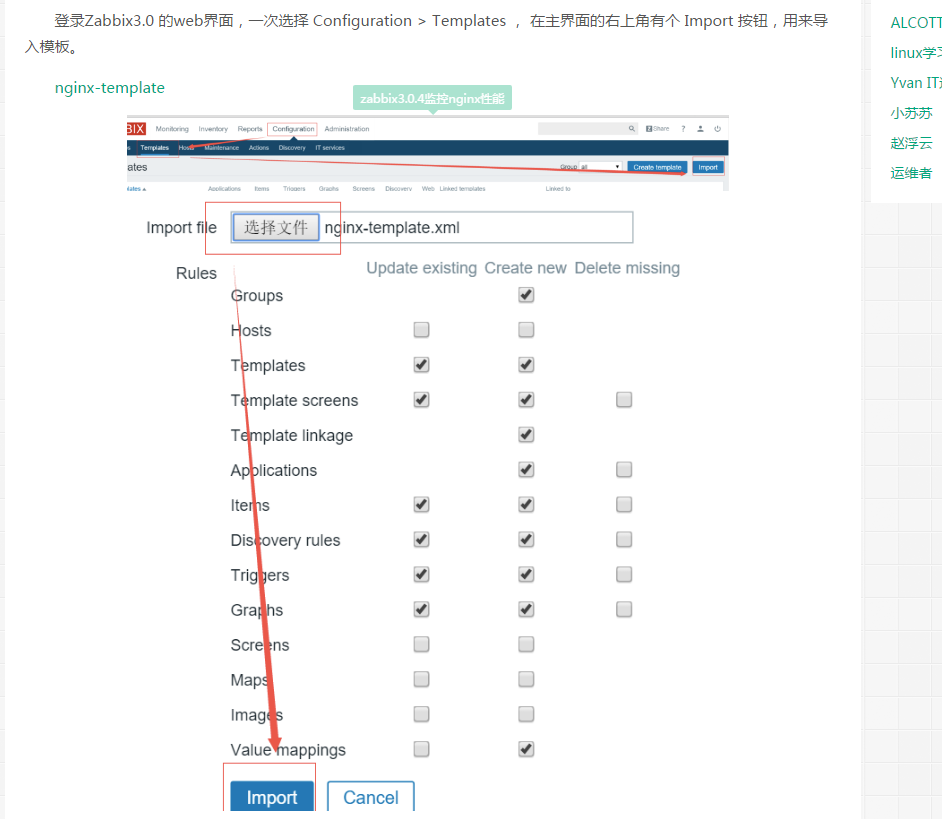
模板文件比较长留一个下载地址https://github.com/jizhang/zabbix-templates/blob/master/nginx/nginx-template.xml
在新建的主机--选择该模板。
检查with-http_stub_status_module有没有安装
nginx status 开启方法:
server {
...
location /status {
stub_status on;
access_log off;
allow 123.123.123.123; # zabbix服务器IP地址,一般是内网地址。
allow 127.0.0.1;
deny all;
}在nginx配置文件中:启动nginx
[root@iZ25sh42s8wZ vhosts]# /usr/local/nginx/sbin/nginx -t
nginx: the configuration file /usr/local/nginx/conf/nginx.conf syntax is ok
nginx: configuration file /usr/local/nginx/conf/nginx.conf test is successful
[root@iZ25sh42s8wZ vhosts]# /etc/init.d/nginx reload
Reloading Nginx: [ OK ]
用curl做测试
状态页面各项数据的意义:
active connections – 当前 Nginx 正处理的活动连接数。
serveraccepts handled requests — 总共处理了 233851 个连接 , 成功创建 233851 次握手 (证明中间没有失败的 ), 总共处理了 687942 个请求 ( 平均每次握手处理了 2.94 个数据请求 )。
reading — nginx 读取到客户端的 Header 信息数。
writing — nginx 返回给客户端的 Header 信息数。
waiting — 开启 keep-alive 的情况下,这个值等于 active – (reading + writing), 意思就是 Nginx 已经处理完正在等候下一次请求指令的驻留连接。
zabbix-agent 配置有3个步骤,首先是编写获取Nginx信息脚本,接着配置中增加key信息,然后重启agent 服务。①编写Nginx监控脚本,记住路径,后面配置需要用到,注意脚本权限问题,agent运行用户要能执行。
mkidr -p /usr/local/zabbix-agent/scripts/cd /usr/local/zabbix-agent/scriptsvi nginx-check.sh#!/bin/bash
##################################
# Zabbix monitoring script
#
# nginx:
# - anything available via nginx stub-status module
#
##################################
# Contact:
# vincent.viallet@gmail.com
# Zabbix requested parameter
ZBX_REQ_DATA="$1"
ZBX_REQ_DATA_URL="$2"
# Nginx defaults
NGINX_STATUS_DEFAULT_URL="http://bbs.jzq.pub/nginx-status" #(这里写网站的域名)
WGET_BIN="/usr/bin/wget"
#
# Error handling:
# - need to be displayable in Zabbix (avoid NOT_SUPPORTED)
# - items need to be of type "float" (allow negative + float)
#
ERROR_NO_ACCESS_FILE="-0.9900"
ERROR_NO_ACCESS="-0.9901"
ERROR_WRONG_PARAM="-0.9902"
ERROR_DATA="-0.9903" # either can not connect / bad host / bad port
# Handle host and port if non-default
if [ ! -z "$ZBX_REQ_DATA_URL" ]; then
URL="$ZBX_REQ_DATA_URL"
else
URL="$NGINX_STATUS_DEFAULT_URL"
fi
# save the nginx stats in a variable for future parsing
NGINX_STATS=$($WGET_BIN -q $URL -O - 2> /dev/null)
# error during retrieve
if [ $? -ne 0 -o -z "$NGINX_STATS" ]; then
echo $ERROR_DATA
exit 1
fi
#
# Extract data from nginx stats
#
case $ZBX_REQ_DATA in
active_connections) echo "$NGINX_STATS" | head -1 | cut -f3 -d' ';;
accepted_connections) echo "$NGINX_STATS" | grep -Ev '[a-zA-Z]' | cut -f2 -d' ';;
handled_connections) echo "$NGINX_STATS" | grep -Ev '[a-zA-Z]' | cut -f3 -d' ';;
handled_requests) echo "$NGINX_STATS" | grep -Ev '[a-zA-Z]' | cut -f4 -d' ';;
reading) echo "$NGINX_STATS" | tail -1 | cut -f2 -d' ';;
writing) echo "$NGINX_STATS" | tail -1 | cut -f4 -d' ';;
waiting) echo "$NGINX_STATS" | tail -1 | cut -f6 -d' ';;
*) echo $ERROR_WRONG_PARAM; exit 1;;
esac
exit 0
~
chmod o+x /usr/local/zabbix-agent/scripts/nginx-check.sh
agent的配置文件 /etc/zabbix/zabbix_agentd.conf 中定义了其他key的包含目录 Include=/etc/zabbix/zabbix_agentd.d/, 如果没有这个配置请自己添加下。接着在 /etc/zabbix/zabbix_agentd.d/ 目录新建一个文件 nginx-params.conf, 内容如下
加入以下内容:
UserParameter=nginx[*],/usr/local/zabbix-agent/scripts/nginx-check.sh "$1"
/etc/init.d/zabbix-agent restart
模板文件比较长留一个下载地址https://github.com/jizhang/zabbix-templates/blob/master/nginx/nginx-template.xml
在新建的主机--选择该模板。

相关文章推荐
- zabbix3.0.4客户端安装及网卡流量监控配置 推荐
- 我是怎么通过zabbix监控60台阿里云的RDS和redis数据库的 推荐
- zabbix3.0.4利用iostat工具监控centos主机磁盘IO
- zabbix监控之同时向多人邮件报警 推荐
- ubuntu下zabbix服务器监控工具部署 推荐
- zabbix开源监控系列三(自定义key监控nginx_status) 推荐
- zabbix应用-监控mysql slave 主从状态 推荐
- zabbix 监控打印机 推荐
- CentOS64位6.5下部署Zabbix2.2.6监控系统 推荐
- 实战网络监控Zabbix(1)—— 远程监控主机服务 推荐
- 巧用Zabbix自定义监控Mysql性能状态 推荐
- Zabbix之JMX监控Tomcat 推荐
- Zabbix 1.8.1监控系统搭建 推荐
- 分布式监控系统Zabbix3.2添加自动发现磁盘IO并注册监控(推荐)
- zabbix自动发现mysql端口并监控 推荐
- 企业级监控软件Zabbix搭建部署之使用mutt+msmtp配置Zabbix邮件报警 推荐
- zabbix 3.0.4 监控windows 服务
- zabbix通过orabbix插件监控oracle 推荐
- zabbix proxy搭建及应用proxy监控腾讯CVM服务器 推荐
- 企业级监控软件Zabbix搭建部署之Zabbix-Agents的安装部署 推荐