Oracle Pivot函数语法详解及应用实例
2016-12-30 18:05
896 查看
遇到一个难题,需要将单列数据根据分列显示,需要用到Pivot语法。
参照现有的query,写了一段类似以下script片段的sql语句,问题搞定。经验总结:能用SQL搞定的问题,就不要人工去处理(效率低、易出错)。
OCD
AS
(
SELECT *
FROM (
SELECT DISTINCT
ra.HDP_ID,
'OCD' || CAST(ROW_NUMBER() OVER(PARTITION BY ra.HDP_ID
ORDER BY ra.HRA_ID desc) AS VARCHAR(10)) Seq,
p.PN_ID AS TNID,
p.PERSON_FULL_NAME AS OCD
FROM HDDO.HRA_V ra,
HDDO.PERSON_V p
WHERE p.HP_ID = ra.HP_ID
AND ra.CONTACT_ROLE = 'OCD'
)
PIVOT (
MAX(TNID) as TNID,
MAX(OCD)
FOR Seq in('OCD1' AS OCD1, 'OCD2' AS OCD2, 'OCD3' AS OCD3,'OCD4' AS OCD4,'OCD5' AS OCD5)
)
),
http://www.oracle.com/technetwork/articles/sql/11g-pivot-097235.html
-----------------------------------------------------------------------------------------------------------------------------------
See Series TOC
When this table is selected:
The output is:
Note how the data is represented as rows of values: For each customer, the record shows the customer's home state and how many times the customer purchased something from the store. As the customer purchases more items from the store, the column times_purchased
is updated.
Now consider a case where you want to have a report of the purchase frequency each state - that is, how many customers bought something only once, twice, thrice and so on, from each state. In regular SQL, you can issue the following statement:
Here is the output:
This is the information you want but it's a little hard to read. A better way to represent the same data may be through the use of crosstab reports, in which you can organized the data vertically and states horizontally, just like a spreadsheet:
Prior to Oracle Database 11g, you would do that via some sort of a decode function for each value and write each distinct value as a separate column. The technique is quite nonintuitive however.
Fortunately, you now have a great new feature called PIVOT for presenting any query in the crosstab format using a new operator, appropriately named
pivot. Here is how you write the query:
Here is the output:
This shows the power of the pivot operator. The state_codes are presented on the header row, instead of a column. Pictorially, here is the how the traditional tabular format looks:
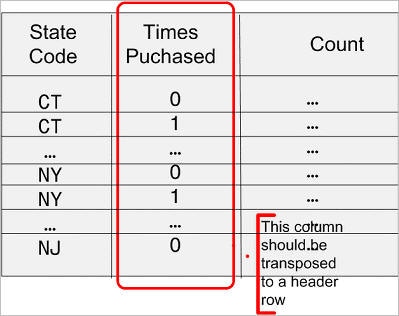
Figure 1 Traditional tabular representation
In a crosstab report, you want to transpose the Times Purchased column to the header row as shown in Figure 2. The column becomes the row, as if the column were rotated 90 degrees anti-clockwise to become the header row. This figurative rotation needs to
have a pivot point and in this case the pivot point happens to be the count(state_code) expression.
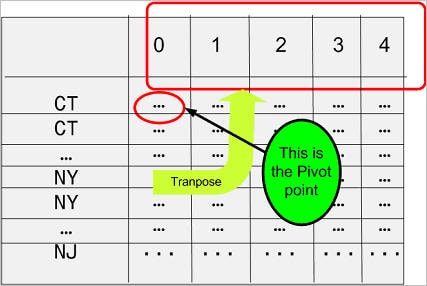
Figure 2 Pivoted representation
This expression needs to be in the syntax of the query:
The second line, "for state_code ...," limits the query to only those values. This line is necessary, so unfortunately you have to know the possible values beforehand. This restriction is relaxed in the XML format of the query, described later in this article.
Note the header rows in the output:
The column headers are the data from the table itself: the state codes. The abbreviations may be self explanatory but suppose you want to display the state names instead of abbreviations, ("Connecticut" instead of "CT")? In that case you have to make a little
adjustment in the query, in the FOR clause as shown below:
The FOR clause can have aliases for the values there, which will become the column headers.
参照现有的query,写了一段类似以下script片段的sql语句,问题搞定。经验总结:能用SQL搞定的问题,就不要人工去处理(效率低、易出错)。
OCD
AS
(
SELECT *
FROM (
SELECT DISTINCT
ra.HDP_ID,
'OCD' || CAST(ROW_NUMBER() OVER(PARTITION BY ra.HDP_ID
ORDER BY ra.HRA_ID desc) AS VARCHAR(10)) Seq,
p.PN_ID AS TNID,
p.PERSON_FULL_NAME AS OCD
FROM HDDO.HRA_V ra,
HDDO.PERSON_V p
WHERE p.HP_ID = ra.HP_ID
AND ra.CONTACT_ROLE = 'OCD'
)
PIVOT (
MAX(TNID) as TNID,
MAX(OCD)
FOR Seq in('OCD1' AS OCD1, 'OCD2' AS OCD2, 'OCD3' AS OCD3,'OCD4' AS OCD4,'OCD5' AS OCD5)
)
),
http://www.oracle.com/technetwork/articles/sql/11g-pivot-097235.html
-----------------------------------------------------------------------------------------------------------------------------------
Pivot
Present information in a spreadsheet-type crosstab report from any relational table using simple SQL.See Series TOC
Pivot
As you know, relational tables are, well, tabular—that is, they are presented in a column-value pair. Consider the case of a table named CUSTOMERS.SQL> desc customers Name Null? Type ----------------------------------------- -------- --------------------------- CUST_ID NUMBER(10) CUST_NAME VARCHAR2(20) STATE_CODE VARCHAR2(2) TIMES_PURCHASED NUMBER(3)
When this table is selected:
select cust_id, state_code, times_purchased
from customers
order by cust_id;
The output is:
CUST_ID STATE_CODE TIMES_PURCHASED
-------  ----------               ---------------
1 CT                       1
2 NY                      10
3 NJ                       2
4 NY                       4
...

and so on ...
Note how the data is represented as rows of values: For each customer, the record shows the customer's home state and how many times the customer purchased something from the store. As the customer purchases more items from the store, the column times_purchased
is updated.
Now consider a case where you want to have a report of the purchase frequency each state - that is, how many customers bought something only once, twice, thrice and so on, from each state. In regular SQL, you can issue the following statement:
select state_code, times_purchased, count(1) cnt
from customers
group by state_code, times_purchased;
Here is the output:
ST TIMES_PURCHASED        CNT
--         ---------------      ----------
CT               0         90
CT               1        165
CT               2        179
CT               3        173
CT               4        173
CT               5        152
...

and so on ...
This is the information you want but it's a little hard to read. A better way to represent the same data may be through the use of crosstab reports, in which you can organized the data vertically and states horizontally, just like a spreadsheet:
Times_purchased
CT           NY         NJ      ...

and so on ...

1             0            1          0      ...
2            23          119         37      ...
3            17           45          1      ...
...

and so on ...
Prior to Oracle Database 11g, you would do that via some sort of a decode function for each value and write each distinct value as a separate column. The technique is quite nonintuitive however.
Fortunately, you now have a great new feature called PIVOT for presenting any query in the crosstab format using a new operator, appropriately named
pivot. Here is how you write the query:
select * from (
select times_purchased, state_code
from customers t
)
pivot
(
count(state_code)
for state_code in ('NY','CT','NJ','FL','MO')
)
order by times_purchased
/
Here is the output:
. TIMES_PURCHASED       'NY'       'CT'       'NJ'       'FL'       'MO'
---------------      ----------      ----------      ----------       ----------      ----------
0      16601         90          0          0          0
1      33048        165          0          0          0
2      33151        179          0          0          0
3      32978        173          0          0          0
4      33109        173          0          1          0
... and so on ...
This shows the power of the pivot operator. The state_codes are presented on the header row, instead of a column. Pictorially, here is the how the traditional tabular format looks:
Figure 1 Traditional tabular representation
In a crosstab report, you want to transpose the Times Purchased column to the header row as shown in Figure 2. The column becomes the row, as if the column were rotated 90 degrees anti-clockwise to become the header row. This figurative rotation needs to
have a pivot point and in this case the pivot point happens to be the count(state_code) expression.
Figure 2 Pivoted representation
This expression needs to be in the syntax of the query:
...
pivot
(
count(state_code)
for state_code in ('NY','CT','NJ','FL','MO')
)
...
The second line, "for state_code ...," limits the query to only those values. This line is necessary, so unfortunately you have to know the possible values beforehand. This restriction is relaxed in the XML format of the query, described later in this article.
Note the header rows in the output:
. TIMES_PURCHASED       'NY'       'CT'       'NJ'       'FL'       'MO'
---------------      ----------      ----------      ----------      ----------       ----------
The column headers are the data from the table itself: the state codes. The abbreviations may be self explanatory but suppose you want to display the state names instead of abbreviations, ("Connecticut" instead of "CT")? In that case you have to make a little
adjustment in the query, in the FOR clause as shown below:
select * from (
select times_purchased as "Puchase Frequency", state_code
from customers t
)
pivot
(
count(state_code)
for state_code in ('NY' as "New York",'CT' "Connecticut",'NJ' "New Jersey",'FL' "Florida",'MO' as "Missouri")
)
order by 1
/

Puchase Frequency   New York Connecticut New Jersey    Florida   Missouri
-----------------      ----------     -----------       ----------      ----------      ----------
0      16601         90           0          0          0
1      33048        165           0          0          0
2      33151        179           0          0          0
3      32978        173           0          0          0
4      33109        173           0          1          0
...

and so on ...
The FOR clause can have aliases for the values there, which will become the column headers.

相关文章推荐
- Oracle列转行函数 Listagg() 语法详解及应用实例
- Oracle FIRST_VALUE函数语法详解及应用实例
- Oracle INSTR函数(子字符串查询)语法详解及应用实例
- Excel数据分析与业务建模_第四章_匹配函数MATCH(语法详解及应用实例)
- Excel数据分析与业务建模_第三章_引用函数INDEX(语法详解及应用实例)
- 详解C++中的纯虚函数(虚函数区别)&多态性以及实例应用
- Oracle 分析函数(10G)语法详解
- 【函数】oracle translate() 详解+实例
- Oracle排名函数(Rank)实例详解
- 实例讲解C语言OPEN函数语法及其应用
- ORACLE函数之GREATEST函数详解实例
- Oracle排名函数(Rank)实例详解
- Oracle排名函数(Rank)实例详解
- Oracle 分析函数(10G)语法详解(转)
- Oracle 分析函数(10G)语法详解
- Oracle 分析函数(10G)语法详解
- oracle分析函数row_number的实例应用
- Oracle排名函数(Rank)实例详解
- Oracle排名函数(Rank)实例详解
- Oracle排名函数(Rank)实例详解