python 性能分析器 profile
2016-11-04 21:56
344 查看
安装snakeviz
首先安装easy_install 点击打开链接安装snakeviz命令:easy_install snakeviz
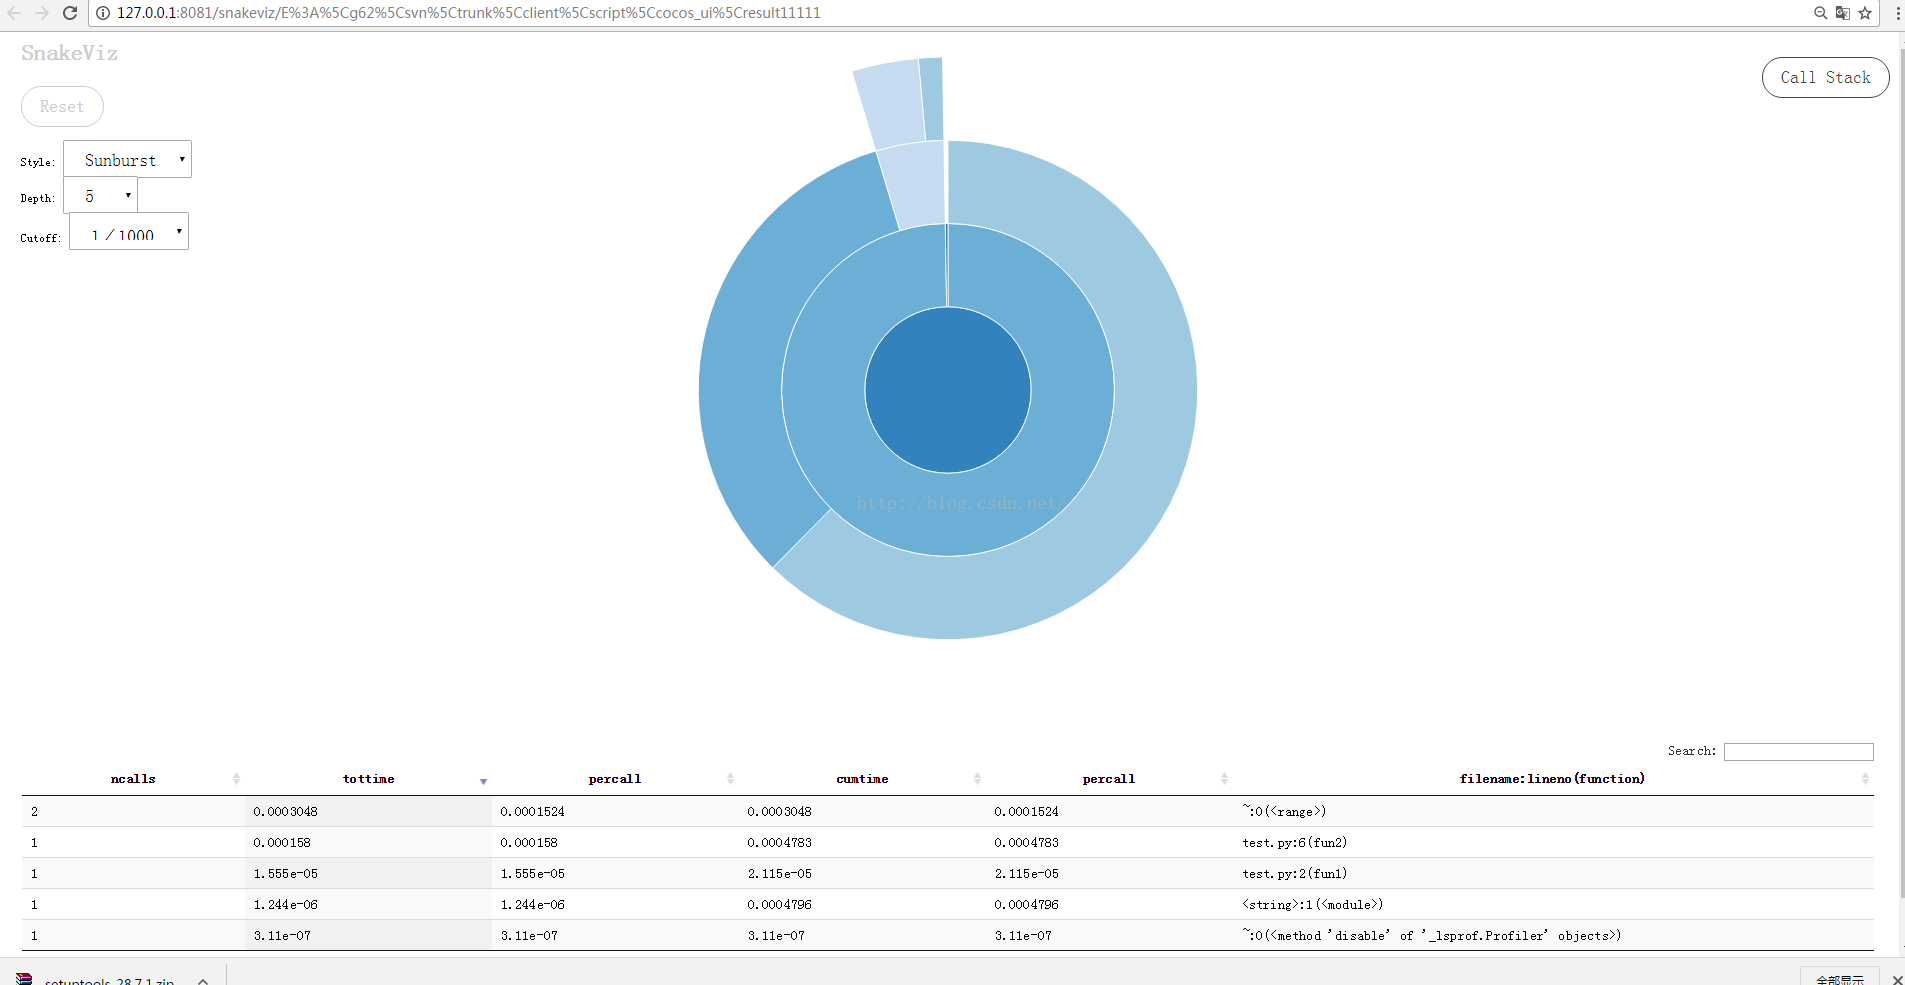
然后就开始实战吧
# -*- coding:utf-8 -*-
def fun1():
for i in range(0, 1000):
pass

def fun2():
for i in range(0, 10000):
pass
fun1()

import cProfile
cProfile.run('fun2()', "result")
在命令行运行:$snakeviz result

相关文章推荐
- cProfile——Python性能分析工具
- Python程序性能分析模块----------cProfile
- 使用 profile 进行python代码性能分析
- [转]Python Profile 工具性能分析
- 利用PyCharm的Profile工具进行Python性能分析
- python_性能分析profile
- python性能分析--cProfile
- Python性能分析器Profile
- 飘逸的python - 性能调优利器profile及其意义
- python的三种url库性能与效率分析
- 用Firebug调试JavaScript 性能分析工具firebug.console.profile(title) 转载
- Python程序的性能分析指南
- 【性能分析】初探VS2010中的Profile(性能剖析)功能
- Python程序的性能分析指南
- Python程序的性能分析指南
- Python性能分析指南 - 技术翻译 - 开源中国社区
- Python 程序的性能分析
- Python 调试以及性能分析
- python几个实际代码的性能分析
- [python]用profile协助程序性能优化