echarts页面图表工具的使用实例
2016-10-08 17:07
627 查看
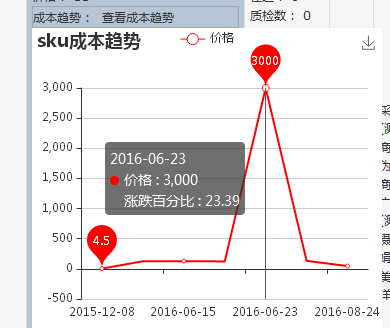
期望功能:折线图显示商品价格变动趋势图,然后在每个拐点的位置显示价格和涨跌百分比。
说明: 查询了很久,好像并不支持折点位置显示多个数值,除非画多个折线,把其他的折线颜色设置为白色,并且白色的折线最好放在首位,因为放在最后的话,如果有重叠的部分,可能会覆盖掉其他的折线。
实现:
1.需要下载引入echarts.min.js
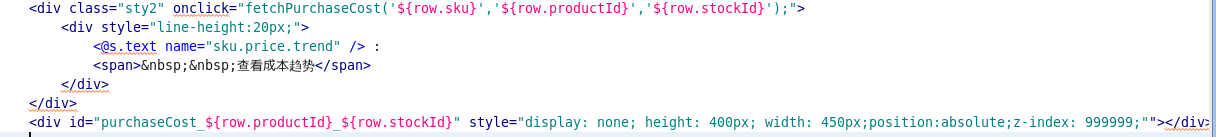
2.页面点击事件:查看成本趋势
3.js方法
function fetchPurchaseCost(sku, id, stockId){
var dom = $('purchaseCost_'+id +"_" + stockId);
if(dom.style.display == "block"){
dom.style.display = "none";
return;
}
var myChart = echarts.init(dom);
var app = {};
option = null;
option = {
title: {
text: 'sku成本趋势'
},
tooltip: {
trigger: 'axis'
},
legend: {
data:['价格']
},
grid: {
left: '3%',
right: '4%',
bottom: '3%',
containLabel: true
},
toolbox: {
feature: {
saveAsImage: {}
}
},
//设置x轴可拖动
dataZoom: [{
type: 'inside',
}],
xAxis: {
type: 'category',
data: []
},
yAxis: {
type: 'value'
},
series: [
{
name:'涨跌百分比',
type:'line',
data:[]
},
{
name:'价格',
type:'line',
data:[]
}
],
color:[
'#FF0000'
],
backgroundColor:[
'#FFFFFF'
]
};
myChart.showLoading(); //数据加载完之前先显示一段简单的loading动画
var tems=[]; //转化率数组(存放服务器返回的所有转化率值)
var dates=[]; //时间数组
var priceThans = []; // 涨跌百分比
var url = "/product/fetchPurchaseCost";
var param = $H({});
param.set("sku", sku)
new Ajax.Request(url, {
parameters: param,
onSuccess: function (transport) {
var result = eval(transport.responseText);
//请求成功时执行该函数内容,result即为服务器返回的json对象
if (result != null && result.length > 0) {
for(var i=0;i<result.length;i++){
var resultMap = result[i];
tems.push(resultMap.purchasePrice);
dates.push(resultMap.orderDate);
priceThans.push(resultMap.priceThan);
}
myChart.hideLoading(); //隐藏加载动画
myChart.setOption({ //载入数据
xAxis: {
boundaryGap: true,
data: dates //填入X轴数据
},
series: [ //填入系列(内容)数据
{
name: '涨跌百分比',
data: priceThans,
itemStyle : {
normal : {
color:'white',
lineStyle:{
color:'white'
}
}
},
},
{
// 根据名字对应到相应的系列
name: '价格',
data: tems,
itemStyle : {
normal : {
color:'red',
lineStyle:{
color:'red'
}
}
},
//显示最大值最小值的气泡
markPoint: {
data: [
{type: 'max', name: '最大值'},
{type: 'min', name: '最小值'},
]
}
}
]
});
}else {
//返回的数据为空时显示提示信息
alert("图表请求数据为空,可能服务器暂未录入数据,您可以稍后再试!");
myChart.hideLoading();
}
},
onFailure: function (transport) {
//请求失败时执行该函数
alert("图表请求数据失败,可能是服务器开小差了");
myChart.hideLoading();
}
});
if (option && typeof option === "object") {
myChart.setOption(option, true);
dom.style.display = "block";
}
}
4. struts.xml的配置

5.fetchPurchaseCost 方法
public void fetchPurchaseCost() throws IOException{
Gson gson = new Gson();
MyDate myDate = new MyDate();
Map<String, Object> requestMap = new HashMap<String, Object>();
String skuString = getSku();
ProductDao productDao = new ProductDao();
List<PurchaseCost> purchaseCosts = productDao.fetchPurchaseCostBySku(skuString);
PrintWriter out = ServletActionContext.getResponse().getWriter();
String oldDate = myDate.getDate(-30);
ArrayList<String> dateList = myDate.splitDateRange(oldDate, myDate.getCurrentDate());
List<Map<String, Object>> resultList = new ArrayList<Map<String, Object>>();
double lastPrice = 0.0;
for (String date : dateList) {
Map<String, Object> resultMap = new HashMap<String, Object>();
if (CollectionUtils.isNotEmpty(purchaseCosts)) {
for (PurchaseCost purchaseCost : purchaseCosts) {
String orderCreateDate = purchaseCost.getOrderCreateDate();
String [] ordercreateStrings = orderCreateDate.split(" ");
if (date.equals(ordercreateStrings[0])){
resultMap.put("orderDate", date);
resultMap.put("purchasePrice", purchaseCost.getPurchasePrice());
double priceThan = 0.0;
if (lastPrice != 0.0) {
priceThan = (purchaseCost.getPurchasePrice() - lastPrice )/lastPrice;
}
resultMap.put("priceThan", priceThan);
lastPrice = purchaseCost.getPurchasePrice();
}
}
}
if (resultMap.isEmpty()) {
resultMap.put("orderDate", date);
resultMap.put("purchasePrice", 0);
double priceThan = 0.0;
if (lastPrice != 0.0) {
priceThan = (0 - lastPrice )/lastPrice;
}
resultMap.put("priceThan", priceThan);
lastPrice = 0;
}
resultList.add(resultMap);
}
out.flush();
out.print(gson.toJson(resultList));
}
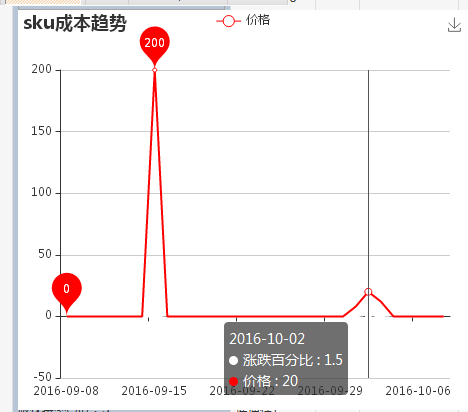
6.效果图
--------------------------------------------------------以下为2016-10-11 15:34 补充说明----------------------------------------
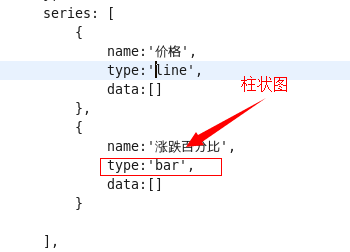
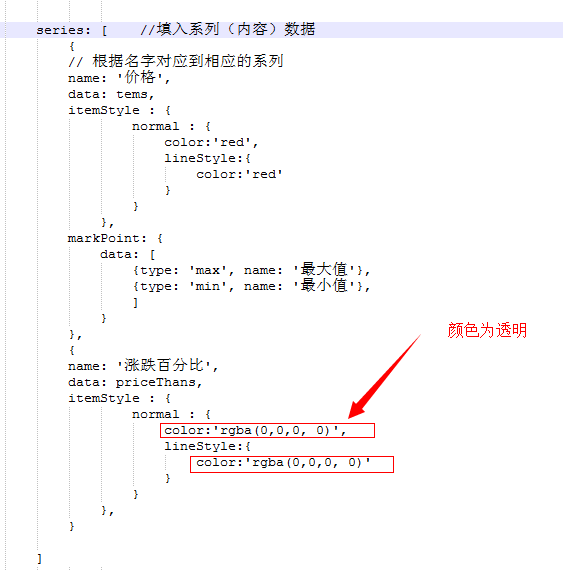
对于之前做出的效果,由于把涨跌百分比的折线设置为白色,这样会在折线与X轴相交的时候,出现断开的现象,于是想到把涨跌百分比的折线设置为透明,并且设置为柱状图(因为测试发现,折线图还是会覆盖掉一部分X轴),具体改动如下:
另外,如果要改变图表的大小,直接修改存放图表的div的样式即可。
改进之后的效果图如下:
END !
说明: 查询了很久,好像并不支持折点位置显示多个数值,除非画多个折线,把其他的折线颜色设置为白色,并且白色的折线最好放在首位,因为放在最后的话,如果有重叠的部分,可能会覆盖掉其他的折线。
实现:
1.需要下载引入echarts.min.js
2.页面点击事件:查看成本趋势
3.js方法
function fetchPurchaseCost(sku, id, stockId){
var dom = $('purchaseCost_'+id +"_" + stockId);
if(dom.style.display == "block"){
dom.style.display = "none";
return;
}
var myChart = echarts.init(dom);
var app = {};
option = null;
option = {
title: {
text: 'sku成本趋势'
},
tooltip: {
trigger: 'axis'
},
legend: {
data:['价格']
},
grid: {
left: '3%',
right: '4%',
bottom: '3%',
containLabel: true
},
toolbox: {
feature: {
saveAsImage: {}
}
},
//设置x轴可拖动
dataZoom: [{
type: 'inside',
}],
xAxis: {
type: 'category',
data: []
},
yAxis: {
type: 'value'
},
series: [
{
name:'涨跌百分比',
type:'line',
data:[]
},
{
name:'价格',
type:'line',
data:[]
}
],
color:[
'#FF0000'
],
backgroundColor:[
'#FFFFFF'
]
};
myChart.showLoading(); //数据加载完之前先显示一段简单的loading动画
var tems=[]; //转化率数组(存放服务器返回的所有转化率值)
var dates=[]; //时间数组
var priceThans = []; // 涨跌百分比
var url = "/product/fetchPurchaseCost";
var param = $H({});
param.set("sku", sku)
new Ajax.Request(url, {
parameters: param,
onSuccess: function (transport) {
var result = eval(transport.responseText);
//请求成功时执行该函数内容,result即为服务器返回的json对象
if (result != null && result.length > 0) {
for(var i=0;i<result.length;i++){
var resultMap = result[i];
tems.push(resultMap.purchasePrice);
dates.push(resultMap.orderDate);
priceThans.push(resultMap.priceThan);
}
myChart.hideLoading(); //隐藏加载动画
myChart.setOption({ //载入数据
xAxis: {
boundaryGap: true,
data: dates //填入X轴数据
},
series: [ //填入系列(内容)数据
{
name: '涨跌百分比',
data: priceThans,
itemStyle : {
normal : {
color:'white',
lineStyle:{
color:'white'
}
}
},
},
{
// 根据名字对应到相应的系列
name: '价格',
data: tems,
itemStyle : {
normal : {
color:'red',
lineStyle:{
color:'red'
}
}
},
//显示最大值最小值的气泡
markPoint: {
data: [
{type: 'max', name: '最大值'},
{type: 'min', name: '最小值'},
]
}
}
]
});
}else {
//返回的数据为空时显示提示信息
alert("图表请求数据为空,可能服务器暂未录入数据,您可以稍后再试!");
myChart.hideLoading();
}
},
onFailure: function (transport) {
//请求失败时执行该函数
alert("图表请求数据失败,可能是服务器开小差了");
myChart.hideLoading();
}
});
if (option && typeof option === "object") {
myChart.setOption(option, true);
dom.style.display = "block";
}
}
4. struts.xml的配置
5.fetchPurchaseCost 方法
public void fetchPurchaseCost() throws IOException{
Gson gson = new Gson();
MyDate myDate = new MyDate();
Map<String, Object> requestMap = new HashMap<String, Object>();
String skuString = getSku();
ProductDao productDao = new ProductDao();
List<PurchaseCost> purchaseCosts = productDao.fetchPurchaseCostBySku(skuString);
PrintWriter out = ServletActionContext.getResponse().getWriter();
String oldDate = myDate.getDate(-30);
ArrayList<String> dateList = myDate.splitDateRange(oldDate, myDate.getCurrentDate());
List<Map<String, Object>> resultList = new ArrayList<Map<String, Object>>();
double lastPrice = 0.0;
for (String date : dateList) {
Map<String, Object> resultMap = new HashMap<String, Object>();
if (CollectionUtils.isNotEmpty(purchaseCosts)) {
for (PurchaseCost purchaseCost : purchaseCosts) {
String orderCreateDate = purchaseCost.getOrderCreateDate();
String [] ordercreateStrings = orderCreateDate.split(" ");
if (date.equals(ordercreateStrings[0])){
resultMap.put("orderDate", date);
resultMap.put("purchasePrice", purchaseCost.getPurchasePrice());
double priceThan = 0.0;
if (lastPrice != 0.0) {
priceThan = (purchaseCost.getPurchasePrice() - lastPrice )/lastPrice;
}
resultMap.put("priceThan", priceThan);
lastPrice = purchaseCost.getPurchasePrice();
}
}
}
if (resultMap.isEmpty()) {
resultMap.put("orderDate", date);
resultMap.put("purchasePrice", 0);
double priceThan = 0.0;
if (lastPrice != 0.0) {
priceThan = (0 - lastPrice )/lastPrice;
}
resultMap.put("priceThan", priceThan);
lastPrice = 0;
}
resultList.add(resultMap);
}
out.flush();
out.print(gson.toJson(resultList));
}
6.效果图
--------------------------------------------------------以下为2016-10-11 15:34 补充说明----------------------------------------
对于之前做出的效果,由于把涨跌百分比的折线设置为白色,这样会在折线与X轴相交的时候,出现断开的现象,于是想到把涨跌百分比的折线设置为透明,并且设置为柱状图(因为测试发现,折线图还是会覆盖掉一部分X轴),具体改动如下:
另外,如果要改变图表的大小,直接修改存放图表的div的样式即可。
改进之后的效果图如下:
END !

相关文章推荐
- 使用ECharts在jsp页面上绘制动态图表 (补16年12月)
- 在vue中使用echarts图表实例代码详解
- Vue2 使用 Echarts 创建图表实例代码
- 【PythonDjango后台实例 第四章】Python3.6.1+Bootstrap3+echarts 在HTML网页中使用echarts展示图表
- C# HTML解析工具HtmlAgilityPack使用实例(二)--Web页面
- 在Java web页面使用ECharts制作图表
- 关于echarts 同页面多图表同实例名resize只变一个的解决方法
- Web前端高级报表工具的使用:ECharts图表工具
- ECharts图表使用实例(多条折线图)--JAVA
- ASP.NET中使用OWC绘制图表实例[转]
- AjaxControlToolkit工具的使用实例及注意事项
- 使用Web验证工具:Unicorn,构建规范Web页面
- eclipse enable to open external editor 和 设置查看页面源代码的默认使用工具
- 使用ASP.NET页面创建可视的UI,在客户机上实例化MSXML分析器的页面从中间层组件取出XML数据、操作并显示 并有问题请高手解决
- Android 实例-个人理财工具 之六 完善明细显示页面,附工程代码
- Silverlight实用窍门系列:15.Visifire图表控件的使用二(DataPoint点击事件和Legend文字标注栏的点击事件)【附带源码实例】
- Silverlight-Visifire图表使用示例发布时空白页面的解决办法
- jqPlot jquery的页面图表绘制工具
- 交互工具Axure使用技巧----master内部交互元素添加事件操作master以外页面元素
- 如何通过在 SQL Server 的早期版本使用客户端工具连接到的 SQL Server 2005 或 SQL Server 2000 命名实例