分布式时序数据库InfluxDB
2016-08-05 11:22
363 查看
InfluxDB 是一个开源分布式时序、事件和指标数据库。使用 Go 语言编写,无需外部依赖。其设计目标是实现分布式和水平伸缩扩展。
它有三大特性:
1. Time Series (时间序列):你可以使用与时间有关的相关函数(如最大,最小,求和等)
2. Metrics(度量):你可以实时对大量数据进行计算
3. Eevents(事件):它支持任意的事件数据
schemaless(无结构),可以是任意数量的列
Scalable
min, max, sum, count, mean, median 一系列函数,方便统计
Native HTTP API, 内置http支持,使用http读写
Powerful Query Language 类似sql
Built-in Explorer 自带管理工具
管理界面:
InfluxDB 支持两种api方式
HTTP API
Protobuf API
Protobuf 还未开发完成, 官网文档都没有
如何使用 http api 进行操作?
比如对于
数据放到body里。
数据看起来是这样的:
下面的"name": "events", 其中"events"就是一个
格式是json,可以在一个
time 在InfluxDB里是很重要的,毕竟InfluxDB是
在InfluxDB里还有个
InfluxDB 增删更查都是用http api来完成,甚至支持使用正则表达式删除数据,还有计划任务。
比如:
发送
body如下,
这个查询会删除大于14天的数据,并且任何以stats开头的数据,并且每天3:00 AM运行。更加详细查看官方文档: http://influxdb.org/docs/api/http.html
非常容易上手, 还支持
文档: http://influxdb.org/docs/query_language/
常用语言的库都有,因为api简单,也很容易自己封装。
InfluxdDB作为很多监控软件的后端,这样监控数据就可以直接存储在InfluxDB
还有其它的可视化工具支持InfluxDB, 这样就可以基于InfluxDB很方便的搭建监控平台
InfluxDB 用于存储基于时间的数据,比如监控数据,因为InfluxDB本身提供了Http API,所以可以使用InfluxDB很方便的搭建了个监控数据存储中心。
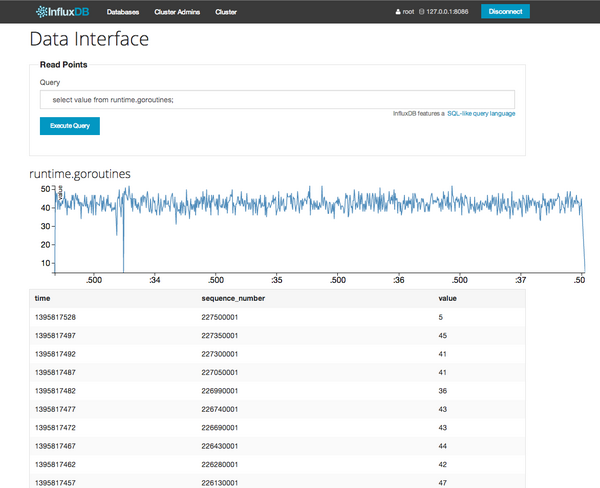
对于InfluxDB中的数据展示,官方admin有非常简单的图表, 看起来是这样的

除了自己写程序展示数据还可以选择:
tasseo https://github.com/obfuscurity/tasseo/
grafana https://github.com/torkelo/grafana
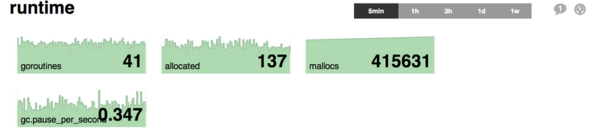
tasseo,为Graphite写的Live dashboard,现在也支持InfluxDB,tasseo 比较简单, 可以配置的选项很少。
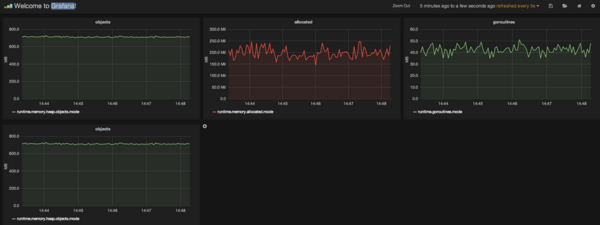
Grafana是一个纯粹的html/js应用,访问InfluxDB时不会有跨域访问的限制。只要配置好数据源为InfluxDB之后就可以,剩下的工作就是配置图表。Grafana 功能非常强大。使用ElasticsSearch保存DashBoard的定义文件,也可以Export出JSON文件(Save ->Advanced->Export Schema),然后上传回它的/app/dashboards目录。
配置数据源:
它有三大特性:
1. Time Series (时间序列):你可以使用与时间有关的相关函数(如最大,最小,求和等)
2. Metrics(度量):你可以实时对大量数据进行计算
3. Eevents(事件):它支持任意的事件数据
特点
schemaless(无结构),可以是任意数量的列Scalable
min, max, sum, count, mean, median 一系列函数,方便统计
Native HTTP API, 内置http支持,使用http读写
Powerful Query Language 类似sql
Built-in Explorer 自带管理工具
管理界面:
API
InfluxDB 支持两种api方式HTTP API
Protobuf API
Protobuf 还未开发完成, 官网文档都没有
如何使用 http api 进行操作?
比如对于
foo_production这个数据库,插入一系列数据,可以发现
POST请求到
/db/foo_production/series?u=some_user&p=some_password,
数据放到body里。
数据看起来是这样的:
下面的"name": "events", 其中"events"就是一个
series,类似关系型数据库的表table
| 1234567891011121314151617 | [ { "name": "events", "columns": ["state", "email", "type"], "points": [ ["ny", "paul@influxdb.org", "follow"], ["ny", "todd@influxdb.org", "open"] ] }, { "name": "errors", "columns": ["class", "file", "user", "severity"], "points": [ ["DivideByZero", "example.py", "someguy@influxdb.org", "fatal"] ] }] |
POST请求发送多个
series, 每个
series里的
points可以是多个,但索引要和
columns对应。上面的数据里没有包含
time列,InfluxDB会自己加上,不过也可以指定
time,比如:
| 1 2 3 4 5 6 7 8 9 10 11 | [ { "name": "response_times", "columns": ["time", "value"], "points": [ [1382819388, 234.3], [1382819389, 120.1], [1382819380, 340.9] ] } ] |
time series database
在InfluxDB里还有个
sequence_number字段是数据库维护的,类似于mysql的 主键概念
InfluxDB 增删更查都是用http api来完成,甚至支持使用正则表达式删除数据,还有计划任务。
比如:
发送
POST请求到
/db/:name/scheduled_deletes,
body如下,
| 12345 | { "regex": "stats\..*", "olderThan": "14d", "runAt": 3} |
查询语言
InfluxDB 提供了类似sql的查询语言看起来是这样的:| 1 2 3 4 5 6 7 8 9 10 11 12 13 14 15 16 | select * from events where state == 'NY'; select * from log_lines where line =~ /error/i; select * from events where customer_id == 23 and type == 'click'; select * from response_times where value > 500; select * from events where !~ /.*gmail.*/; select * from nagios_checks where status != 0; select * from events where =~ /.*gmail.* or =~ /.*yahoo.*/) and state == 'ny'; delete from response_times where time > now() - 1h |
Group By,
Merging
Series
,
Joining Series, 并内置常用统计函数,比如max, min, mean 等
文档: http://influxdb.org/docs/query_language/
库
常用语言的库都有,因为api简单,也很容易自己封装。InfluxdDB作为很多监控软件的后端,这样监控数据就可以直接存储在InfluxDB
StatsD,
CollectD,
FluentD
还有其它的可视化工具支持InfluxDB, 这样就可以基于InfluxDB很方便的搭建监控平台
InfluxDB 数据可视化工具
InfluxDB 用于存储基于时间的数据,比如监控数据,因为InfluxDB本身提供了Http API,所以可以使用InfluxDB很方便的搭建了个监控数据存储中心。对于InfluxDB中的数据展示,官方admin有非常简单的图表, 看起来是这样的
除了自己写程序展示数据还可以选择:
tasseo https://github.com/obfuscurity/tasseo/
grafana https://github.com/torkelo/grafana
tasseo
tasseo,为Graphite写的Live dashboard,现在也支持InfluxDB,tasseo 比较简单, 可以配置的选项很少。
Grafana
Grafana是一个纯粹的html/js应用,访问InfluxDB时不会有跨域访问的限制。只要配置好数据源为InfluxDB之后就可以,剩下的工作就是配置图表。Grafana 功能非常强大。使用ElasticsSearch保存DashBoard的定义文件,也可以Export出JSON文件(Save ->Advanced->Export Schema),然后上传回它的/app/dashboards目录。配置数据源:
| 1 2 3 4 5 6 7 8 9 | datasources: { influx: { default: true, type: 'influxdb', url: 'http://<your_influx_db_server>:8086/db/<db_name>', username: 'test', password: 'test', } }, |

相关文章推荐
- 分布式时序数据库InfluxDB
- 分布式监控(二)–时序数据库influxdb安装
- 分布式时序数据库InfluxDB
- 分布式时序数据库InfluxDB
- 分布式时序数据库InfluxDB
- Influxdb 时序数据库 centos 安装
- 饿了么轻量级分布式时序数据库的设计与探索 - 分布式
- InfluxDB 开源分布式时序、事件和指标数据库
- 互联网级监控系统必备-时序数据库之Influxdb集群及踩过的坑
- 时序数据库InfluxDB
- InfluxDB 开源分布式时序、事件和指标数据库
- 饿了么轻量级分布式时序数据库的设计与探索 - 分布式
- InfluxDB 开源分布式时序、事件和指标数据库
- 互联网级监控系统必备-时序数据库之Influxdb技术
- 互联网级监控系统必备-时序数据库之Influxdb集群及踩过的坑
- influxdb时序数据库,查询,批量插入实例
- 深入浅出时序数据库之预处理篇——批处理和流处理,用户可定制,但目前流行influxdb没有做
- Influxdb时序数据库 数据保存策略
- 互联网级监控系统必备-时序数据库之Influxdb技术
- 互联网级监控系统必备-时序数据库之Influxdb技术