Matplotlib常用画图代码
2016-05-21 02:26
666 查看
每写一篇文章都要画若干图片,然而每刚好间隔几个月,都忘了怎么画,重新搭框架,很头疼。索性把用过的都贴在这里吧,以后直接来刷自己博客流量好了。
下面代码解决了matplotlib图像中添加中文文字的问题。默认matplotlit是不支持中文自体的,当插入中文自体的时候,都会显示方框框。解决办法就是在自己系统中找到中文自体,方法详见下面代码中第一句。

多个子图,每个子图有独立标题,共用一个坐标轴。且添加了公共x label和y label。同样是解决了中文问题。

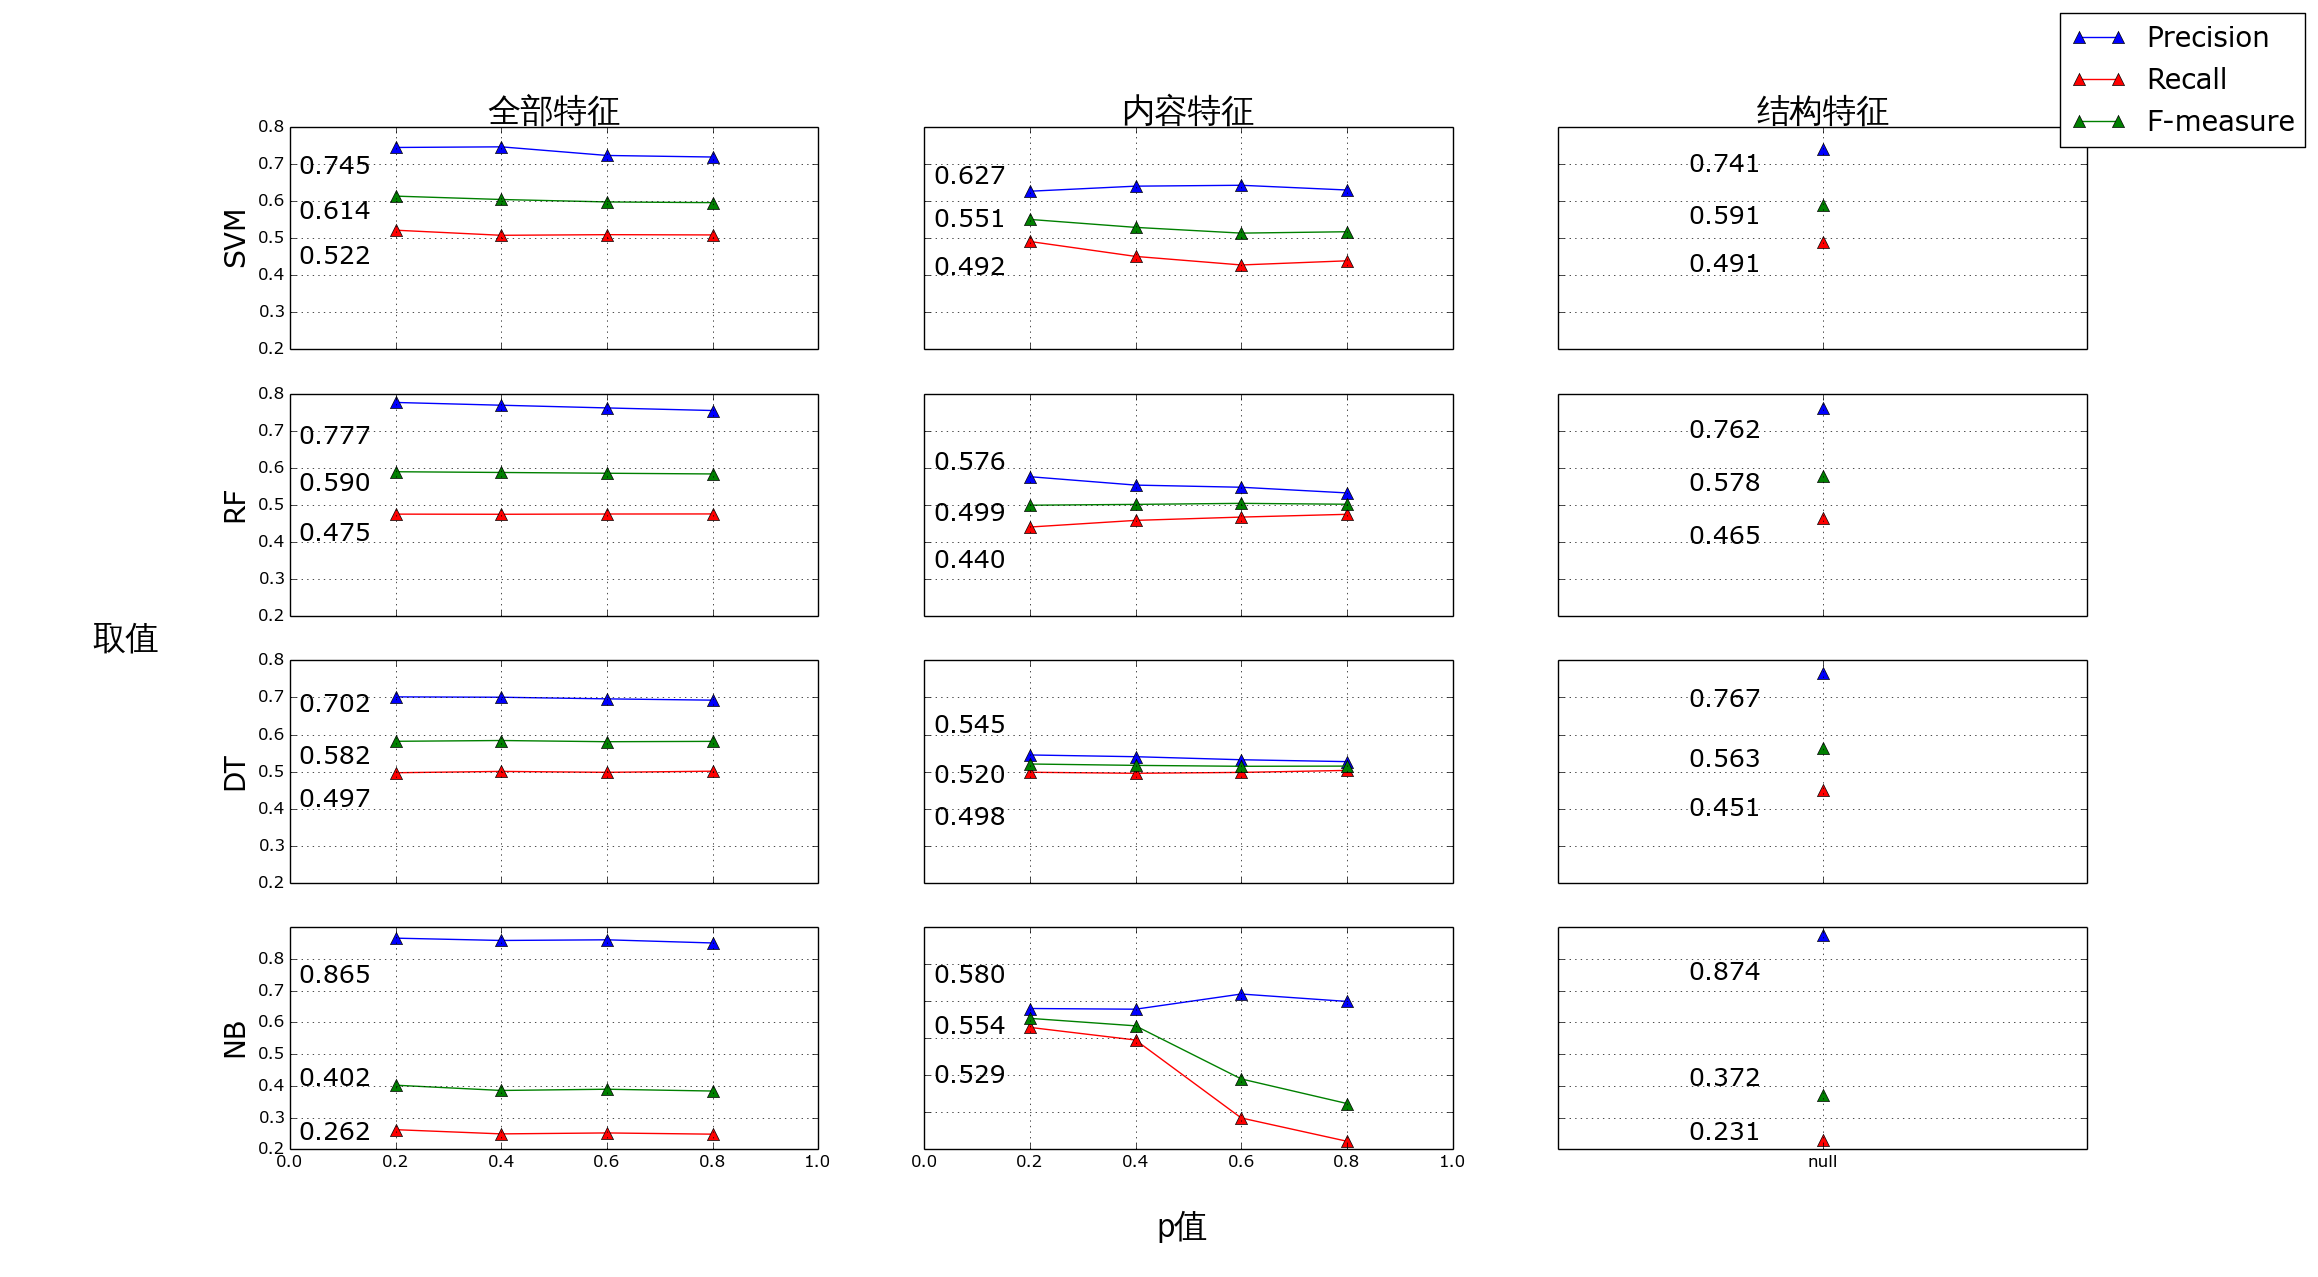
多个子图。每个子图有独立的caption,行和列都有独立的caption。添加了公共legend,公共x_label和y_label。独立的x和y刻度。自由度很大的图。
上图中的一列子图。不多说。

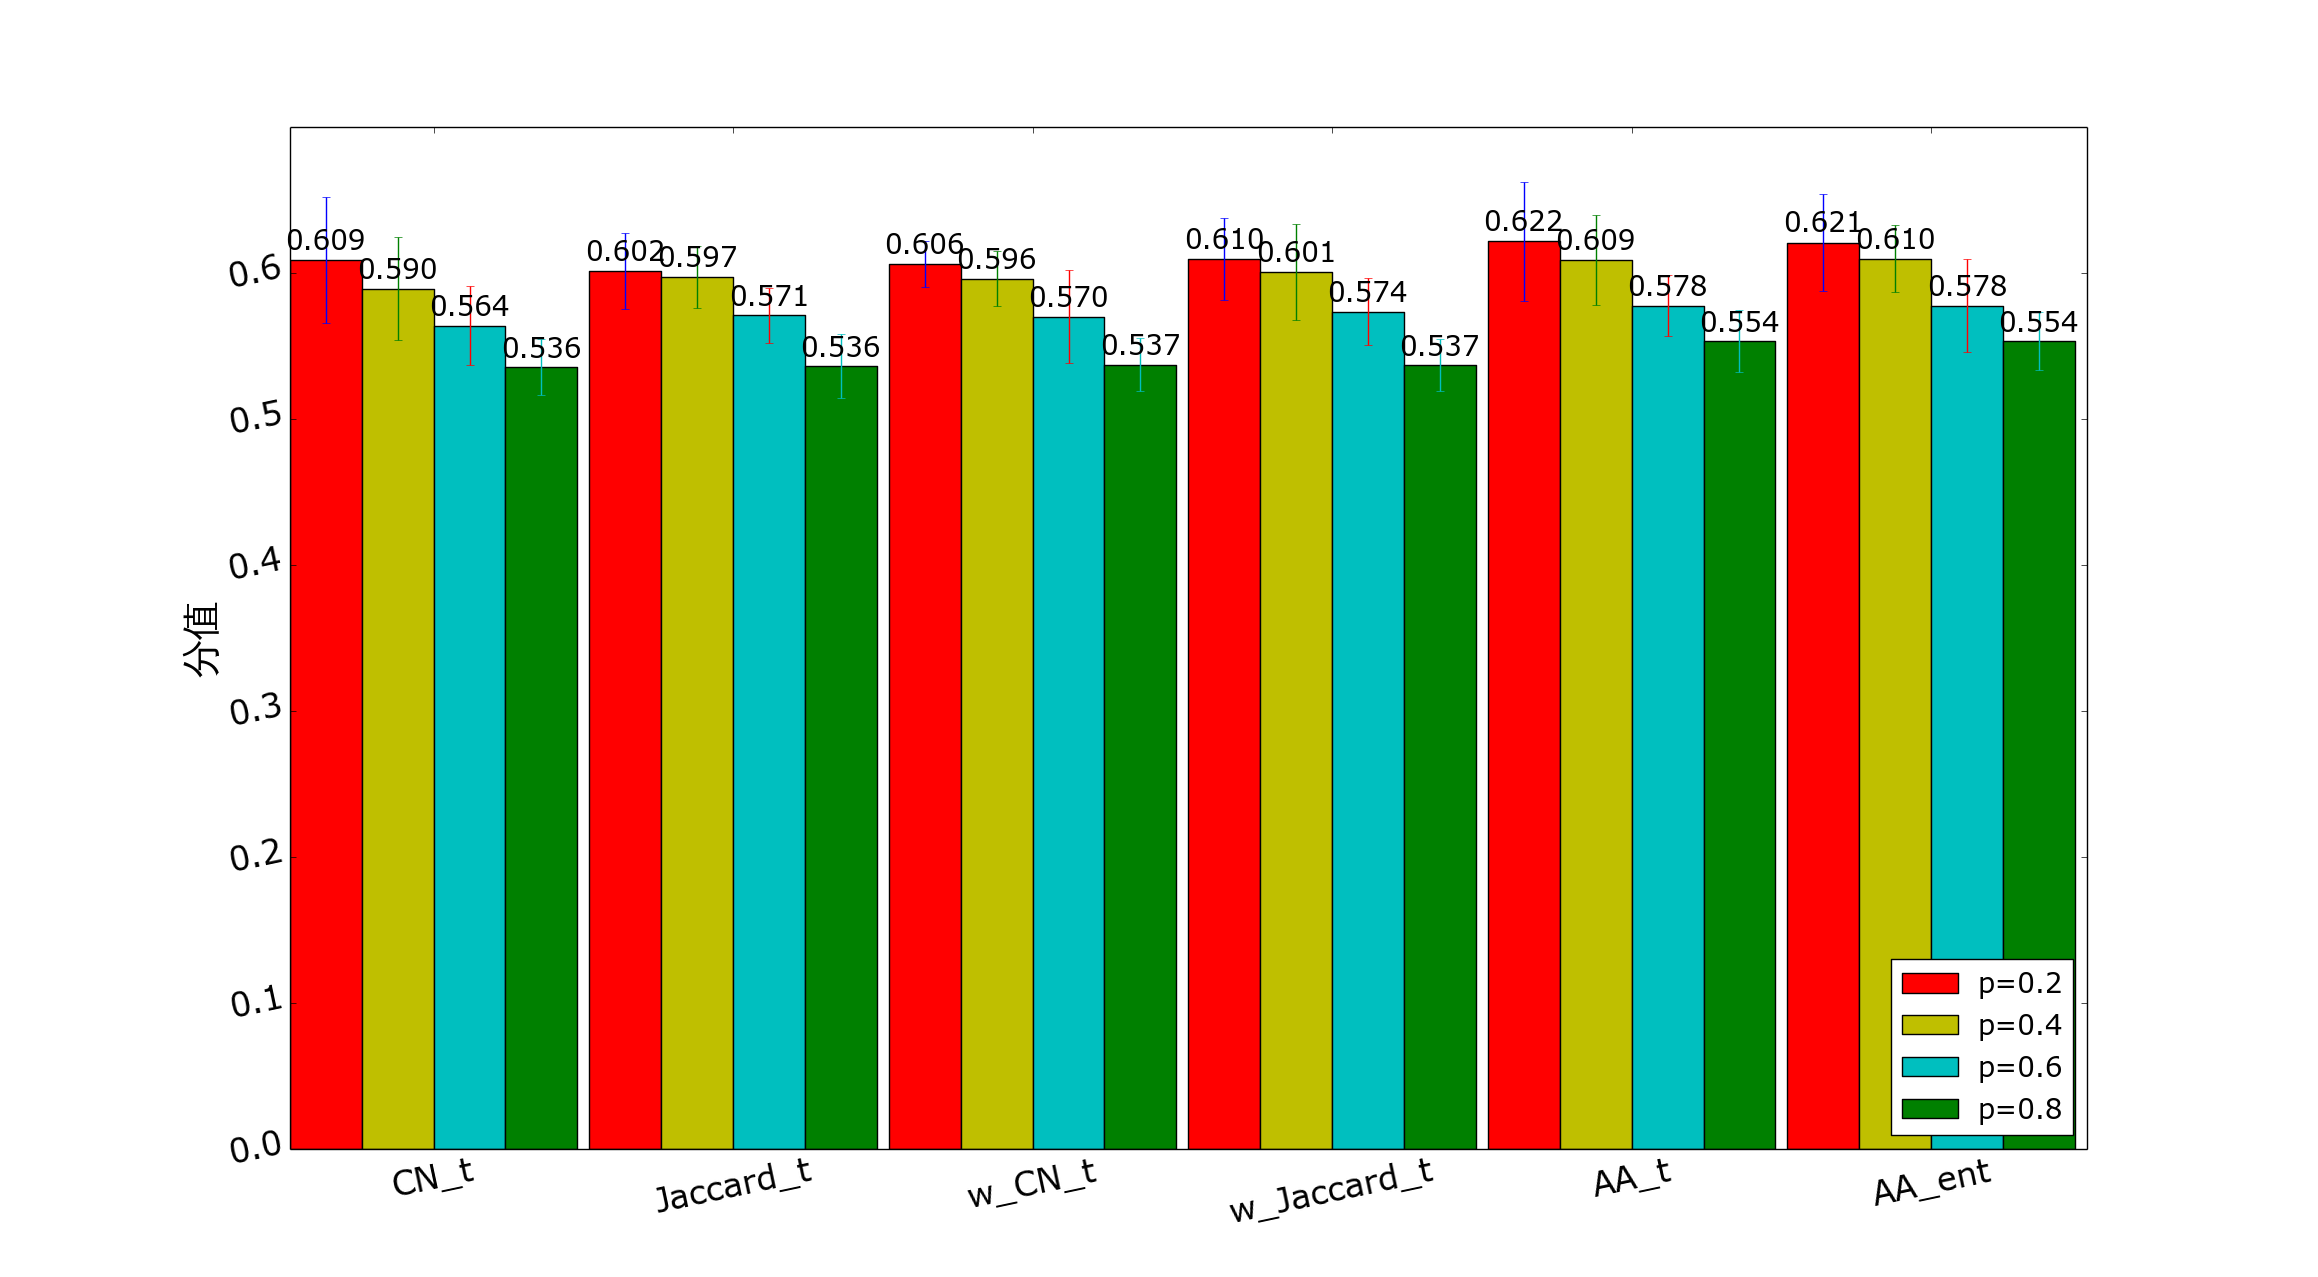
分组bar chart,不多说。
下面代码解决了matplotlib图像中添加中文文字的问题。默认matplotlit是不支持中文自体的,当插入中文自体的时候,都会显示方框框。解决办法就是在自己系统中找到中文自体,方法详见下面代码中第一句。
#!/usr/bin/python
# -*- coding: utf-8 -*-
import numpy as np
import matplotlib.pyplot as plt
import matplotlib

if __name__ == '__main__':
zhfont1 = matplotlib.font_manager.FontProperties(fname='/usr/share/fonts/truetype/wqy/wqy-zenhei.ttc') #解决中文字体支持问题,如果你的字体库没有上述字体,就进入目录自己找一个吧。
N = 11
menMeans = (0.60727, 0.58835, 0.59723, 0.59425, 0.59455, 0.60455, 0.60106, 0.59473, 0.70596, 0.62080, 0.50081)
menStd = (0.02, 0.03, 0.023, 0.031, 0.034, 0.035, 0.017, 0.033, 0.032, 0.043, 0.026)

ind = np.arange(N)  # the x locations for the groups
width = 0.55       # the width of the bars

fig, ax = plt.subplots()
rects1 = ax.bar(ind, menMeans, width, color='c', yerr=menStd)
plt.ylabel(u'分值', fontproperties=zhfont1, fontsize = 14)
ax.set_xticks(ind + 0.5 * width)
ax.set_xticklabels(('CN_n', 'LHN', 'Salton', 'Sonrensen', 'Jaccard_n', 'AA_n', 'HPI', 'HDI', 'PA', 'CorrCoef', 'Dif_H'))
labels = ax.get_xticklabels()
plt.setp(labels, rotation = 25, fontsize = 10)

def autolabel(rects):
for rect in rects:
height = rect.get_height()
ax.text(rect.get_x() + rect.get_width()/2., 1.005*height,'%.3f' % (height),ha='center', va='bottom')
autolabel(rects1)
plt.show()
多个子图,每个子图有独立标题,共用一个坐标轴。且添加了公共x label和y label。同样是解决了中文问题。
#!/usr/bin/python
# -*- coding: utf-8 -*-

import matplotlib.pyplot as plt
import numpy as np
import matplotlib

if __name__ == '__main__':
zhfont1 = matplotlib.font_manager.FontProperties(fname='/usr/share/fonts/truetype/wqy/wqy-zenhei.ttc')
# Simple data to display in various forms
#x = np.linspace(0, 2 * np.pi, 400)
#y = np.sin(x ** 2)

plt.close('all')

# Four axes, returned as a 2-d array
f, axarr = plt.subplots(2, 3)
f.text(0.04, 0.5, u'分值', va='center', rotation='vertical', fontproperties=zhfont1, fontsize = 14)
f.text(0.5, 0.04, u'p值', va='center', fontproperties=zhfont1, fontsize = 14)
x = [0.2, 0.4, 0.6, 0.8]

yticks = np.arange(0.525, 0.65, 0.025)
xticks = np.arange(0.0, 1.2, 0.2)
y = [0.60913, 0.58955, 0.56415, 0.53567]
axarr[0, 0].plot(x, y, '-*')
axarr[0, 0].set_title('CN_t')
axarr[0, 0].grid(True)
axarr[0, 0].set_yticks(yticks)
axarr[0, 0].set_xticks(xticks)

y = [0.60170, 0.59740, 0.57109, 0.53624]
axarr[0, 1].plot(x, y, '-*')
axarr[0, 1].set_title('Jaccard_t')
axarr[0, 1].grid(True)
axarr[0, 1].set_yticks(yticks)
axarr[0, 1].set_xticks(xticks)

y = [0.60632, 0.59631, 0.57023, 0.53746]
axarr[0, 2].plot(x, y, '-*')
axarr[0, 2].set_title('w_CN_t')
axarr[0, 2].grid(True)
axarr[0, 2].set_yticks(yticks)
axarr[0, 2].set_xticks(xticks)

y = [0.60970, 0.60095, 0.57358, 0.53715]
axarr[1, 0].plot(x, y, '-*')
axarr[1, 0].set_title('w_Jaccard_t')
axarr[1, 0].grid(True)
axarr[1, 0].set_yticks(yticks)
axarr[1, 0].set_xticks(xticks)

y = [0.62175, 0.60915, 0.57775, 0.55355]
axarr[1, 1].plot(x, y, '-*')
axarr[1, 1].set_title('AA_t')
axarr[1, 1].grid(True)
axarr[1, 1].set_yticks(yticks)
axarr[1, 1].set_xticks(xticks)

y = [0.62105, 0.60985, 0.57775, 0.55355]
axarr[1, 2].plot(x, y, '-*')
axarr[1, 2].set_title('AA_ent')
axarr[1, 2].grid(True)
axarr[1, 2].set_yticks(yticks)
axarr[1, 2].set_xticks(xticks)
# Fine-tune figure; hide x ticks for top plots and y ticks for right plots
plt.setp([a.get_xticklabels() for a in axarr[0, :]], visible=False)
plt.setp([a.get_yticklabels() for a in axarr[:, 1]], visible=False)
plt.setp([a.get_yticklabels() for a in axarr[:, 2]], visible=False)

#plt.ylabel(u'分值', fontproperties=zhfont1, fontsize = 14)
#plt.title(u'间接内容特征的AUC得分', fontproperties=zhfont1, fontsize = 14)

plt.show()
多个子图。每个子图有独立的caption,行和列都有独立的caption。添加了公共legend,公共x_label和y_label。独立的x和y刻度。自由度很大的图。
#!/usr/bin/python
# -^- coding: utf-8 -^-

import matplotlib.pyplot as plt
import numpy as np
import matplotlib

if __name__ == '__main__':
zhfont1 = matplotlib.font_manager.FontProperties(fname='/usr/share/fonts/truetype/wqy/wqy-zenhei.ttc')
# Simple data to display in various forms
#x = np.linspace(0, 2 ^ np.pi, 400)
#y = np.sin(x ^^ 2)

plt.close('all')

# Four axes, returned as a 2-d array
f, axarr = plt.subplots(4, 3)
f.text(0.04, 0.5, u'取值', va='center', fontproperties=zhfont1, fontsize = 24)
f.text(0.5, 0.04, u'p值', va='center', fontproperties=zhfont1, fontsize = 24)
x = [0.2, 0.4, 0.6, 0.8]

yticks = np.arange(0.20, 0.80, 0.10)
xticks = np.arange(0.0, 1.2, 0.2)
y_p = [0.7454, 0.7471, 0.7238, 0.7196]
y_r = [0.5220, 0.5082, 0.5099, 0.5092]
y_f = [0.6140, 0.6049, 0.5983, 0.5964]
axarr[0, 0].text(0.02, 0.4320, u'0.522', fontsize = 18)
axarr[0, 0].text(0.02, 0.5540, u'0.614', fontsize = 18)
axarr[0, 0].text(0.02, 0.6754, u'0.745', fontsize = 18)
axarr[0, 0].plot(x, y_p, '-^', color='b', markersize=8)
axarr[0, 0].plot(x, y_r, '-^', color='r', markersize=8)
axarr[0, 0].plot(x, y_f, '-^', color='g', markersize=8)
axarr[0, 0].set_title(u'全部特征', fontproperties=zhfont1, fontsize = 24)
axarr[0, 0].grid(True)
axarr[0, 0].set_yticks(yticks)
axarr[0, 0].set_xticks(xticks)
axarr[0, 0].set_ylabel('SVM', fontsize = 20)

#yticks = np.arange(0.40, 0.70, 0.05)
y_p = [0.6272, 0.6409, 0.6433, 0.6305]
y_r = [0.4915, 0.4512, 0.4281, 0.4393]
y_f = [0.5511, 0.5296, 0.5141, 0.5178]
axarr[0, 1].text(0.02, 0.6472, u'0.627', fontsize = 18)
axarr[0, 1].text(0.02, 0.4015, u'0.492', fontsize = 18)
axarr[0, 1].text(0.02, 0.5311, u'0.551', fontsize = 18)
axarr[0, 1].plot(x, y_p, '-^', color='b', markersize=8)
axarr[0, 1].plot(x, y_r, '-^', color='r', markersize=8)
axarr[0, 1].plot(x, y_f, '-^', color='g', markersize=8)
axarr[0, 1].set_title(u'内容特征', fontproperties=zhfont1, fontsize = 24)
axarr[0, 1].grid(True)
axarr[0, 1].set_yticks(yticks)
axarr[0, 1].set_xticks(xticks)

x_null = 0
x_null_stick = ['null']
y_p = [0.7408]
y_r = [0.4911]
y_f = [0.5906]
axarr[0, 2].text(-0.03, 0.6808, u'0.741', fontsize = 18)
axarr[0, 2].text(-0.03, 0.4111, u'0.491', fontsize = 18)
axarr[0, 2].text(-0.03, 0.5406, u'0.591', fontsize = 18)
axarr[0, 2].plot(x_null, y_p, '-^', color='b', markersize=8)
axarr[0, 2].plot(x_null, y_r, '-^', color='r', markersize=8)
axarr[0, 2].plot(x_null, y_f, '-^', color='g', markersize=8)
axarr[0, 2].set_title(u'结构特征', fontproperties=zhfont1, fontsize = 24)
axarr[0, 2].grid(True)
axarr[0, 2].set_yticks(yticks)
axarr[0, 2].set_xticks([0])
axarr[0, 2].set_xticklabels(x_null_stick)

#yticks = np.arange(0.45, 0.80, 0.05)
y_p = [0.7768, 0.7693, 0.7620, 0.7550]
y_r = [0.4752, 0.4748, 0.4755, 0.4757]
y_f = [0.5897, 0.5877, 0.5856, 0.5837]
axarr[1, 0].text(0.02, 0.6668, u'0.777', fontsize = 18)
axarr[1, 0].text(0.02, 0.4052, u'0.475', fontsize = 18)
axarr[1, 0].text(0.02, 0.5397, u'0.590', fontsize = 18)
axarr[1, 0].plot(x, y_p, '-^', color='b', markersize=8)
axarr[1, 0].plot(x, y_r, '-^', color='r', markersize=8)
axarr[1, 0].plot(x, y_f, '-^', color='g', markersize=8)
axarr[1, 0].grid(True)
axarr[1, 0].set_yticks(yticks)
axarr[1, 0].set_xticks(xticks)
axarr[1, 0].set_ylabel('RF', fontsize = 20)

#yticks = np.arange(0.40, 0.65, 0.05)
y_p = [0.5763, 0.5536, 0.5478, 0.5325]
y_r = [0.4403, 0.4583, 0.4672, 0.4747]
y_f = [0.4993, 0.5015, 0.5043, 0.5019]
axarr[1, 1].text(0.02, 0.5963, u'0.576', fontsize = 18)
axarr[1, 1].text(0.02, 0.3303, u'0.440', fontsize = 18)
axarr[1, 1].text(0.02, 0.4593, u'0.499', fontsize = 18)
axarr[1, 1].plot(x, y_p, '-^', color='b', markersize=8)
axarr[1, 1].plot(x, y_r, '-^', color='r', markersize=8)
axarr[1, 1].plot(x, y_f, '-^', color='g', markersize=8)
axarr[1, 1].grid(True)
axarr[1, 1].set_yticks(yticks)
axarr[1, 1].set_xticks(xticks)

x_null = 0.0
y_p = [0.7622]
y_r = [0.4653]
y_f = [0.5779]
axarr[1, 2].text(-0.03, 0.6822, u'0.762', fontsize = 18)
axarr[1, 2].text(-0.03, 0.3953, u'0.465', fontsize = 18)
axarr[1, 2].text(-0.03, 0.5379, u'0.578', fontsize = 18)
axarr[1, 2].plot(x_null, y_p, '-^', color='b', markersize=8)
axarr[1, 2].plot(x_null, y_r, '-^', color='r', markersize=8)
axarr[1, 2].plot(x_null, y_f, '-^', color='g', markersize=8)
axarr[1, 2].grid(True)
axarr[1, 2].set_yticks(yticks)
axarr[1, 2].set_xticks([0])
axarr[1, 2].set_xticklabels(x_null_stick)

#yticks = np.arange(0.45, 0.80, 0.05)
y_p = [0.7017, 0.7007, 0.6963, 0.6928]
y_r = [0.4968, 0.5004, 0.4979, 0.5010]
y_f = [0.5817, 0.5838, 0.5806, 0.5815]
axarr[2, 0].text(0.02, 0.6617, u'0.702', fontsize = 18)
axarr[2, 0].text(0.02, 0.4068, u'0.497', fontsize = 18)
axarr[2, 0].text(0.02, 0.5217, u'0.582', fontsize = 18)
axarr[2, 0].plot(x, y_p, '-^', color='b', markersize=8)
axarr[2, 0].plot(x, y_r, '-^', color='r', markersize=8)
axarr[2, 0].plot(x, y_f, '-^', color='g', markersize=8)
axarr[2, 0].grid(True)
axarr[2, 0].set_yticks(yticks)
axarr[2, 0].set_xticks(xticks)
axarr[2, 0].set_ylabel('DT', fontsize = 20)

#yticks = np.arange(0.48, 0.56, 0.01)
y_p = [0.5448, 0.5401, 0.5319, 0.5268]
y_r = [0.4981, 0.4953, 0.4977, 0.5031]
y_f = [0.5204, 0.5167, 0.5142, 0.5147]
axarr[2, 1].text(0.02, 0.6048, u'0.545', fontsize = 18)
axarr[2, 1].text(0.02, 0.3581, u'0.498', fontsize = 18)
axarr[2, 1].text(0.02, 0.4704, u'0.520', fontsize = 18)
axarr[2, 1].plot(x, y_p, '-^', color='b', markersize=8)
axarr[2, 1].plot(x, y_r, '-^', color='r', markersize=8)
axarr[2, 1].plot(x, y_f, '-^', color='g', markersize=8)
axarr[2, 1].grid(True)
axarr[2, 1].set_yticks(yticks)
axarr[2, 1].set_xticks(xticks)

y_p = [0.7668]
y_r = [0.4509]
y_f = [0.5632]
axarr[2, 2].text(-0.03, 0.6768, u'0.767', fontsize = 18)
axarr[2, 2].text(-0.03, 0.3809, u'0.451', fontsize = 18)
axarr[2, 2].text(-0.03, 0.5132, u'0.563', fontsize = 18)
axarr[2, 2].plot(x_null, y_p, '-^', color='b', markersize=8)
axarr[2, 2].plot(x_null, y_r, '-^', color='r', markersize=8)
axarr[2, 2].plot(x_null, y_f, '-^', color='g', markersize=8)
axarr[2, 2].grid(True)
axarr[2, 2].set_yticks(yticks)
axarr[2, 2].set_xticks([0])
axarr[2, 2].set_xticklabels(x_null_stick)

y_p = [0.8651, 0.8578, 0.8599, 0.8499]
y_r = [0.2617, 0.2484, 0.2514, 0.2475]
y_f = [0.4018, 0.3852, 0.3891, 0.3834]
axarr[3, 0].text(0.02, 0.7251, u'0.865', fontsize = 18)
axarr[3, 0].text(0.02, 0.2317, u'0.262', fontsize = 18)
axarr[3, 0].text(0.02, 0.4018, u'0.402', fontsize = 18)
axarr[3, 0].plot(x, y_p, '-^', color='b', markersize=8)
axarr[3, 0].plot(x, y_r, '-^', color='r', markersize=8)
axarr[3, 0].plot(x, y_f, '-^', color='g', markersize=8)
axarr[3, 0].grid(True)
axarr[3, 0].set_yticks(yticks)
axarr[3, 0].set_xticks(xticks)
axarr[3, 0].set_ylabel('NB', fontsize = 20)

y_p = [0.5801, 0.5782, 0.6192, 0.5992]
y_r = [0.5291, 0.4950, 0.2845, 0.2216]
y_f = [0.5535, 0.5333, 0.3899, 0.3235]
axarr[3, 1].text(0.02, 0.6501, u'0.580', fontsize = 18)
axarr[3, 1].text(0.02, 0.3791, u'0.529', fontsize = 18)
axarr[3, 1].text(0.02, 0.5135, u'0.554', fontsize = 18)
axarr[3, 1].plot(x, y_p, '-^', color='b', markersize=8)
axarr[3, 1].plot(x, y_r, '-^', color='r', markersize=8)
axarr[3, 1].plot(x, y_f, '-^', color='g', markersize=8)
axarr[3, 1].grid(True)
axarr[3, 1].set_yticks(yticks)
axarr[3, 1].set_xticks(xticks)

y_p = [0.8741]
y_r = [0.2306]
y_f = [0.3718]
axarr[3, 2].text(-0.03, 0.7341, u'0.874', fontsize = 18)
axarr[3, 2].text(-0.03, 0.2306, u'0.231', fontsize = 18)
axarr[3, 2].text(-0.03, 0.4018, u'0.372', fontsize = 18)
y1, y2, y3 = axarr[3, 2].plot(x_null, y_p, 'b-^', x_null, y_r, 'r-^', x_null, y_f, 'g-^', markersize=8)
#y2 = axarr[3, 2].plot(x_null, y_r, '-^', color='r', markersize=8)
#y3 = axarr[3, 2].plot(x_null, y_f, '-^', color='g', markersize=8)
axarr[3, 2].grid(True)
axarr[3, 2].set_xticks([0])
axarr[3, 2].set_yticks(yticks)
axarr[3, 2].set_xticklabels(x_null_stick)
# Fine-tune figure; hide x ticks for top plots and y ticks for right plots
plt.setp([a.get_xticklabels() for a in axarr[0, :]], visible=False)
plt.setp([a.get_xticklabels() for a in axarr[1, :]], visible=False)
plt.setp([a.get_xticklabels() for a in axarr[2, :]], visible=False)
plt.setp([a.get_yticklabels() for a in axarr[:, 1]], visible=False)
plt.setp([a.get_yticklabels() for a in axarr[:, 2]], visible=False)
#plt.legend('lower right', prop={'size':18})
f.legend((y1,y2,y3), (u'Precision', u'Recall', u'F-measure'), 'upper right', prop={'size':20})
#plt.ylabel(u'分值', fontproperties=zhfont1, fontsize = 14)
#plt.title(u'间接内容特征的AUC得分', fontproperties=zhfont1, fontsize = 14)

plt.show()
上图中的一列子图。不多说。
#!/usr/bin/python
# -^- coding: utf-8 -^-

import matplotlib.pyplot as plt
import numpy as np
import matplotlib

if __name__ == '__main__':
zhfont1 = matplotlib.font_manager.FontProperties(fname='/usr/share/fonts/truetype/wqy/wqy-zenhei.ttc')
plt.close('all')
# Four axes, returned as a 2-d array
f, axarr = plt.subplots(4, 1)
f.text(0.01, 0.5, u'取值', va='center', fontproperties=zhfont1, fontsize = 24)
f.text(0.5, 0.04, u'p值', va='center', fontproperties=zhfont1, fontsize = 24)
x = [0.2, 0.4, 0.6, 0.8]

yticks = np.arange(0.20, 0.80, 0.10)
xticks = np.arange(0.0, 1.2, 0.2)
y_p = [0.7454, 0.7471, 0.7238, 0.7196]
y_r = [0.5220, 0.5082, 0.5099, 0.5092]
y_f = [0.6140, 0.6049, 0.5983, 0.5964]
axarr[0].text(0.02, 0.4320, u'0.522', fontsize = 18)
axarr[0].text(0.02, 0.5540, u'0.614', fontsize = 18)
axarr[0].text(0.02, 0.6754, u'0.745', fontsize = 18)
line1 = axarr[0].plot(x, y_p, '-^', color='b', markersize=8)
line2 = axarr[0].plot(x, y_r, '-^', color='r', markersize=8)
line3 = axarr[0].plot(x, y_f, '-^', color='g', markersize=8)
#axarr[0].set_title(u'全部特征', fontproperties=zhfont1, fontsize = 24)
axarr[0].grid(True)
axarr[0].set_yticks(yticks)
axarr[0].set_xticks(xticks)
axarr[0].set_ylabel('SVM', fontsize = 20)

#yticks = np.arange(0.45, 0.80, 0.05)
y_p = [0.7768, 0.7693, 0.7620, 0.7550]
y_r = [0.4752, 0.4748, 0.4755, 0.4757]
y_f = [0.5897, 0.5877, 0.5856, 0.5837]
axarr[1].text(0.02, 0.6668, u'0.777', fontsize = 18)
axarr[1].text(0.02, 0.4052, u'0.475', fontsize = 18)
axarr[1].text(0.02, 0.5397, u'0.590', fontsize = 18)
axarr[1].plot(x, y_p, '-^', color='b', markersize=8)
axarr[1].plot(x, y_r, '-^', color='r', markersize=8)
axarr[1].plot(x, y_f, '-^', color='g', markersize=8)
axarr[1].grid(True)
axarr[1].set_yticks(yticks)
axarr[1].set_xticks(xticks)
axarr[1].set_ylabel('RF', fontsize = 20)

#yticks = np.arange(0.45, 0.80, 0.05)
y_p = [0.7017, 0.7007, 0.6963, 0.6928]
y_r = [0.4968, 0.5004, 0.4979, 0.5010]
y_f = [0.5817, 0.5838, 0.5806, 0.5815]
axarr[2].text(0.02, 0.6617, u'0.702', fontsize = 18)
axarr[2].text(0.02, 0.4068, u'0.497', fontsize = 18)
axarr[2].text(0.02, 0.5217, u'0.582', fontsize = 18)
axarr[2].plot(x, y_p, '-^', color='b', markersize=8)
axarr[2].plot(x, y_r, '-^', color='r', markersize=8)
axarr[2].plot(x, y_f, '-^', color='g', markersize=8)
axarr[2].grid(True)
axarr[2].set_yticks(yticks)
axarr[2].set_xticks(xticks)
axarr[2].set_ylabel('DT', fontsize = 20)

y_p = [0.8651, 0.8578, 0.8599, 0.8499]
y_r = [0.2617, 0.2484, 0.2514, 0.2475]
y_f = [0.4018, 0.3852, 0.3891, 0.3834]
axarr[3].text(0.02, 0.7251, u'0.865', fontsize = 18)
axarr[3].text(0.02, 0.2317, u'0.262', fontsize = 18)
axarr[3].text(0.02, 0.4018, u'0.402', fontsize = 18)
axarr[3].plot(x, y_p, '-^', color='b', markersize=8)
axarr[3].plot(x, y_r, '-^', color='r', markersize=8)
axarr[3].plot(x, y_f, '-^', color='g', markersize=8)
axarr[3].grid(True)
axarr[3].set_yticks(yticks)
axarr[3].set_xticks(xticks)
axarr[3].set_ylabel('NB', fontsize = 20)

# Fine-tune figure; hide x ticks for top plots and y ticks for right plots
#plt.setp([a.get_xticklabels() for a in axarr[0, :]], visible=False)
plt.setp([axarr[0].get_xticklabels()], visible=False)
plt.setp([axarr[1].get_xticklabels()], visible=False)
plt.setp([axarr[2].get_xticklabels()], visible=False)

#   plt.setp([a.get_yticklabels() for a in axarr[:, 1]], visible=False)
#   plt.setp([a.get_yticklabels() for a in axarr[:, 2]], visible=False)
#plt.legend('lower right', prop={'size':18})
#x_null = 0
#y1, y2, y3 = axarr[0].plot(x_null, y_p, 'b-^', x_null, y_r, 'r-^', x_null, y_f, 'g-^', markersize=8)
#f.legend((y1,y2,y3), (u'Precision', u'Recall', u'F-measure'), 'upper right', prop={'size':20})

#f.legend([line1, line2, line3], ['Line Up', 'Line Down', 'hehe'])
#plt.ylabel(u'分值', fontproperties=zhfont1, fontsize = 14)
#plt.title(u'间接内容特征的AUC得分', fontproperties=zhfont1, fontsize = 14)

plt.show()
分组bar chart,不多说。
#!/usr/bin/python
# -*- coding: utf-8 -*-

import numpy as np
import matplotlib.pyplot as plt
import matplotlib

def autolabel(rects):
# attach some text labels
for rect in rects:
height = rect.get_height()
ax.text(rect.get_x() + rect.get_width()/2., 1.005*height,'%.3f' % height,ha='center', va='bottom', fontsize=20)

if __name__ == '__main__':
zhfont1 = matplotlib.font_manager.FontProperties(fname='/usr/share/fonts/truetype/wqy/wqy-zenhei.ttc')
N = 6
Means = (0.60913, 0.60170, 0.60632, 0.60970, 0.62175, 0.62105)
Std = (0.043, 0.026, 0.016, 0.028, 0.041, 0.033)

ind = np.arange(N)  # the x locations for the groups
width = 0.24       # the width of the bars

fig, ax = plt.subplots()
plt.ylabel(u'分值', fontproperties=zhfont1, fontsize = 28)
#plt.title(u'间接内容特征的AUC得分', fontproperties=zhfont1, fontsize = 28)

rects1 = ax.bar(ind, Means, width, color='r', yerr=Std)

Means = (0.58955, 0.59740, 0.59631, 0.60095, 0.60915, 0.60985)
Std = (0.035, 0.021, 0.019, 0.033, 0.031, 0.023)
rects2 = ax.bar(ind + width, Means, width, color='y', yerr=Std)

Means = (0.56415, 0.57109, 0.57023, 0.57358, 0.57775, 0.57775)
Std = (0.027, 0.019, 0.032, 0.023, 0.021, 0.032)
rects3 = ax.bar(ind + 2*width, Means, width, color='c', yerr=Std)

Means = (0.53567, 0.53624, 0.53746, 0.53715, 0.55355, 0.55355)
Std = (0.019, 0.022, 0.018, 0.018, 0.021, 0.020)
rects4 = ax.bar(ind + 3*width, Means, width, color='g', yerr=Std)

# add some text for labels, title and axes ticks
ax.set_xticks(ind + 2 * width)
ax.set_xticklabels(('CN_t', 'Jaccard_t', 'w_CN_t', 'w_Jaccard_t', 'AA_t', 'AA_ent'))
ax.set_yticks(np.arange(0.0, 0.7, 0.1))
#ax.set_xticklabels(('CN_t', 'Jaccard_t', 'w_CN_t', 'w_Jaccard_t', 'AA_t', 'AA_ent'))
labelsx = ax.get_xticklabels()
plt.setp(labelsx, rotation = 12, fontsize = 24)
labelsy = ax.get_yticklabels()
plt.setp(labelsy, rotation = 12, fontsize = 24)

ax.legend((rects1[0], rects2[0], rects3[0], rects4[0]), ('p=0.2', 'p=0.4', 'p=0.6', 'p=0.8'),loc=4, fontsize=20)

autolabel(rects1)
autolabel(rects2)
autolabel(rects3)
autolabel(rects4)

plt.show()

相关文章推荐
- Java的反射机制
- c语言中的0
- 第六节,初识python和字符编码
- C++学习基础篇 —— 引用(&)的用法和应用
- IntelliJ使用指南—— 导入Eclipse的Web项目
- go 学习笔记 - sublime text 环境配置
- C语言第十七篇:size_t 数据类型
- c++实验6——数组操作
- [Ruby笔记]8. Ruby Rakefile rake 删除文件 确认
- C++作业6
- [C++]Json 学习笔记
- php get set方法深入理解
- spring源码剖析(八)spring整合mybatis原理
- ubuntu 安装go语言开发环境
- 不使用storyboard(或xib),代码创建的helloworld程序
- QT Demo
- java学习、java教程、java编程:怎样才算是编程高手?
- java中HashMap详解
- Spring+Hibernate多数据源配置
- php编码规范