python数据分析3:双色球 单个红和蓝球哪个比例高
2016-05-18 19:14
781 查看
统计单个红球和蓝球,哪个组合最多,显示前19组数据
结果如下:
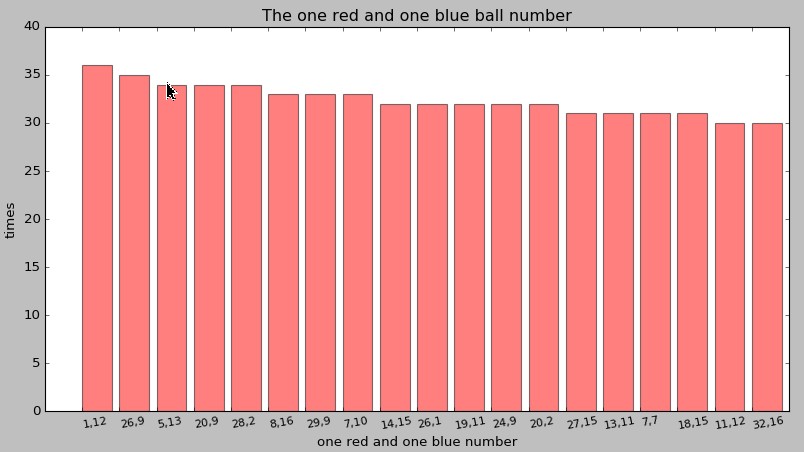
可以看出红球1和蓝球12出现过的次数最多,其次是红球26和蓝球9
参考:
import matplotlib.pyplot as plt
import numpy as np
plt.rc('font', family='SimHei', size=13)
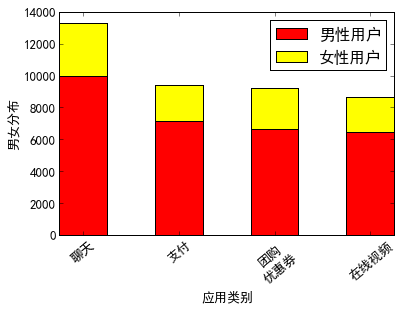
num = np.array([13325, 9403, 9227, 8651])
ratio = np.array([0.75, 0.76, 0.72, 0.75])
men = num * ratio
women = num * (1-ratio)
x = ['聊天','支付','团购\n优惠券','在线视频']
width = 0.5
idx = np.arange(len(x))
plt.bar(idx, men, width, color='red', label='男性用户')
plt.bar(idx, women, width, bottom=men, color='yellow', label='女性用户')
plt.xlabel('应用类别')
plt.ylabel('男女分布')
plt.xticks(idx+width/2, x, rotation=40)
plt.legend()
#!/usr/bin/python
# -*- coding:UTF-8 -*-
import pandas as pd
import numpy as np
import matplotlib.pyplot as plt
import operator

df = pd.read_table('newdata.txt',header=None,sep=',')

tdate = sorted(df.loc[:,0])
# print tdate
h1 = df.loc[:,1:7:6].values    #取第一列红球和蓝球
# print h1
h2 = df.loc[:,2:7:5].values    #取第二列红球和蓝球
h3 = df.loc[:,3:7:4].values
h4 = df.loc[:,4:7:3].values
h5 = df.loc[:,5:7:2].values
h6 = df.loc[:,6:7:1].values
# tblue = df.loc[:,7]

#将上方切分的所有数据组合到一起
data = np.append(h1, h2, axis = 0)
data = np.append(data, h3, axis = 0)
data = np.append(data, h4, axis = 0)
data = np.append(data, h5, axis = 0)
data = np.append(data, h6, axis = 0)
# print data

data1 = pd.DataFrame(data)
# print data1
#写入到一个文件中
data1.to_csv('hldata.csv',index=None,header=None)

#读取文件,将组合进行统计并从大到小排序
f = open("hldata.csv")
count_dict = {}
for line in f.readlines():
line = line.strip()
count = count_dict.setdefault(line, 0)
count += 1
count_dict[line] = count
sorted_count_dict = sorted(count_dict.iteritems(), key=operator.itemgetter(1), reverse=True)
# for item in sorted_count_dict:
#     print "%s,%d" % (item[0], item[1])

# print sorted_count_dict

fenzu = pd.DataFrame(sorted_count_dict).set_index([0])
#print fenzu

#分别从第一列和第二列取前19个数据放到x y中
x = list(fenzu.index[:19])
y = list(fenzu.values[:19])
print x
print y

#将x对应数值,不然画图报错
s = pd.Series(range(1,len(x)+1), index=x)

#设置画图属性
plt.figure(figsize=(12,6),dpi=80)
plt.legend(loc='best')

# plt.plot(fenzu,color='red')
plt.bar(s,y,alpha=.5, color='r',width=0.8)
plt.title('The one red and one blue ball number')
plt.xlabel('one red and one blue number')
plt.ylabel('times')

#可以在图中放置标签字符
# for i in  range(0,19):
#     plt.text(int(i+1.4),25,x[i],color='b',size=10)
# plt.text(1.4,20,x[0],color='g',ha='center')

#将['1,12', '26,9', '5,13']这样的字符放到图中
plt.xticks(s,x, rotation=10,size=10,ha='left')
plt.show()
结果如下:
可以看出红球1和蓝球12出现过的次数最多,其次是红球26和蓝球9
参考:
import matplotlib.pyplot as plt
import numpy as np
plt.rc('font', family='SimHei', size=13)
num = np.array([13325, 9403, 9227, 8651])
ratio = np.array([0.75, 0.76, 0.72, 0.75])
men = num * ratio
women = num * (1-ratio)
x = ['聊天','支付','团购\n优惠券','在线视频']
width = 0.5
idx = np.arange(len(x))
plt.bar(idx, men, width, color='red', label='男性用户')
plt.bar(idx, women, width, bottom=men, color='yellow', label='女性用户')
plt.xlabel('应用类别')
plt.ylabel('男女分布')
plt.xticks(idx+width/2, x, rotation=40)
plt.legend()

相关文章推荐
- 曲奇饼问题
- Python笔记之入门(高级篇)
- Python之编码规范
- 6.python学习笔记:切分大型文件
- Python字符串、列表、字典、元组互转
- Python之开发环境的搭建
- Python之简介
- selenium+python笔记2
- python计算时间差的方法
- Python Tricks(七)—— 使用 list 仿真先入先出的队列(FIFOQueue)
- python爬虫爬取百度贴吧的信息
- Python中list,tuple,dict用法
- Python 进阶 —— 魔法函数
- python 正则表达式(regular)
- Python处理Windows事件日志(json)
- ipython for win7 安装
- 《利用Python 进行数据分析》 - 笔记(4)
- Python第三方库整理
- python xml.etree.ElementTree解析xml文件获取节点
- python的list,tuple,dist,set和不可变对象