qperf测量网络带宽和延迟
2016-04-13 01:25
801 查看
原创文章,转载请注明: 转载自系统技术非业余研究
本文链接地址: qperf测量网络带宽和延迟
我们在做网络服务器的时候,通常会很关心网络的带宽和延迟。因为我们的很多协议都是request-reponse协议,延迟决定了最大的QPS,而带宽决定了最大的负荷。 通常我们知道自己的网卡是什么型号,交换机什么型号,主机之间的物理距离是多少,理论上是知道带宽和延迟是多少的。但是现实的情况是,真正的带宽和延迟情况会有很多变数的,比如说网卡驱动,交换机跳数,丢包率,协议栈配置,光实际速度都很大的影响了数值的估算。 所以我们需要找到工具来实际测量下。
网络测量的工具有很多,netperf什么的都很不错。 我这里推荐了qperf,这是RHEL 6发行版里面自带的,所以使用起来很方便,只要简单的:
yum install qperf
就好。
我们看下man qperf的介绍:
qperf measures bandwidth and latency between two nodes. It can work over TCP/IP as well as the RDMA transports. On one of the nodes, qperf is typically run with no arguments designating it the server node. One may then run qperf on a client node to obtain measurements such as bandwidth, latency and cpu utilization.
In its most basic form, qperf is run on one node in server mode by invoking it with no arguments. On the other node, it is run with two arguments: the name of the server node followed by the name of the test. A list of tests can be found in the section, TESTS. A variety of options may also be specified.
使用起来也相当简单:
在其中一台机器上运行qperf,不带任何参数就好,这台机器就充当服务器角色:
在另外一台机器上运行qperf,测量tcp的带宽和延时,顺便看下双方机器的配置情况:
是不是很方便?典型情况下我们的带宽是118M,延迟是32us, 在标准的千M环境下是符合预期的。
当然qperf有很多高级参数,可以设置socket buffer的大小,绑定CPU亲缘性等, 很赞的一个特性是可以通过持续改变某个重要参数的值,来观察临界点:
-oo, –loop Var:Init:Last:Incr
Run a test multiple times sequencing through a series of values. Var is the loop variable;
Init is the initial value; Last is the value it must not exceed and Incr is the increment. It
is useful to set the –verbose_used (-vu) option in conjunction with this option.
比如我们可以透过改变消息的大小(msg_size),比如从1个字节到64K,每次倍增的方式,来观察带宽和延迟的变化情况,演示下:
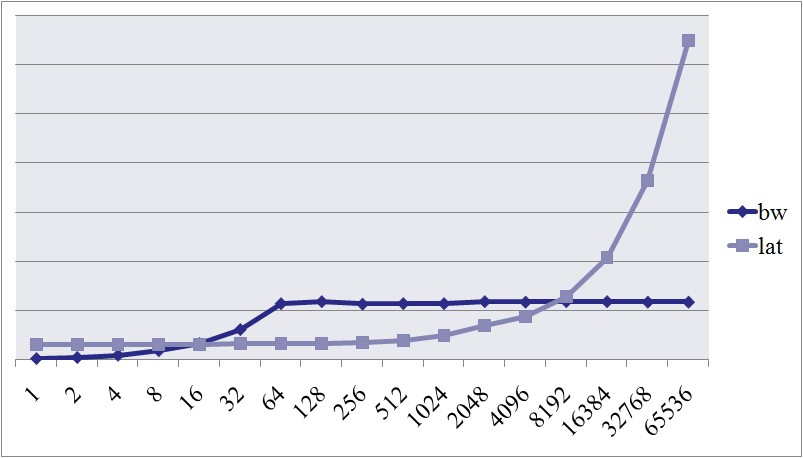
我们可以看到当包的大小达到64字节的时候,带宽就上不去了;包到达1K的时候,延迟有了很大的变化。 这些临界点对我们的服务器编程时候对性能的估计和预期非常有帮助。
qperf除了测量tcp的,还可以测试rdma, udp, sctp等主流网络协议的带宽和延迟,算是个很新的工具,推荐大家使用。
祝玩得开心!
本文链接地址: qperf测量网络带宽和延迟
我们在做网络服务器的时候,通常会很关心网络的带宽和延迟。因为我们的很多协议都是request-reponse协议,延迟决定了最大的QPS,而带宽决定了最大的负荷。 通常我们知道自己的网卡是什么型号,交换机什么型号,主机之间的物理距离是多少,理论上是知道带宽和延迟是多少的。但是现实的情况是,真正的带宽和延迟情况会有很多变数的,比如说网卡驱动,交换机跳数,丢包率,协议栈配置,光实际速度都很大的影响了数值的估算。 所以我们需要找到工具来实际测量下。
网络测量的工具有很多,netperf什么的都很不错。 我这里推荐了qperf,这是RHEL 6发行版里面自带的,所以使用起来很方便,只要简单的:
yum install qperf
就好。
我们看下man qperf的介绍:
qperf measures bandwidth and latency between two nodes. It can work over TCP/IP as well as the RDMA transports. On one of the nodes, qperf is typically run with no arguments designating it the server node. One may then run qperf on a client node to obtain measurements such as bandwidth, latency and cpu utilization.
In its most basic form, qperf is run on one node in server mode by invoking it with no arguments. On the other node, it is run with two arguments: the name of the server node followed by the name of the test. A list of tests can be found in the section, TESTS. A variety of options may also be specified.
使用起来也相当简单:
在其中一台机器上运行qperf,不带任何参数就好,这台机器就充当服务器角色:
$ uname -r |
2.6.32-131.21.1.tb477.el6.x86_64 |
$qperf |
$qperf 10.232.64.yyy tcp_bw tcp_lat conf |
tcp_bw: |
bw = 118 MB/sec |
tcp_lat: |
latency = 31.9 us |
conf: |
loc_node = xxx.sqa.cm4 |
loc_cpu= 16 Cores: Intel Xeon L5630 @ 2.13GHz |
loc_os = Linux 2.6.32-131.21.1.tb477.el6.x86_64 |
loc_qperf = 0.4.6 |
rem_node = yyy.sqa.cm4 |
rem_cpu= 16 Cores: Intel Xeon L5630 @ 2.13GHz |
rem_os = Linux 2.6.32-131.21.1.tb477.el6.x86_64 |
rem_qperf = 0.4.6 |
当然qperf有很多高级参数,可以设置socket buffer的大小,绑定CPU亲缘性等, 很赞的一个特性是可以通过持续改变某个重要参数的值,来观察临界点:
-oo, –loop Var:Init:Last:Incr
Run a test multiple times sequencing through a series of values. Var is the loop variable;
Init is the initial value; Last is the value it must not exceed and Incr is the increment. It
is useful to set the –verbose_used (-vu) option in conjunction with this option.
比如我们可以透过改变消息的大小(msg_size),比如从1个字节到64K,每次倍增的方式,来观察带宽和延迟的变化情况,演示下:
$qperf -oo msg_size:1:64K:*2 10.232.64.yyy tcp_bw tcp_lat |
tcp_bw: |
bw = 2.43 MB/sec |
tcp_bw: |
bw = 4.69 MB/sec |
tcp_bw: |
bw = 9.12 MB/sec |
tcp_bw: |
bw = 18.5 MB/sec |
tcp_bw: |
bw = 33.1 MB/sec |
tcp_bw: |
bw = 61.4 MB/sec |
tcp_bw: |
bw = 114 MB/sec |
tcp_bw: |
bw = 118 MB/sec |
tcp_bw: |
bw = 113 MB/sec |
tcp_bw: |
bw = 114 MB/sec |
tcp_bw: |
bw = 114 MB/sec |
tcp_bw: |
bw = 118 MB/sec |
tcp_bw: |
bw = 117 MB/sec |
tcp_bw: |
bw = 118 MB/sec |
tcp_bw: |
bw = 118 MB/sec |
tcp_bw: |
bw = 117 MB/sec |
tcp_bw: |
bw = 117 MB/sec |
tcp_lat: |
latency = 31 us |
tcp_lat: |
latency = 31.1 us |
tcp_lat: |
latency = 31.1 us |
tcp_lat: |
latency = 31.4 us |
tcp_lat: |
latency = 30.8 us |
tcp_lat: |
latency = 32.1 us |
tcp_lat: |
latency = 32.6 us |
tcp_lat: |
latency = 33.3 us |
tcp_lat: |
latency = 35.5 us |
tcp_lat: |
latency = 38.6 us |
tcp_lat: |
latency = 50.1 us |
tcp_lat: |
latency = 69.6 us |
tcp_lat: |
latency = 88 us |
tcp_lat: |
latency = 128 us |
tcp_lat: |
latency = 209 us |
tcp_lat: |
latency = 365 us |
tcp_lat: |
latency = 650 us |
我们可以看到当包的大小达到64字节的时候,带宽就上不去了;包到达1K的时候,延迟有了很大的变化。 这些临界点对我们的服务器编程时候对性能的估计和预期非常有帮助。
qperf除了测量tcp的,还可以测试rdma, udp, sctp等主流网络协议的带宽和延迟,算是个很新的工具,推荐大家使用。
祝玩得开心!

相关文章推荐
- 安装完Android Studio出现Internal error. Please report to https://code.google.com/p/android/issues
- iOS开发之网络编程篇一:网络开发基本概念介绍
- Http会话cookie session
- VMware虚拟机上网络连接(network type)的三种模式--bridged、host-only、NAT
- VMware虚拟机网络详解(包括多网卡)
- 生产环境常见的HTTP状态码列表
- TCP协议疑难杂症全景解析
- HttpURLConnection请求返回数据乱码!
- HttpURLConnection(代码实现http请求)
- 网络营销团队怎么留住人才 企业文化建设很重要
- TCP 的那些事儿
- Muduo网络库源码分析(三)线程间使用eventfd通信和EventLoop::runInLoop系列函数
- IOS学习 网络NSURLSession JSON文件解析、本地服务器启动、MAC混编
- http authorization basic请求代码示例
- 用 Redis 轻松实现秒杀系统---双十一和12306的瞬时网络爆发访问
- http://kanglecjr.iteye.com/blog/1071199
- http://www.cnblogs.com/dolphin0520/p/3949310.html
- Linux网络编程socket选项之SO_LINGER,SO_REUSEADDR
- Java Socket之网络相关API
- [深入浅出Cocoa]iOS网络编程之NSStream