最小二乘曲线拟合的MATLAB仿真
2016-03-14 16:20
281 查看
1、利用MATLAB figure->TOOLS->BASIC FITTING 直接在figure中生成拟合曲线
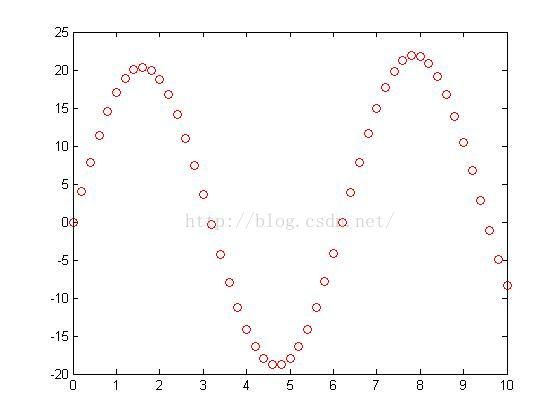
>> x=0:0.2:10;
>> y=0.25*x+20*sin(x);
>> plot(x,y,'ro')
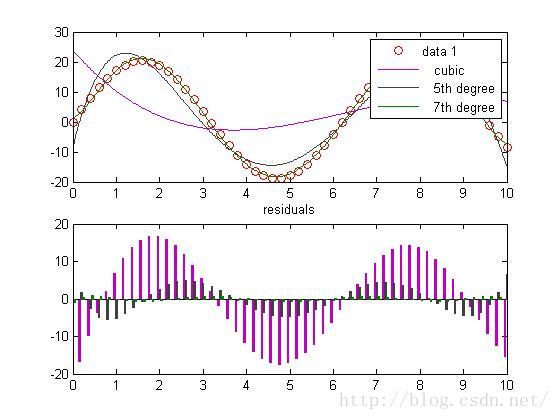
2、选择拟合系数'plots fits' cubic 5th 8th
3、点击’plot residuals‘显示拟合误差
参考文献:http://www.cnki.com.cn/Article/CJFDTOTAL-NMMS200902005.htm
>> x=0:0.2:10;
>> y=0.25*x+20*sin(x);
>> plot(x,y,'ro')
2、选择拟合系数'plots fits' cubic 5th 8th
3、点击’plot residuals‘显示拟合误差
参考文献:http://www.cnki.com.cn/Article/CJFDTOTAL-NMMS200902005.htm

相关文章推荐
- 解析在main函数之前调用函数以及对设计的作用详解
- java和matlab画多边形闭合折线图示例讲解
- C#调用Matlab生成的dll方法的详细说明
- 从java中调用matlab详细介绍
- 稀疏自动编码器 (Sparse Autoencoder)
- VC++与Matlab混合编程的快速实现
- Matlab 矩阵运算
- matlab与opencv部分函数的对照
- matlab神经网络工具箱创建神经网络
- Matlab
- MATLAB 入门教程
- matlab函数_连通区域
- MATLAB中函数模式和命令模式的区别
- MATLAB 添加自定义的模块到simulink库浏览器
- Export Figures for LaTeX Writing
- Image Batch Processing with Matlab
- MATLAB for Mac使编辑器支持中文
- [转]matlab中plot用法
- 初学数模-MATLAB Quick Start! Part I