linux下搭建nagios监控
2016-01-09 20:27
483 查看
一、什么是nagios
1.nagios 简介
Nagios是一个监视系统运行状态和网络信息的监视系统。Nagios能监视所指定的本地或远程主机以及服务,同时提供异常通知功能等。Nagios可运行在Linux/Unix平台之上,同时提供一个可选的基于浏览器的WEB界面以方便系统管理人员查看网络状态,各种系统问题,以及日志等等。
Nagios是十分受欢迎的、开源且免费的计算机及网络系统监控软件。Nagios是“Nagios Ain‘t Gonna Insist On Sainthood”的缩写。它最早是在1999年以“NetSaint”发布。Nagios主要应用在Linux和Unix平台环境下的监控,但通过插件,也可以监控MS Windows系统的主机。Nagios在LinuxCon 2010 Poll并选为最受欢迎的IT运维工具。它被Infoworld在2009年评为最佳开源软件,同时也是该年度的SourceForge社区的系统管理工具最佳选择。Nagios也被很多知名企业所采用,包括AOL,DHL,At&t,欧莱雅,德州仪器,Siemens
COM CZ,时代华纳有线,Yahoo等。
2.Nagios的主要功能特点:
- 监视网络服务 (SMTP, POP3, HTTP, NNTP, PING等)
- 监视主机资源 (进程, 磁盘等)
- 简单的插件设计可以轻松扩展Nagios的监视功能
- 服务等监视的并发处理
- 错误通知功能 (通过email, pager, 或其他用户自定义方法)
- 可指定自定义的事件处理控制器
- 可选的基于浏览器的WEB界面以方便系统管理人员查看网络状态,各种系统问题,以及日志等等
- 可以通过手机查看系统监控信息
二、nagios 监控环境搭建
1.搭建环境介绍:
2.基础服务端安装:
[root@webserver ~]#
yum install -y epel-release //若机器安装的有epel扩展源则省略此步骤
[root@webserver ~]# yum install -y httpd nagios nagios-plugins nagios-plugins-all nrpe nagios-plugins-nrpe
//安装nagios相关包
[root@webserver ~]# htpasswd -c /etc/nagios/passwd nagiosadmin //生成登录nagios后台的帐号及密码
New password:
Re-type new password:
Adding password for user nagiosadmin
[root@webserver ~]# nagios -v /etc/nagios/nagios.cfg //检测nagios配置文件是否错误
Total Warnings: 0
Total Errors: 0
Things look okay - No serious problems were detected during the pre-flight check
启动服务端nagios服务及监控的服务:
[root@webserver ~]# /etc/init.d/httpd start
[root@webserver ~]# /etc/init.d/nagios start
登录浏览器输入 http://ip/nagios ,查看服务是nagios是否搭建成功
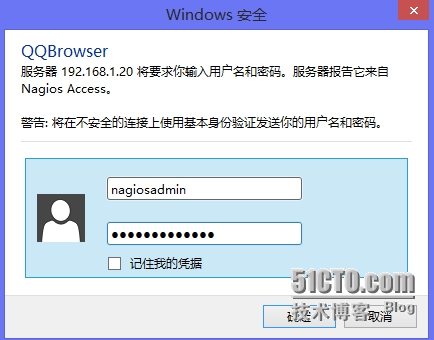
通过输入刚才生成的密码进入nagios后台管理;
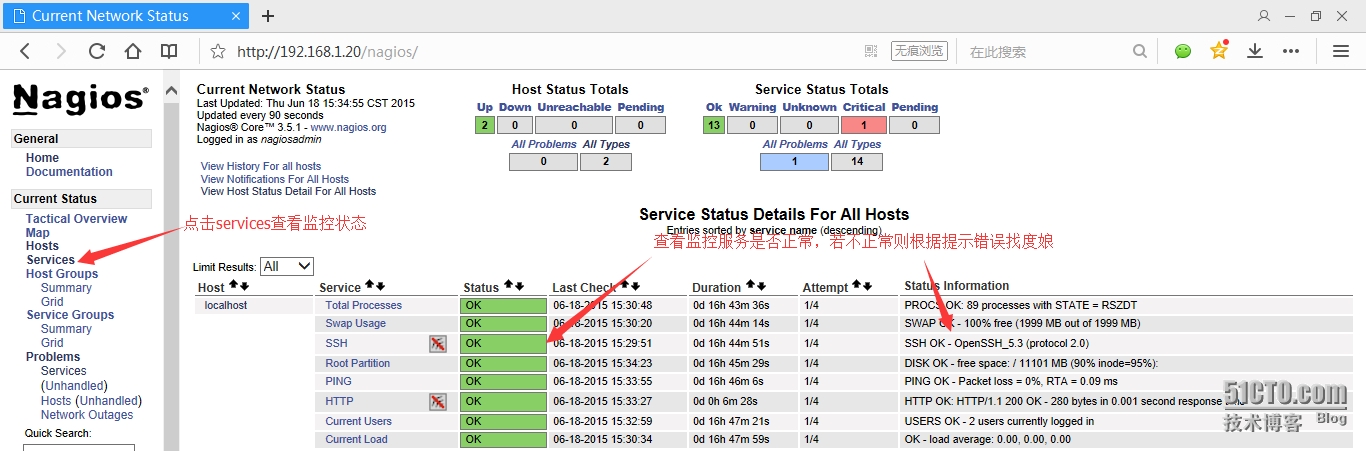
点击serviers查看监控,根据监控的服务是否正常进行调试;
刚开始http服务能会有warning,错误提示为HTTP WARNING: HTTP/1.1 403 Forbidden - 5152 bytes in 0.001 second response t;
原因为:nagios监控HTTP时,会监控到/var/www/html/下面的index.html文件,若没有就会提示错误,创建一个文件即可!创建后等一会便会将监控状态变为OK;
3.增加服务端nagios 监控机(增加监控客户端)
客户端安装nagios监控服务及文件配置:
[root@hpf-linux ~]# yum
install -y epel-release //若客户端已安装epel扩展源则省略此步骤
[root@hpf-linux ~]# yum
install -y nagios-plugins nagios-plugins-all nrpe nagios-plugins-nrpe //安装nagios监控相关包
[root@hpf-linux ~]# vi /etc/nagios/nrpe.cfg
找到“allowed_hosts=127.0.0.1” 改为 “allowed_hosts=127.0.0.1,192.168.1.20” 后面的ip为服务端ip;
找到” dont_blame_nrpe=0” 改为 “dont_blame_nrpe=1”
下面两个配置文件的更改是根据nagios服务端添加的监控服务(check_hda1)进行更改的:
command[check_hda1]=/usr/lib/nagios/plugins/check_disk -w 20% -c 10% -p /dev/sda1
command[check_hda2]=/usr/lib/nagios/plugins/check_disk -w 20% -c 10% -p /dev/sda2
配置服务端nagios脚本文件:
[root@webserver conf.d]# vi /etc/nagios/objects/commands.cfg //在该配置文件下添加以下内容
define command{
command_name check_nrpe
command_line $USER1$/check_nrpe -H $HOSTADDRESS$ -c $ARG1$
}
[root@webserver ~]# cd /etc/nagios/conf.d/
[root@webserver conf.d]# vi 192.168.1.110.cfg
define host{
use linux-server
host_name 192.168.1.110
alias 1.110
address 192.168.1.110
}
define service{
use generic-service
host_name 192.168.1.110
service_description check_ping
check_command check_ping!100.0,20%!200.0,50%
max_check_attempts 5
normal_check_interval 1
}
define service{
use generic-service
host_name 192.168.1.110
service_description check_ssh
check_command check_ssh
max_check_attempts 5 #当nagios检测到问题时,一共尝试检测5次都有问题才会告警,如果该数值为1,那么检测到问题立即告警
normal_check_interval 1 #重新检测的时间间隔,单位是分钟,默认是3分钟
notification_interval 60 #在服务出现异常后,故障一直没有解决,nagios再次对使用者发出通知的时间。单位是分钟。如果你认为,所有的事件只需要一次通知就够了,可以把这里的选项设为0。
}
define service{
use generic-service
host_name 192.168.1.110
service_description check_http
check_command check_http
max_check_attempts 5
normal_check_interval 1
}
define service{
use generic-service
host_name 192.168.1.110
service_description check_load
check_command check_nrpe!check_load
max_check_attempts 5
normal_check_interval 1
}
define service{
use generic-service
host_name 192.168.1.110
service_description check_disk_hda1
check_command check_nrpe!check_hda1
max_check_attempts 5
normal_check_interval 1
}
define service{
use generic-service
host_name 192.168.1.110
service_description check_disk_hda2
check_command check_nrpe!check_hda2
max_check_attempts 5
normal_check_interval 1
}
[root@webserver ~]# nagios -v /etc/nagios/nagios.cfg //检测配置文件是否正确
Total Warnings: 0
Total Errors: 0
Things look okay - No serious problems were detected during the pre-flight check
在客户端启动nrpe服务:
[root@hpf-linux ~]#
/etc/init.d/nrpe start
在服务端上重启nagios服务:
[root@webserver ~]# /etc/init.d/nagios
restart
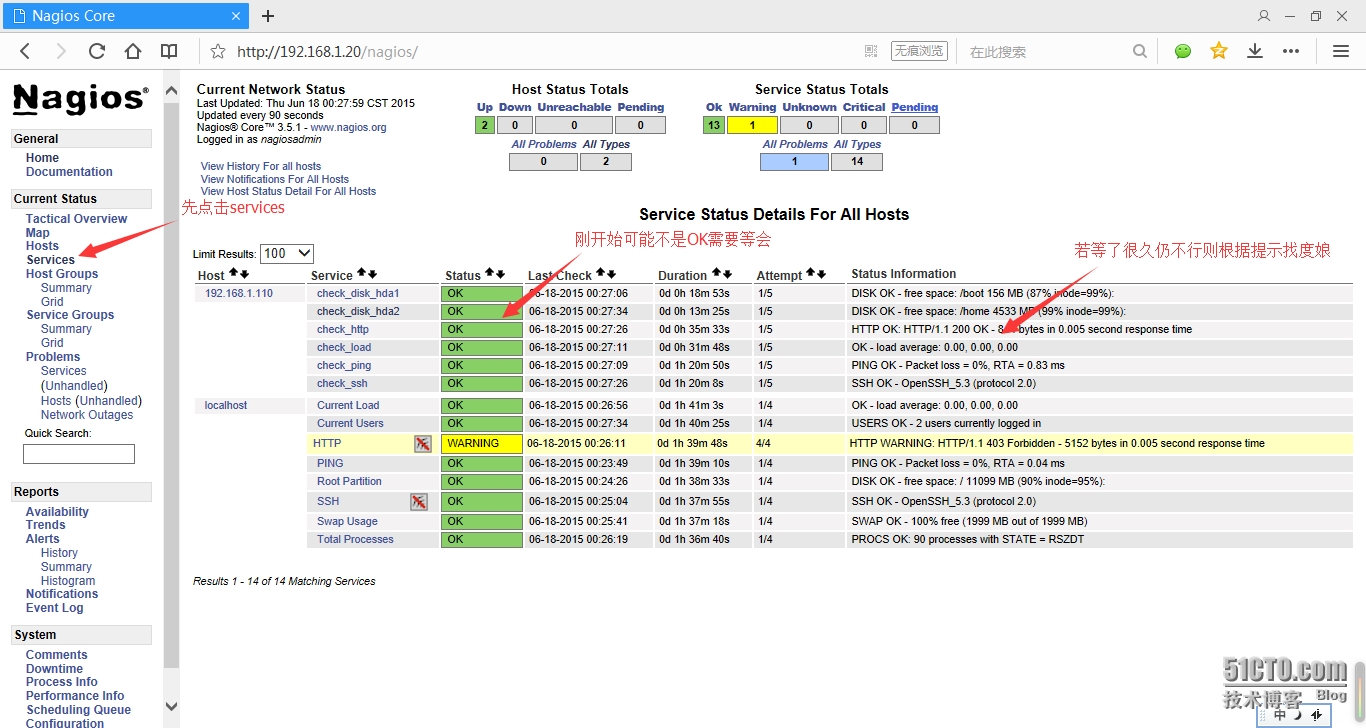
在浏览器上查看nagios服务的监控是否正常显示:
4.配置邮件报警:
[root@webserver ~]#
vim /etc/nagios/objects/contacts.cfg
define contact{
contact_name nagios1
use generic-contact
alias mail1
email hpf_thqfsj@163.com
}
define contact{
contact_name nagios2
use generic-contact
alias mail2
email 568347223@qq.com
}
define contactgroup{
contactgroup_name common
alias common
members nagios1,nagios2
}
[root@webserver conf.d]#
vi 192.168.1.110.cfg
在上面的192.168.1.110.cfg 配置文件有如下一段内容:
define service{
use generic-service
host_name 192.168.1.110
service_description check_load
check_command check_nrpe!check_load
max_check_attempts 5
normal_check_interval 1
}
将上面一段配置的最后添加以下四个语句:
contact_groups common
notifications_enabled 1 #是否开启提醒功能。1为开启,0为禁用。一般,这个选项会在主配置文件(nagios.cfg)中定义,效果相同。
notification_period 24x7 #发送提醒的时间段。非常重要的主机(服务)我定义为7×24,一般的主机(服务)就定义为上班时间。如果不在定义的时间段内,无论什么问题发生,都不会发送提醒。
notification_options w,u,c,r #这个是service的状态。w为waning, u为unknown, c为critical, r为recover(恢复了),类似的还有一个 host对应的状态:d,u,r d = 状态为DOWN, u = 状态为UNREACHABLE , r = 状态恢复为OK,需要加入到host的定义配置里。
[root@localhost ~]# nagios -v /etc/nagios/nagios.cfg //检测配置文件是否错误
Total Warnings: 0
Total Errors: 0
Things look okay - No serious problems were detected during the pre-flight check
5、验证报警邮件配置是否成功:
开启虚拟机邮件服务
[root@webserver ~]# yum
install -y sendmail //安装邮件服务包
[root@webserver ~]#
/etc/init.d/sendmail start //启动邮件服务
[root@webserver ~]# netstat -lnp |grep sendmail //查看邮件服务开启的端口
tcp 0 0 127.0.0.1:25 0.0.0.0:* LISTEN 1011/sendmail
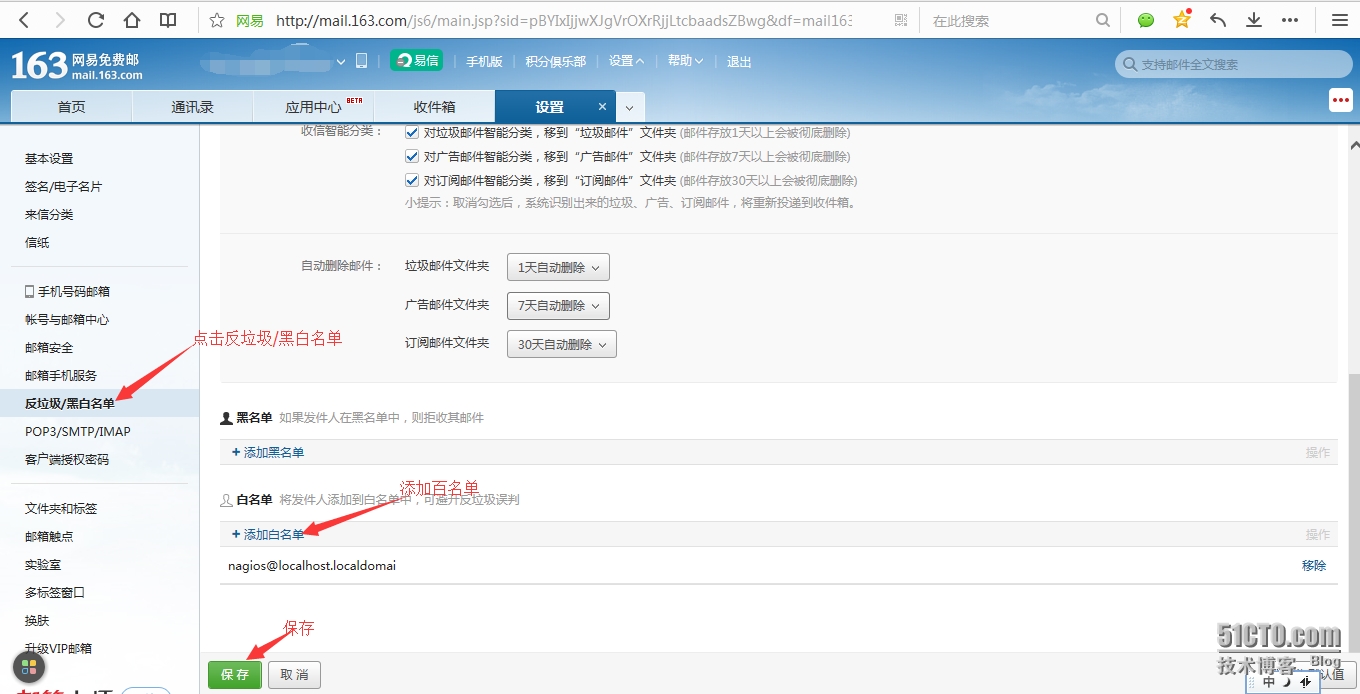
在浏览器上配置163邮箱的白名单以防止把报警邮件当成垃圾邮件:
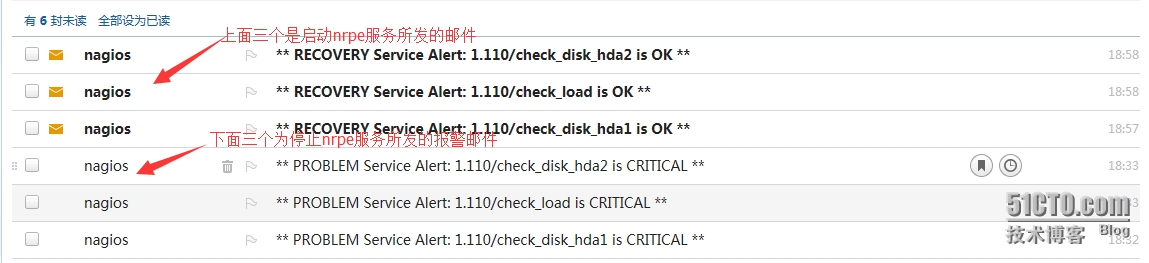
[root@hpf-linux ~]# /etc/init.d/nrpe stop //在客户端关闭nrpe服务看服务端是否发送报警邮件;
Shutting down nrpe: [确定]
报警邮件发送时间会有一段时间的延时,需要耐心等待;
本文出自 “粗茶淡饭” 博客,请务必保留此出处http://cuchadanfan.blog.51cto.com/9940284/1663267
1.nagios 简介
Nagios是一个监视系统运行状态和网络信息的监视系统。Nagios能监视所指定的本地或远程主机以及服务,同时提供异常通知功能等。Nagios可运行在Linux/Unix平台之上,同时提供一个可选的基于浏览器的WEB界面以方便系统管理人员查看网络状态,各种系统问题,以及日志等等。
Nagios是十分受欢迎的、开源且免费的计算机及网络系统监控软件。Nagios是“Nagios Ain‘t Gonna Insist On Sainthood”的缩写。它最早是在1999年以“NetSaint”发布。Nagios主要应用在Linux和Unix平台环境下的监控,但通过插件,也可以监控MS Windows系统的主机。Nagios在LinuxCon 2010 Poll并选为最受欢迎的IT运维工具。它被Infoworld在2009年评为最佳开源软件,同时也是该年度的SourceForge社区的系统管理工具最佳选择。Nagios也被很多知名企业所采用,包括AOL,DHL,At&t,欧莱雅,德州仪器,Siemens
COM CZ,时代华纳有线,Yahoo等。
2.Nagios的主要功能特点:
- 监视网络服务 (SMTP, POP3, HTTP, NNTP, PING等)
- 监视主机资源 (进程, 磁盘等)
- 简单的插件设计可以轻松扩展Nagios的监视功能
- 服务等监视的并发处理
- 错误通知功能 (通过email, pager, 或其他用户自定义方法)
- 可指定自定义的事件处理控制器
- 可选的基于浏览器的WEB界面以方便系统管理人员查看网络状态,各种系统问题,以及日志等等
- 可以通过手机查看系统监控信息
二、nagios 监控环境搭建
1.搭建环境介绍:
| hostname | IP | 系统 | |
| 服务端 | webserver | 192.168.1.20 | CentOS 6.6 |
| 客户端 | hpf-linux | 192.168.1.110 | CentOS 6.6 |
[root@webserver ~]#
yum install -y epel-release //若机器安装的有epel扩展源则省略此步骤
[root@webserver ~]# yum install -y httpd nagios nagios-plugins nagios-plugins-all nrpe nagios-plugins-nrpe
//安装nagios相关包
[root@webserver ~]# htpasswd -c /etc/nagios/passwd nagiosadmin //生成登录nagios后台的帐号及密码
New password:
Re-type new password:
Adding password for user nagiosadmin
[root@webserver ~]# nagios -v /etc/nagios/nagios.cfg //检测nagios配置文件是否错误
Total Warnings: 0
Total Errors: 0
Things look okay - No serious problems were detected during the pre-flight check
启动服务端nagios服务及监控的服务:
[root@webserver ~]# /etc/init.d/httpd start
[root@webserver ~]# /etc/init.d/nagios start
登录浏览器输入 http://ip/nagios ,查看服务是nagios是否搭建成功
通过输入刚才生成的密码进入nagios后台管理;
点击serviers查看监控,根据监控的服务是否正常进行调试;
刚开始http服务能会有warning,错误提示为HTTP WARNING: HTTP/1.1 403 Forbidden - 5152 bytes in 0.001 second response t;
原因为:nagios监控HTTP时,会监控到/var/www/html/下面的index.html文件,若没有就会提示错误,创建一个文件即可!创建后等一会便会将监控状态变为OK;
3.增加服务端nagios 监控机(增加监控客户端)
客户端安装nagios监控服务及文件配置:
[root@hpf-linux ~]# yum
install -y epel-release //若客户端已安装epel扩展源则省略此步骤
[root@hpf-linux ~]# yum
install -y nagios-plugins nagios-plugins-all nrpe nagios-plugins-nrpe //安装nagios监控相关包
[root@hpf-linux ~]# vi /etc/nagios/nrpe.cfg
找到“allowed_hosts=127.0.0.1” 改为 “allowed_hosts=127.0.0.1,192.168.1.20” 后面的ip为服务端ip;
找到” dont_blame_nrpe=0” 改为 “dont_blame_nrpe=1”
下面两个配置文件的更改是根据nagios服务端添加的监控服务(check_hda1)进行更改的:
command[check_hda1]=/usr/lib/nagios/plugins/check_disk -w 20% -c 10% -p /dev/sda1
command[check_hda2]=/usr/lib/nagios/plugins/check_disk -w 20% -c 10% -p /dev/sda2
配置服务端nagios脚本文件:
[root@webserver conf.d]# vi /etc/nagios/objects/commands.cfg //在该配置文件下添加以下内容
define command{
command_name check_nrpe
command_line $USER1$/check_nrpe -H $HOSTADDRESS$ -c $ARG1$
}
[root@webserver ~]# cd /etc/nagios/conf.d/
[root@webserver conf.d]# vi 192.168.1.110.cfg
define host{
use linux-server
host_name 192.168.1.110
alias 1.110
address 192.168.1.110
}
define service{
use generic-service
host_name 192.168.1.110
service_description check_ping
check_command check_ping!100.0,20%!200.0,50%
max_check_attempts 5
normal_check_interval 1
}
define service{
use generic-service
host_name 192.168.1.110
service_description check_ssh
check_command check_ssh
max_check_attempts 5 #当nagios检测到问题时,一共尝试检测5次都有问题才会告警,如果该数值为1,那么检测到问题立即告警
normal_check_interval 1 #重新检测的时间间隔,单位是分钟,默认是3分钟
notification_interval 60 #在服务出现异常后,故障一直没有解决,nagios再次对使用者发出通知的时间。单位是分钟。如果你认为,所有的事件只需要一次通知就够了,可以把这里的选项设为0。
}
define service{
use generic-service
host_name 192.168.1.110
service_description check_http
check_command check_http
max_check_attempts 5
normal_check_interval 1
}
define service{
use generic-service
host_name 192.168.1.110
service_description check_load
check_command check_nrpe!check_load
max_check_attempts 5
normal_check_interval 1
}
define service{
use generic-service
host_name 192.168.1.110
service_description check_disk_hda1
check_command check_nrpe!check_hda1
max_check_attempts 5
normal_check_interval 1
}
define service{
use generic-service
host_name 192.168.1.110
service_description check_disk_hda2
check_command check_nrpe!check_hda2
max_check_attempts 5
normal_check_interval 1
}
[root@webserver ~]# nagios -v /etc/nagios/nagios.cfg //检测配置文件是否正确
Total Warnings: 0
Total Errors: 0
Things look okay - No serious problems were detected during the pre-flight check
在客户端启动nrpe服务:
[root@hpf-linux ~]#
/etc/init.d/nrpe start
在服务端上重启nagios服务:
[root@webserver ~]# /etc/init.d/nagios
restart
在浏览器上查看nagios服务的监控是否正常显示:
4.配置邮件报警:
[root@webserver ~]#
vim /etc/nagios/objects/contacts.cfg
define contact{
contact_name nagios1
use generic-contact
alias mail1
email hpf_thqfsj@163.com
}
define contact{
contact_name nagios2
use generic-contact
alias mail2
email 568347223@qq.com
}
define contactgroup{
contactgroup_name common
alias common
members nagios1,nagios2
}
[root@webserver conf.d]#
vi 192.168.1.110.cfg
在上面的192.168.1.110.cfg 配置文件有如下一段内容:
define service{
use generic-service
host_name 192.168.1.110
service_description check_load
check_command check_nrpe!check_load
max_check_attempts 5
normal_check_interval 1
}
将上面一段配置的最后添加以下四个语句:
contact_groups common
notifications_enabled 1 #是否开启提醒功能。1为开启,0为禁用。一般,这个选项会在主配置文件(nagios.cfg)中定义,效果相同。
notification_period 24x7 #发送提醒的时间段。非常重要的主机(服务)我定义为7×24,一般的主机(服务)就定义为上班时间。如果不在定义的时间段内,无论什么问题发生,都不会发送提醒。
notification_options w,u,c,r #这个是service的状态。w为waning, u为unknown, c为critical, r为recover(恢复了),类似的还有一个 host对应的状态:d,u,r d = 状态为DOWN, u = 状态为UNREACHABLE , r = 状态恢复为OK,需要加入到host的定义配置里。
[root@localhost ~]# nagios -v /etc/nagios/nagios.cfg //检测配置文件是否错误
Total Warnings: 0
Total Errors: 0
Things look okay - No serious problems were detected during the pre-flight check
5、验证报警邮件配置是否成功:
开启虚拟机邮件服务
[root@webserver ~]# yum
install -y sendmail //安装邮件服务包
[root@webserver ~]#
/etc/init.d/sendmail start //启动邮件服务
[root@webserver ~]# netstat -lnp |grep sendmail //查看邮件服务开启的端口
tcp 0 0 127.0.0.1:25 0.0.0.0:* LISTEN 1011/sendmail
在浏览器上配置163邮箱的白名单以防止把报警邮件当成垃圾邮件:
[root@hpf-linux ~]# /etc/init.d/nrpe stop //在客户端关闭nrpe服务看服务端是否发送报警邮件;
Shutting down nrpe: [确定]
报警邮件发送时间会有一段时间的延时,需要耐心等待;
本文出自 “粗茶淡饭” 博客,请务必保留此出处http://cuchadanfan.blog.51cto.com/9940284/1663267

相关文章推荐
- Linux socket 初步
- 小心服务器内存居高不下的元凶--WebAPI服务
- linux lsof详解
- linux 文件权限
- Linux 执行数学运算
- 10 篇对初学者和专家都有用的 Linux 命令教程
- Linux 与 Windows 对UNICODE 的处理方式
- Ubuntu12.04下QQ完美走起啊!走起啊!有木有啊!
- 解決Linux下Android开发真机调试设备不被识别问题
- 运维入门
- 运维提升
- Linux 自检和 SystemTap
- Ubuntu Linux使用体验
- c语言实现hashmap(转载)
- Linux 信号signal处理机制
- linux下mysql添加用户
- Scientific Linux 5.5 图形安装教程