使用Node.js + MongoDB实现一个简单的日志分析系统
2015-07-10 17:05
1521 查看
在最近的项目中,为了便于分析把项目的日志都存成了JSON格式。之前日志直接存在了文件中,而MongoDB适时闯入了我的视线,于是就把log存进了MongoDB中。log只存起来是没有意义的,最关键的是要从日志中发现业务的趋势、系统的性能漏洞等。之前有一个用Java写的分析模块,运行在Tomcat下。实现相当的重量级,添加一个新指标的流程也比较繁琐,而且由于NFS的原因还导致分析失败。一直想改写,最初想用Ruby On Rails,可是一直没有时间学习和开发(在找借口啊!)。在杭州QCon
2011上又遇到了Node.js,虽然之前也听说过,但是没有深入研究,听了淘宝苏千 的演讲后,当时了就有要用Node.js实现这个日志分析系统的想法。前端用JS,服务器用JS,就连数据库的Shell都是JS,想想就够酷的——当然最关键是代码量小。
一、用Node.js实现服务器端代码
为了有良好的风格和快速的代码编写,不可避免地应该采用一个简单的框架。Express实现了大部分的功能,可是好需要花一定时间熟悉,并且看起来对这个项目来说有些重量级。在Node.js的官网上有一个聊天的Demo,这个代码简单移动,封装了对URL的处理和返回JSON。于是我就直接使用了fu.js,重写了server.js:
[javascript] view
plaincopyprint?
HOST = null; // localhost
PORT = 8001;
var fu = require("./fu"),
sys = require("util"),
url = require("url"),
mongo = require("./request_handler");
fu.listen(Number(process.env.PORT || PORT), HOST);
fu.get("/", fu.staticHandler("index.html"));
太简单了吧?!不过的确是这样,一个服务器已经建立起来了。
下面看处理请求的request_handler.js代码:
[javascript] view
plaincopyprint?
var mongodb = require("mongodb");
var fu = require("./fu");
// TOP 10 user Action
fu.get("/userActionTop10", function(req, res){
mongodb.connect('mongodb://localhost:27017/log', function(err, conn){
conn.collection('action_count', function(err, coll){
coll.find({"value.action":{$in:user_action}}).sort({"value.count":-1}).limit(10).toArray(function(err, docs){
if(!err){
var action = [];
var count = [];
for(var i = 0; i < docs.length; i ++){
//console.log(docs[i]);
action.push(docs[i].value.action);
count.push(docs[i].value.count);
}
res.simpleJSON(200, {action:action, count:count});
// 一定要记得关闭数据库连接
conn.close();
}
});
});
});
});
同样很简单。
二、客户端
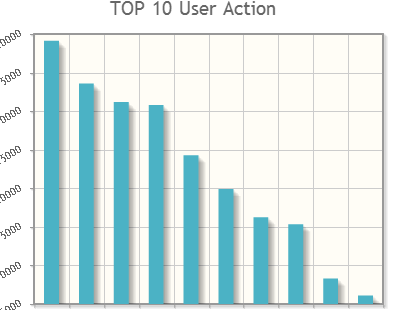
日志系统的最重要的是可视化显示,这里使用了JQuery的一个插件jqPlot Chart。首先使用一个静态的HTML页面,用来作为图形显示的容器:
[html] view
plaincopyprint?
<!DOCTYPE html>
<html>
<head>
<meta charset="utf-8">
<title>Rendezvous Monitor System</title>
<!--[if lt IE 9]><script src="js/excanvas.js"><![endif]-->
<script src="js/jquery.min.js"></script>
<script src="js/jquery.jqplot.min.js"></script>
<script src="js/plugins/jqplot.barRenderer.min.js"></script>
<script src="js/plugins/jqplot.categoryAxisRenderer.min.js"></script>
<script src="js/plugins/jqplot.canvasTextRenderer.min.js"></script>
<script src="js/plugins/jqplot.canvasAxisTickRenderer.min.js"></script>
<script src="js/plugins/jqplot.canvasAxisLabelRenderer.min.js"></script>
<script src="js/plugins/jqplot.pointLabels.min.js"></script>
<script src="js/plugins/jqplot.dateAxisRenderer.min.js"></script>
<script src="js/plugins/jqplot.json2.min.js"></script>
<link rel="stylesheet" href="js/jquery.jqplot.min.css">
<link rel="stylesheet" href="style/base.css">
<script src="js/charts.js"></script>
</head>
<body>
</body>
</html>
几乎是jqPlot的示例中的完整拷贝,好吧,我承认我太懒了。
下面是看用来显示生成图形的chart.js:
[javascript] view
plaincopyprint?
// Store all chart drawing function, if we want to disable one chart, only need
// comment the push line when putting fucntion into the array.
var draws = [];
/****************************** TOP 10 User Action Start *********************************/
document.write('<div id="userActionTop10Chart"></div>');
var drawUserActionTop10Chart = function(){
if(!$("#userActionTop10Chart").attr('class')){
$("#userActionTop10Chart").attr('class', 'small_chart');
}
$.ajax({
async:false,
url: '/userActionTop10',
dataType:'json',
cache: false,
success:function(data){
try{
$('#userActionTop10Chart').html('');
$.jqplot('userActionTop10Chart', [data.count], {
title: "TOP 10 User Action",
seriesDefaults:{
renderer:$.jqplot.BarRenderer,
rendererOptions: {fillToZero: true},
pointLabels: {
show:true,
ypadding:1
}
},
axesDefaults:{
tickRenderer:$.jqplot.CanvasAxisTickRenderer,
tickOptions: {
angle: -30,
fontSize: '12px'
}
},
axes: {
xaxis: {
renderer: $.jqplot.CategoryAxisRenderer,
ticks: data.action
},
yaxis: {
pad: 1.05
}
}
});
}catch(e){
//alert(e.message);
}
}
});
}
draws.push('drawUserActionTop10Chart');
/******************************* TOP 10 User Action End ************************************/
/*********** Chart Start *****************/
//Put your chart drawing function here
//1. insert a div for the chart
//2. implement the function drawing chart
//3. push the function name into the array draws
/*********** Chart End *******************/
// Draw all charts
var drawAllCharts = function(){
for(var i = 0; i < draws.length; i ++){
eval(draws[i] + "()");
}
//Recall itself in 5 minute.
window.setTimeout(drawAllCharts, 5 * 60 * 1000);
}
//
$(function(){
drawAllCharts();
});
服务器端和客户端的代码都有了,那就跑起来看效果吧:
好像忘了什么?日志的分析代码。
三、使用MongoDB 增量式MapReduce实现日志分析
在MongoDB的文档中有关于Incremental MapReduce的介绍。刚开始一直以为MongoDB实现Streaming处理,可以自动执行增量式的MapReduce。最后发现原来是我理解有误,文档里并没有写这一点,只是说明了如何设置才能增量执行MapReduce。
为了方便,我把MapReduce使用MongoDB的JavaScript写在了单独的js文件中,然后通过crontab定时执行。stats.js的代码:
[javascript] view
plaincopyprint?
/************** The file is executed per 5 minutes by /etc/crontab.*****************/
var action_count_map = function(){
emit(this.action, {action:this.action, count:1});
}
var action_count_reduce = function(key, values){
var count = 0;
values.forEach(function(value){
count += value.count;
});
return {action:key, count : count};
}
db.log.mapReduce(action_count_map, action_count_reduce, {query : {'action_count' : {$ne:1}},out: {reduce:'action_count'}});
db.log.update({'action_count':{$ne:1}}, {$set:{'action_count':1}}, false, true);
思路很简单:
1. 在map中将每个action访问次数设为1
2. reduce中,统计相同action的访问次数
3. 执行mapReduce。指定了查询为‘action_count’不等于1,也就是没有执行过该统计;将结果存储在‘action_count’集合,并且使用reduce选项表示该结果集作为下次reduce的输入。
4. 在当前所有日志记录设置'action_count'的值为1,表示已经执行过该统计。不知道这种是否会造成没有还没有统计过的记录也被更新??望有经验的大侠赐教!
定时执行stats.js的shell:
[plain] view
plaincopyprint?
*/5 * * * * root cd /root/log; mongo localhost:27017/log stats.js
好了,这就是全部的代码,没有什么特别玄妙的地方,不过Node.js真的是个好东西。
2011上又遇到了Node.js,虽然之前也听说过,但是没有深入研究,听了淘宝苏千 的演讲后,当时了就有要用Node.js实现这个日志分析系统的想法。前端用JS,服务器用JS,就连数据库的Shell都是JS,想想就够酷的——当然最关键是代码量小。
一、用Node.js实现服务器端代码
为了有良好的风格和快速的代码编写,不可避免地应该采用一个简单的框架。Express实现了大部分的功能,可是好需要花一定时间熟悉,并且看起来对这个项目来说有些重量级。在Node.js的官网上有一个聊天的Demo,这个代码简单移动,封装了对URL的处理和返回JSON。于是我就直接使用了fu.js,重写了server.js:
[javascript] view
plaincopyprint?
HOST = null; // localhost
PORT = 8001;
var fu = require("./fu"),
sys = require("util"),
url = require("url"),
mongo = require("./request_handler");
fu.listen(Number(process.env.PORT || PORT), HOST);
fu.get("/", fu.staticHandler("index.html"));
太简单了吧?!不过的确是这样,一个服务器已经建立起来了。
下面看处理请求的request_handler.js代码:
[javascript] view
plaincopyprint?
var mongodb = require("mongodb");
var fu = require("./fu");
// TOP 10 user Action
fu.get("/userActionTop10", function(req, res){
mongodb.connect('mongodb://localhost:27017/log', function(err, conn){
conn.collection('action_count', function(err, coll){
coll.find({"value.action":{$in:user_action}}).sort({"value.count":-1}).limit(10).toArray(function(err, docs){
if(!err){
var action = [];
var count = [];
for(var i = 0; i < docs.length; i ++){
//console.log(docs[i]);
action.push(docs[i].value.action);
count.push(docs[i].value.count);
}
res.simpleJSON(200, {action:action, count:count});
// 一定要记得关闭数据库连接
conn.close();
}
});
});
});
});
同样很简单。
二、客户端
日志系统的最重要的是可视化显示,这里使用了JQuery的一个插件jqPlot Chart。首先使用一个静态的HTML页面,用来作为图形显示的容器:
[html] view
plaincopyprint?
<!DOCTYPE html>
<html>
<head>
<meta charset="utf-8">
<title>Rendezvous Monitor System</title>
<!--[if lt IE 9]><script src="js/excanvas.js"><![endif]-->
<script src="js/jquery.min.js"></script>
<script src="js/jquery.jqplot.min.js"></script>
<script src="js/plugins/jqplot.barRenderer.min.js"></script>
<script src="js/plugins/jqplot.categoryAxisRenderer.min.js"></script>
<script src="js/plugins/jqplot.canvasTextRenderer.min.js"></script>
<script src="js/plugins/jqplot.canvasAxisTickRenderer.min.js"></script>
<script src="js/plugins/jqplot.canvasAxisLabelRenderer.min.js"></script>
<script src="js/plugins/jqplot.pointLabels.min.js"></script>
<script src="js/plugins/jqplot.dateAxisRenderer.min.js"></script>
<script src="js/plugins/jqplot.json2.min.js"></script>
<link rel="stylesheet" href="js/jquery.jqplot.min.css">
<link rel="stylesheet" href="style/base.css">
<script src="js/charts.js"></script>
</head>
<body>
</body>
</html>
几乎是jqPlot的示例中的完整拷贝,好吧,我承认我太懒了。
下面是看用来显示生成图形的chart.js:
[javascript] view
plaincopyprint?
// Store all chart drawing function, if we want to disable one chart, only need
// comment the push line when putting fucntion into the array.
var draws = [];
/****************************** TOP 10 User Action Start *********************************/
document.write('<div id="userActionTop10Chart"></div>');
var drawUserActionTop10Chart = function(){
if(!$("#userActionTop10Chart").attr('class')){
$("#userActionTop10Chart").attr('class', 'small_chart');
}
$.ajax({
async:false,
url: '/userActionTop10',
dataType:'json',
cache: false,
success:function(data){
try{
$('#userActionTop10Chart').html('');
$.jqplot('userActionTop10Chart', [data.count], {
title: "TOP 10 User Action",
seriesDefaults:{
renderer:$.jqplot.BarRenderer,
rendererOptions: {fillToZero: true},
pointLabels: {
show:true,
ypadding:1
}
},
axesDefaults:{
tickRenderer:$.jqplot.CanvasAxisTickRenderer,
tickOptions: {
angle: -30,
fontSize: '12px'
}
},
axes: {
xaxis: {
renderer: $.jqplot.CategoryAxisRenderer,
ticks: data.action
},
yaxis: {
pad: 1.05
}
}
});
}catch(e){
//alert(e.message);
}
}
});
}
draws.push('drawUserActionTop10Chart');
/******************************* TOP 10 User Action End ************************************/
/*********** Chart Start *****************/
//Put your chart drawing function here
//1. insert a div for the chart
//2. implement the function drawing chart
//3. push the function name into the array draws
/*********** Chart End *******************/
// Draw all charts
var drawAllCharts = function(){
for(var i = 0; i < draws.length; i ++){
eval(draws[i] + "()");
}
//Recall itself in 5 minute.
window.setTimeout(drawAllCharts, 5 * 60 * 1000);
}
//
$(function(){
drawAllCharts();
});
服务器端和客户端的代码都有了,那就跑起来看效果吧:
好像忘了什么?日志的分析代码。
三、使用MongoDB 增量式MapReduce实现日志分析
在MongoDB的文档中有关于Incremental MapReduce的介绍。刚开始一直以为MongoDB实现Streaming处理,可以自动执行增量式的MapReduce。最后发现原来是我理解有误,文档里并没有写这一点,只是说明了如何设置才能增量执行MapReduce。
为了方便,我把MapReduce使用MongoDB的JavaScript写在了单独的js文件中,然后通过crontab定时执行。stats.js的代码:
[javascript] view
plaincopyprint?
/************** The file is executed per 5 minutes by /etc/crontab.*****************/
var action_count_map = function(){
emit(this.action, {action:this.action, count:1});
}
var action_count_reduce = function(key, values){
var count = 0;
values.forEach(function(value){
count += value.count;
});
return {action:key, count : count};
}
db.log.mapReduce(action_count_map, action_count_reduce, {query : {'action_count' : {$ne:1}},out: {reduce:'action_count'}});
db.log.update({'action_count':{$ne:1}}, {$set:{'action_count':1}}, false, true);
思路很简单:
1. 在map中将每个action访问次数设为1
2. reduce中,统计相同action的访问次数
3. 执行mapReduce。指定了查询为‘action_count’不等于1,也就是没有执行过该统计;将结果存储在‘action_count’集合,并且使用reduce选项表示该结果集作为下次reduce的输入。
4. 在当前所有日志记录设置'action_count'的值为1,表示已经执行过该统计。不知道这种是否会造成没有还没有统计过的记录也被更新??望有经验的大侠赐教!
定时执行stats.js的shell:
[plain] view
plaincopyprint?
*/5 * * * * root cd /root/log; mongo localhost:27017/log stats.js
好了,这就是全部的代码,没有什么特别玄妙的地方,不过Node.js真的是个好东西。

相关文章推荐
- nodejs 操作mongodb插查删改
- PHP添加mongodb扩展
- MongoDB YUM 安装配置
- mongodb进阶三之mongodb管理
- mongodb的基本操作
- 操作4 mongodb备份脚本
- MongoDb环境搭建
- 操作3 mongodb和mysql 开启慢查询日志 ,以及mongodb从配置文件启动
- mongodb进阶二之mongodb聚合
- mongodb与spring集成案例
- 分享一段mysql,mongodb 实现LBS搜索的简单代码
- mongodb 的 scala 驱动 -> casbah
- MongoDB系列一(索引及C#如何操作MongoDB)
- MongoDB数据库导出导入迁移
- mongodb学习链接
- mongodb - 前端form表单数据传输,在保存和清除的数据格式的处理程序的 - 非递归
- mongoDB常用命令
- MongoDB基本命令用
- MongoDB多维数组的更新操作
- mongodb进阶一之高级查询