VS2013Z学习java插件
2015-06-05 22:02
447 查看
https://visualstudiogallery.msdn.microsoft.com/bc561769-36ff-4a40-9504-e266e8706f93
Syntax highlighting and brace matching
Outlining support for quickly collapsing classes and functions
Dropdown bars listing classes, enums, interfaces, fields, and methods within the current document
The latest version of this extension also includes an experimental project system and debugger for Java code. More information about these features is included below.
This extension is not meant to replace a full IDE, but has certainly helped when I wanted to quickly reference a Java source file while working within Visual Studio.
Support for multiple JVMs
Support for the 32- and 64-bit releases of the standard JDK 6 and 7 (HotSpot VM)
Support for the 32- and 64-bit releases of JRockit R28.x
Full support for “Java Runtime Environment” exceptions in the Debug → Exceptions dialog
Standard packages and exceptions are shown in the Java Runtime Environment category
Users can add their own exceptions by name
Users may select which exceptions the debugger should break on at the time they are thrown
Unhandled exceptions automatically trigger a breakpoint
When an exception is thrown, a message is printed to the output window (similar to the way it’s handled in C# debugging)
Standard (unconditional) breakpoints
Stepping in the editor
Step Into/Over/Out
The Step Over command steps over a statement – with proper support for multiple statements on a single line
Disassembly window
Shows JVM bytecode interleaved with the original source code
The Step Over command steps by bytecode instruction instead of by statement
Support for the Locals, Autos, and Watch windows
Support for the Immediate window
Support for pinnable data tips
Support for the Threads window
Support for user-friendly representation of collections (lists, maps, arrays, etc.)
We’ve been looking, but so far it seems that no current Java IDE can properly distinguish between multiple statements on a single line. We aim to change that.The image below shows a series of steps in the debugger (the Step Over command was executed exactly one time between each image). As you can see, our debugger follows the logical stepping sequence from the initializer to the condition of the
Here is an animated image showing a more complete example.

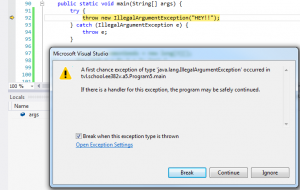
Handling behavior for exceptions may be configured by package or by individual exception type. The following example shows a user configuration requesting the debugger stop immediately when an

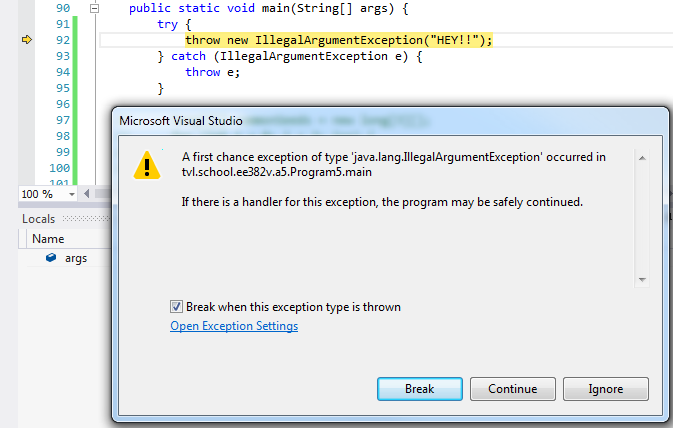
When an exception is thrown, the debugger first checks to see if the user has requested the debugger stop when the exception is thrown. In this case, we configured the debugger to stop when an
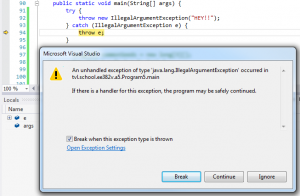
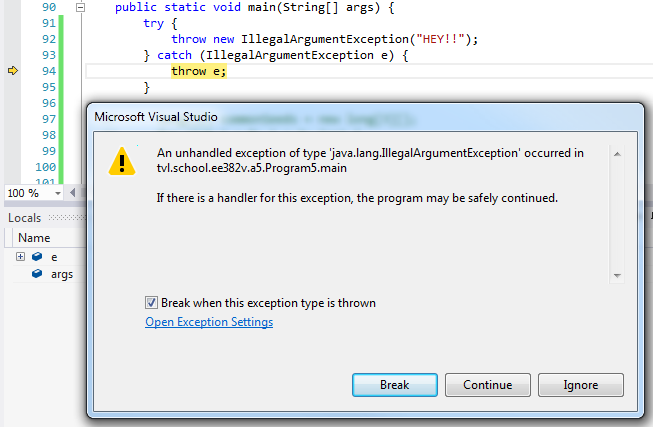
If an exception is thrown and no exception handler is available to handle the exception, the debugger stops immediately at the point the unhandled exception is thrown. The user does not need to specially configure the debugger to respond to this error case.
Moved the project to its own GitHub repository
Support Visual Studio 2015
Fixed many debugger bugs
See the release notes for additional information
Disable the Empty Project template since it isn't working properly
Stability improvements
Add Java project system, with support for building and debugging Java code
Support Visual Studio 2012 and Visual Studio 2013
Addressed several potential performance problems
Bugs and Feature Requests: Issue Tracker
This extension provides basic features for the Java programming language. Current editing features include:Syntax highlighting and brace matching
Outlining support for quickly collapsing classes and functions
Dropdown bars listing classes, enums, interfaces, fields, and methods within the current document
The latest version of this extension also includes an experimental project system and debugger for Java code. More information about these features is included below.
This extension is not meant to replace a full IDE, but has certainly helped when I wanted to quickly reference a Java source file while working within Visual Studio.
Debugger Support
Current features of the debugger include:Support for multiple JVMs
Support for the 32- and 64-bit releases of the standard JDK 6 and 7 (HotSpot VM)
Support for the 32- and 64-bit releases of JRockit R28.x
Full support for “Java Runtime Environment” exceptions in the Debug → Exceptions dialog
Standard packages and exceptions are shown in the Java Runtime Environment category
Users can add their own exceptions by name
Users may select which exceptions the debugger should break on at the time they are thrown
Unhandled exceptions automatically trigger a breakpoint
When an exception is thrown, a message is printed to the output window (similar to the way it’s handled in C# debugging)
Standard (unconditional) breakpoints
Stepping in the editor
Step Into/Over/Out
The Step Over command steps over a statement – with proper support for multiple statements on a single line
Disassembly window
Shows JVM bytecode interleaved with the original source code
The Step Over command steps by bytecode instruction instead of by statement
Support for the Locals, Autos, and Watch windows
Support for the Immediate window
Support for pinnable data tips
Support for the Threads window
Support for user-friendly representation of collections (lists, maps, arrays, etc.)
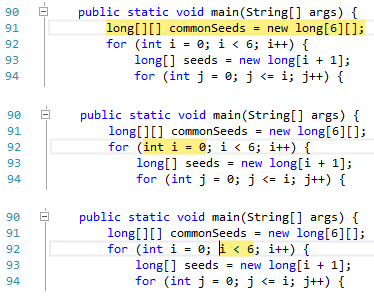
Stepping over statements
In our opinion, this is hands-down the coolest feature of our debugger.We’ve been looking, but so far it seems that no current Java IDE can properly distinguish between multiple statements on a single line. We aim to change that.The image below shows a series of steps in the debugger (the Step Over command was executed exactly one time between each image). As you can see, our debugger follows the logical stepping sequence from the initializer to the condition of the
forstatement.
Here is an animated image showing a more complete example.
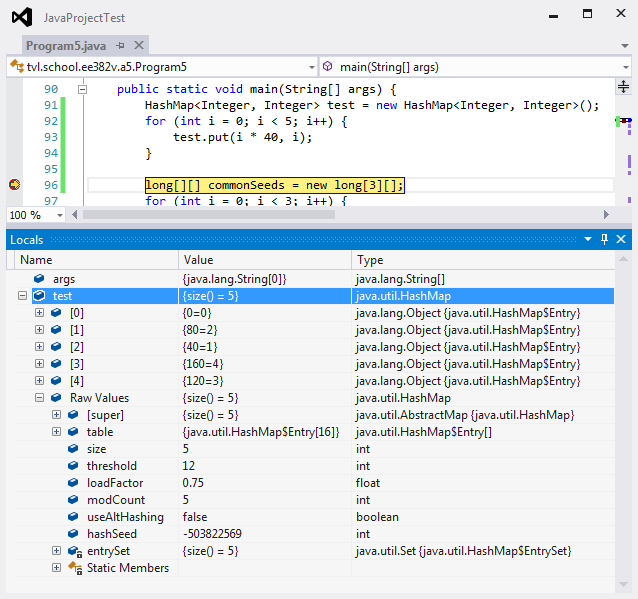
Intuitive display of collections without hiding data
The debugger provides special handling for arrays and classes implementingCollection,
Map, and a few other interfaces. To ensure that the debugger doesn’t restrict access to information you need, a special Raw Values property is provided which the user can expand to see the object’s true internal structure. Direct access to the Static Members of classes is provided as well (standard for all classes).
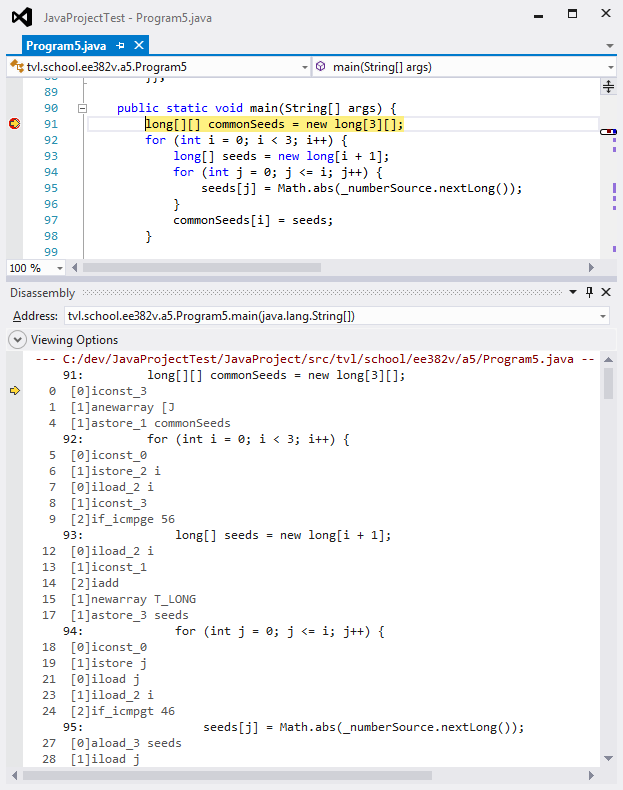
Bytecode disassembly
Curious about what your code is compiling to? The disassembly window fully supports Java bytecode while debugging your program.Exceptions
The Java debugger extends the Debug → Exceptions window with support for Java Runtime Environment exceptions.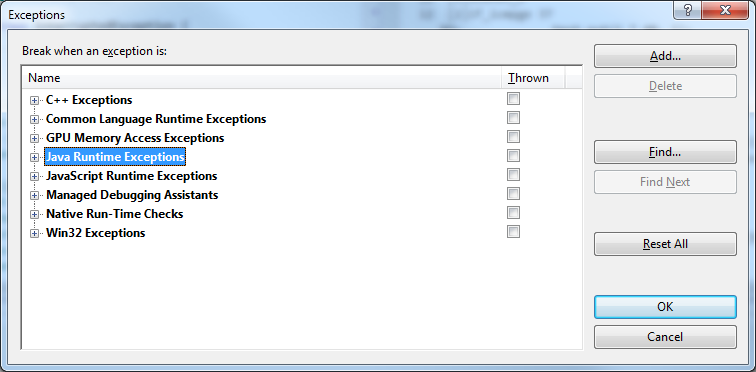
Handling behavior for exceptions may be configured by package or by individual exception type. The following example shows a user configuration requesting the debugger stop immediately when an
IllegalArgumentExceptionis thrown.
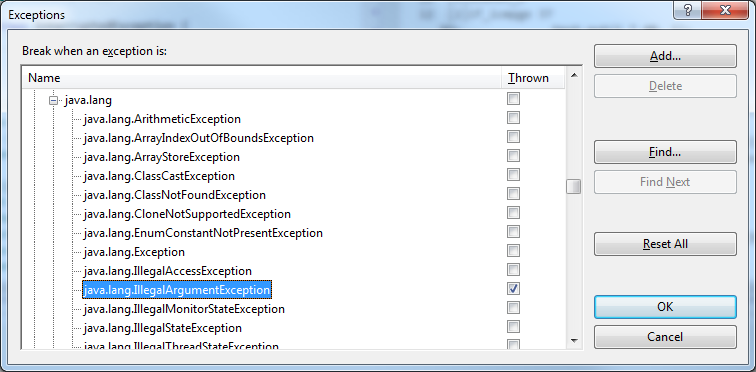
When an exception is thrown, the debugger first checks to see if the user has requested the debugger stop when the exception is thrown. In this case, we configured the debugger to stop when an
IllegalArgumentExceptionis thrown, whether or not a
catchstatement is available to handle the exception.
If an exception is thrown and no exception handler is available to handle the exception, the debugger stops immediately at the point the unhandled exception is thrown. The user does not need to specially configure the debugger to respond to this error case.
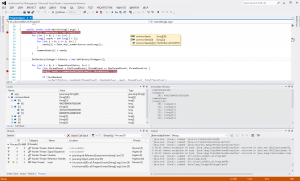
Debugger tool windows
The following image shows the contents of many (but not all) of the currently supported debugger windows in Visual Studio.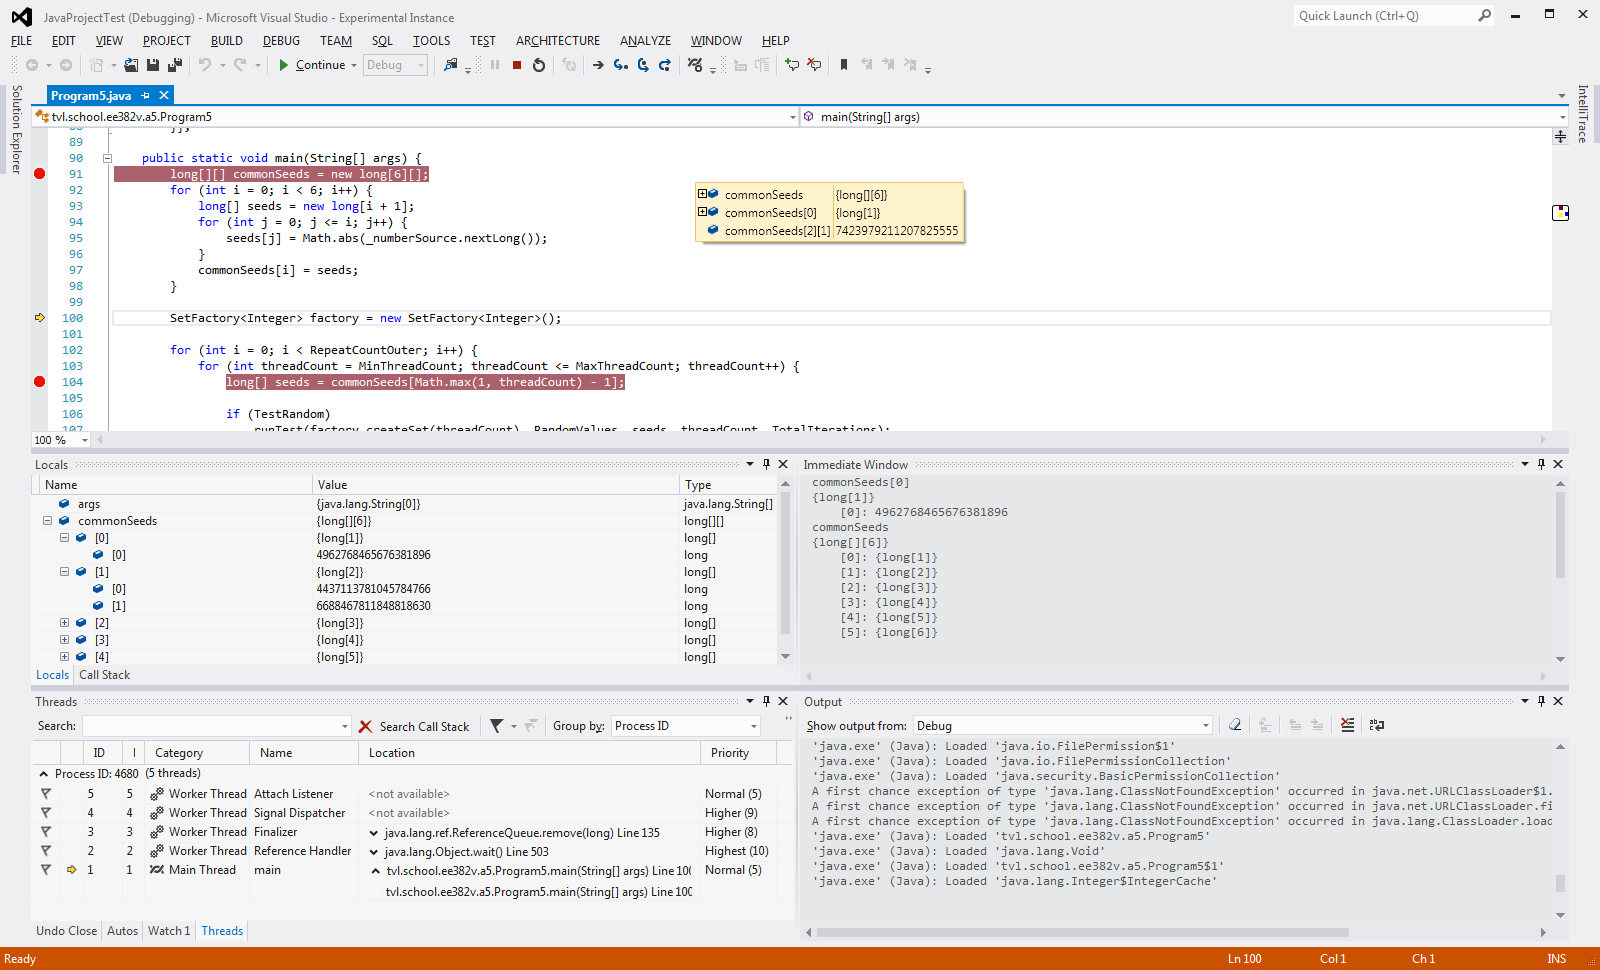
Version History
1.2.0 (April 25, 2015)
This should be considered a preview release of the new features of this extension.Moved the project to its own GitHub repository
Support Visual Studio 2015
Fixed many debugger bugs
See the release notes for additional information
1.1.0 (March 16, 2014)
This should be considered an early preview release of the new features of this extension.Disable the Empty Project template since it isn't working properly
Stability improvements
1.0.8 (February 20, 2014)
This should be considered an early preview release of the new features of this extension.Add Java project system, with support for building and debugging Java code
Support Visual Studio 2012 and Visual Studio 2013
1.0.6.318 (July 9, 2011)
Add syntax highlighting for Javadoc commentsAddressed several potential performance problems
1.0.5.311 (July 8, 2011)
Original release
相关文章推荐
- 转载: java的接口、类、属性、方法各有哪些修饰符
- Java模拟抢红包应用
- [Java] Webservice之即时发布JWS教程 (一)
- Eclipse中查看android-support-v4 API
- Java异常的处理
- 监听器和接口的使用(总结)学习java第四天
- [置顶]1244-作为一个java开发者的知识储备
- Structs 整合Spring
- "XX cannot be resolved to a type " eclipse报错及解决说明
- eclipse里不支持泛型的解决方法
- 【转载】补充myeclipse10 优化
- 【转】解决eclipse连接不到genymotion的问题
- java基础(十)--- 异常
- JDK动态代理和CGLIB动态代理+源码下载
- Spring 实现定时任务
- java开发工具快捷键使用大全(系列一)
- Java间隔计时触发器
- Mybatis-spring整合源码解析
- IOS 基于APNS消息推送原理与实现(JAVA后台)
- java中的匿名内部类总结