Python性能分析 (Profiling)
2014-11-06 17:29
351 查看
此页由Linux Wiki用户Chenxing于2012年3月21日 (星期三) 07:02的最后更改。
提示:此文已超过 2 年(960 天)未更新,如发现内容过时或有误,欢迎改进:)
性能分析(Profiling)可用于分析程序的运行时间主要消耗在何处,以便有效优化程序的运行效率。
Profiling可分为两步,一是运行程序收集程序不同部分运行时间的数据,二是数据的可视化和分析。

提示:
本文介绍的方法主要针对类Linux系统,部分工具在Windows等系统可能也能使用。
Python的cProfile模块可用于数据采集,适用于Python 2和Python 3。其调用方法很简单:
更多信息请参考Python
Profiler文档。
有些小程序也可以直接从命令行调用cProfile模块执行[1]:
hotshot是高性能的Profiling数据采集工具,其运行时对程序效率的影响很小,但会产生巨大的运行记录,分析也比较慢。[2] Python
3中没有hotshot。故如无特殊需求,请使用cProfile。
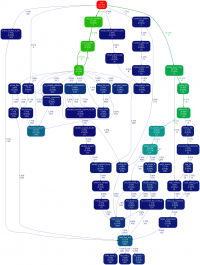

Gprof2Dot的输出,经dot命令渲染后的图片。
Gprof2Dot可将多种Profiler的数据转成Graphviz可处理的图像表述。配合dot命令,即可得到不同函数所消耗的时间分析图。以处理cProfile的记录为例[3]:

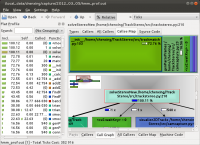
Run Snake Run截图
RunSnakeRun是个Python脚本,使用wxPython将Profiler数据可视化,效果如图。
RunSnakeRun还可分析内存占用,但仍处于实验阶段。[4]
KCacheGrind可视化Python运行时数据
KCacheGrind是Linux中常用的profiling visualization软件,其默认可处理valgrind的输出。通过一些脚本也可以让其分析cProfile或hotshot记录下的数据。
处理cProfile的数据可使用pyprof2calltree:
处理hotshot的数据可使用KCacheGrind中的hotshot2calltree命令:

注意:
KCacheGrind虽然功能强大,但其输出的分析树似乎并不完整,如果您了解原因,请补充。
↑ StackOverflow:
Using cProfile results with KCacheGrind
↑ Python官方文档:hotshot
↑ Gprof2Dot
↑ RunSnakeRun
提示:此文已超过 2 年(960 天)未更新,如发现内容过时或有误,欢迎改进:)
性能分析(Profiling)可用于分析程序的运行时间主要消耗在何处,以便有效优化程序的运行效率。
Profiling可分为两步,一是运行程序收集程序不同部分运行时间的数据,二是数据的可视化和分析。

提示:
本文介绍的方法主要针对类Linux系统,部分工具在Windows等系统可能也能使用。
[隐藏] |
Python Profiling数据采集
cProfile
Python的cProfile模块可用于数据采集,适用于Python 2和Python 3。其调用方法很简单:import cProfile
# 以下调用将运行函数somefunc(),并将相关数据记录到log_file.pyprof
cProfile.run('somefunc()', 'log_file.pyprof')更多信息请参考Python
Profiler文档。
有些小程序也可以直接从命令行调用cProfile模块执行[1]:
python -m cProfile -o profile_data.pyprof script_to_profile.py
hotshot
hotshot是高性能的Profiling数据采集工具,其运行时对程序效率的影响很小,但会产生巨大的运行记录,分析也比较慢。[2] Python3中没有hotshot。故如无特殊需求,请使用cProfile。
import hotshot
profiler = hotshot.Profile("hotshot.log")
profiler.run('trackStereo.solveStereoNew()')
数据可视化
Gprof2Dot

Gprof2Dot的输出,经dot命令渲染后的图片。
Gprof2Dot可将多种Profiler的数据转成Graphviz可处理的图像表述。配合dot命令,即可得到不同函数所消耗的时间分析图。以处理cProfile的记录为例[3]:
# 运行程序记录数据:
# python -m cProfile -o profile_data.pyprof path/to/your/script arg1 arg2

# profile_data.pyprof是获取的数据;dot命令需要安装Graphviz才能用
gprof2dot.py -f pstats profile_data.pyprof | dot -Tpng -o output.png
Run Snake Run

Run Snake Run截图
RunSnakeRun是个Python脚本,使用wxPython将Profiler数据可视化,效果如图。
RunSnakeRun还可分析内存占用,但仍处于实验阶段。[4]
KCacheGrind

KCacheGrind可视化Python运行时数据
KCacheGrind是Linux中常用的profiling visualization软件,其默认可处理valgrind的输出。通过一些脚本也可以让其分析cProfile或hotshot记录下的数据。
处理cProfile的数据可使用pyprof2calltree:
# 运行程序记录数据:
# python -m cProfile -o profile_data.pyprof path/to/your/script arg1 arg2

# 使用pyprof2calltree处理数据并自动调用KCacheGrind
pyprof2calltree -i profile_data.pyprof -k
处理hotshot的数据可使用KCacheGrind中的hotshot2calltree命令:
# 使用hotshot2calltree处理数据,完成后需手动在KCacheGrind中打开输出文件
hotshot2calltree hotshot.log -o hs_calltree.log

注意:
KCacheGrind虽然功能强大,但其输出的分析树似乎并不完整,如果您了解原因,请补充。
参考资料
↑ StackOverflow:Using cProfile results with KCacheGrind
↑ Python官方文档:hotshot
↑ Gprof2Dot
↑ RunSnakeRun

相关文章推荐
- Python性能分析 (Profiling)
- 关于Python Profilers性能分析器
- Mysql自带profiling性能分析工具使用分享
- Python程序的性能分析指南(2)
- 常用排序算法的python实现和性能分析
- 常用排序算法的python实现和性能分析
- python 程序的性能分析优化(huffman编码程序性能分析的一个小结论)
- 关于Python Profilers性能分析器
- 如何分析python程序的性能
- Python程序的性能分析指南(1)
- Python性能分析指南(未完成)
- 每天将MYSQL SLOW QUERY REPORT分发到各个邮箱供分析改善数据库性能-PYTHON
- Python 程序的性能分析
- Python性能分析指南 - 技术翻译 - 开源中国社区
- Python程序的性能分析指南
- Mysql中Profiling之性能分析
- python几个实际代码的性能分析
- Python程序的性能分析指南
- Python性能分析工具
- Python 性能分析入门指南