AWStats分析Nginx访问日志
2014-10-22 14:16
639 查看
AWStats是在Sourceforge上发展很快的一个基于Perl的WEB日志分析工具。
它可以统计您站点的如下信息:
访问量(UV),访问次数,页面浏览量(PV),点击数,数据流量等
精确到每月、每日、每小时的数据
访问者国家
访问者IP
Robots/Spiders的统计
访客持续时间
对不同Files type的统计信息
Pages-URL的统计
访客操作系统浏览器等信息
其它信息(搜索关键字等等)
下面是AWStats分析Nginx日志的操作步骤:
一、配置nginx日志格式
修改nginx.conf的日志格式,不然awstats无法分析。
改好后,使nginx重读配置文件:
每天晚上23点59分定时执行一个shell脚本来切割nginx日志。脚本内容如下:
进入/usr/local/awstats/tools/目录,执行配置脚本awstats_configure.pl:
程序执行结束后,会在/etc/awstats/目录下生成你的配置文件。然后编辑配置文件,修改LogFile参数,跟日志切割脚本中的日志路径对应起来:
测试:
五、配置awstats生成静态页面
利用awstats的工具将统计的结果生成静态文件:
设置crontab,每天凌晨00:01定时更新静态页面:
在nginx配置扩展目录(/etc/nginx/conf.d/)下新建awstats.conf配置文件,内容如下:
日志分析页面示例:
参考资料: http://baike.baidu.com/view/228748.htm?fr=aladdin http://www.ibm.com/developerworks/cn/linux/l-cn-awstats-nginx/(有些错误,已在本文中纠正)
本文出自 “启程的Linux博客” 博客,请务必保留此出处http://qicheng0211.blog.51cto.com/3958621/1566682
它可以统计您站点的如下信息:
访问量(UV),访问次数,页面浏览量(PV),点击数,数据流量等
精确到每月、每日、每小时的数据
访问者国家
访问者IP
Robots/Spiders的统计
访客持续时间
对不同Files type的统计信息
Pages-URL的统计
访客操作系统浏览器等信息
其它信息(搜索关键字等等)
下面是AWStats分析Nginx日志的操作步骤:
一、配置nginx日志格式
修改nginx.conf的日志格式,不然awstats无法分析。
log_format access '$remote_addr - $remote_user [$time_local] "$request" '
'$status $body_bytes_sent "$http_referer" '
'"$http_user_agent" "$http_x_forwarded_for"';
access_log /var/log/nginx/access.log access;
注意,日志格式里的双引号不能漏了且每个参数之间是一个空格分隔,因为只要有细微的差别,awstats就无法读取日志。
改好后,使nginx重读配置文件:
shell# nginx -t && nginx -s reload二、自动切割nginx日志
每天晚上23点59分定时执行一个shell脚本来切割nginx日志。脚本内容如下:
#!/bin/bash
#
# Filename:    nginxCutLog.sh
# Author:      Qicheng
# Website:     http://qicheng0211.blog.51cto.com/ # Description: 切割nginx日志
# Notes:       设置crontab,每天23点59分定时执行
#
ROOT_UID=0
if [ "$UID" -ne "$ROOT_UID" ];then
echo "Error: 必须以root用户运行此程序!"
exit 1
fi

nginx_logs_dir="/var/log/nginx"
nginx_pid_file="/var/run/nginx.pid"
# 切割后的日志文件名,例如access_20141022.log
nginx_log_today="$nginx_logs_dir/access_`date +%Y%m%d`.log"

while [ `date +%S` -ne 59 ];do
sleep 1
done
sleep 1
[ -f "$nginx_log_today" ] && exit 1
mv $nginx_logs_dir/access.log $nginx_log_today
# 给nginx发送USR1信号,使重新打开新的access.log日志文件
[ -f $nginx_pid_file ] && /bin/kill -USR1 $(cat $nginx_pid_file)
设置crontab:
59 23 * * * /bin/bash /yourscriptpath/nginxCutLog.sh三、安装awstats
shell# wget http://awstats.sourceforge.net/files/awstats-7.0.tar.gz shell# tar -zxvf awstats-7.0.tar.gz
shell# mv awstats-7.0 /usr/local/awstats
shell# mkdir -p /var/lib/awstats
四、配置awstats
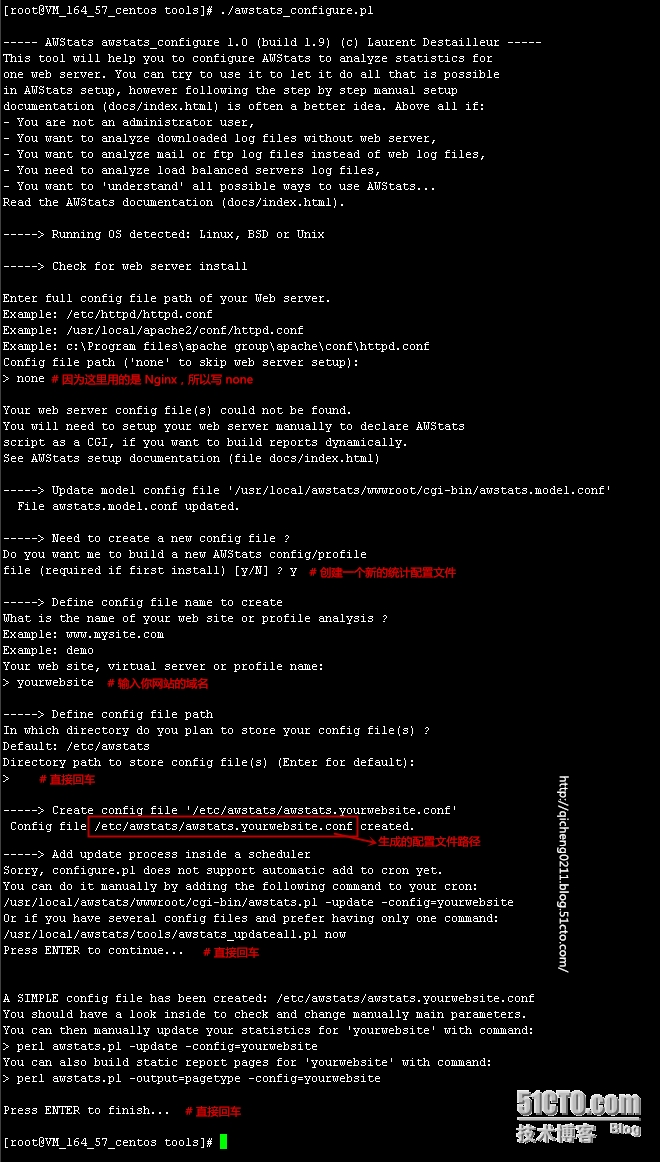
进入/usr/local/awstats/tools/目录,执行配置脚本awstats_configure.pl:
shell# cd /usr/local/awstats/tools/
shell# ./awstats_configure.pl
程序执行结束后,会在/etc/awstats/目录下生成你的配置文件。然后编辑配置文件,修改LogFile参数,跟日志切割脚本中的日志路径对应起来:
LogFile="/var/log/nginx/access_%YYYY-24%MM-24%DD-24.log"注意,这里日期格式“%YYYY-24%MM-24%DD-24”,是指24小时之前的年月日,也就是昨天的日期。
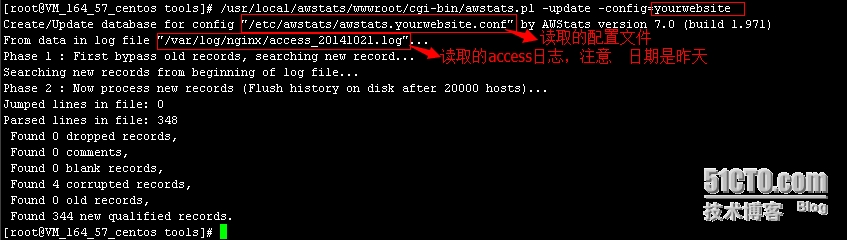
测试:
shell# /usr/local/awstats/wwwroot/cgi-bin/awstats.pl -update -config=yourwebsite注意:-config=后面的参数是你在执行awstats_configure.pl时输入的站点域名。
五、配置awstats生成静态页面
利用awstats的工具将统计的结果生成静态文件:
shell# mkdir -p /var/www/awstats
shell# /usr/local/awstats/tools/awstats_buildstaticpages.pl -update -config=yourwebsite -lang=cn -dir=/var/www/awstats -awstatsprog=/usr/local/awstats/wwwroot/cgi-bin/awstats.pl
注意:-config=后面的参数是你在执行awstats_configure.pl时输入的站点域名;-dir=是统计结果静态文件的输出目录。
设置crontab,每天凌晨00:01定时更新静态页面:
1 0 * * * /usr/local/awstats/tools/awstats_buildstaticpages.pl -update -config=yourwebsite -lang=cn -dir=/var/www/awstats -awstatsprog=/usr/local/awstats/wwwroot/cgi-bin/awstats.pl一般站长都不愿随便让人知道自己站的真实流量,所以要把awstats统计结果页面进行密码保护,这里需要用到apache自带的工具htpasswd:
shell# yum -y install httpd-tools
shell# htpasswd -cd admin.pass admin
New password:
Re-type new password:
Adding password for user admin
把生成的密码文件admin.pass放到nginx主配置目录下(/etc/nginx/)。
在nginx配置扩展目录(/etc/nginx/conf.d/)下新建awstats.conf配置文件,内容如下:
server {
listen 83;
server_name localhost;
location ~ ^/awstats/ { # html 静态页面目录
root /var/www;
index index.html;
access_log off;
error_log off;
charset gb2312;
auth_basic "admin";
auth_basic_user_file admin.pass;
}
location ~ ^/icon/ { # 图标目录
root /usr/local/awstats/wwwroot;
index index.html;
access_log off;
error_log off;
}
location / {
return 403;
}
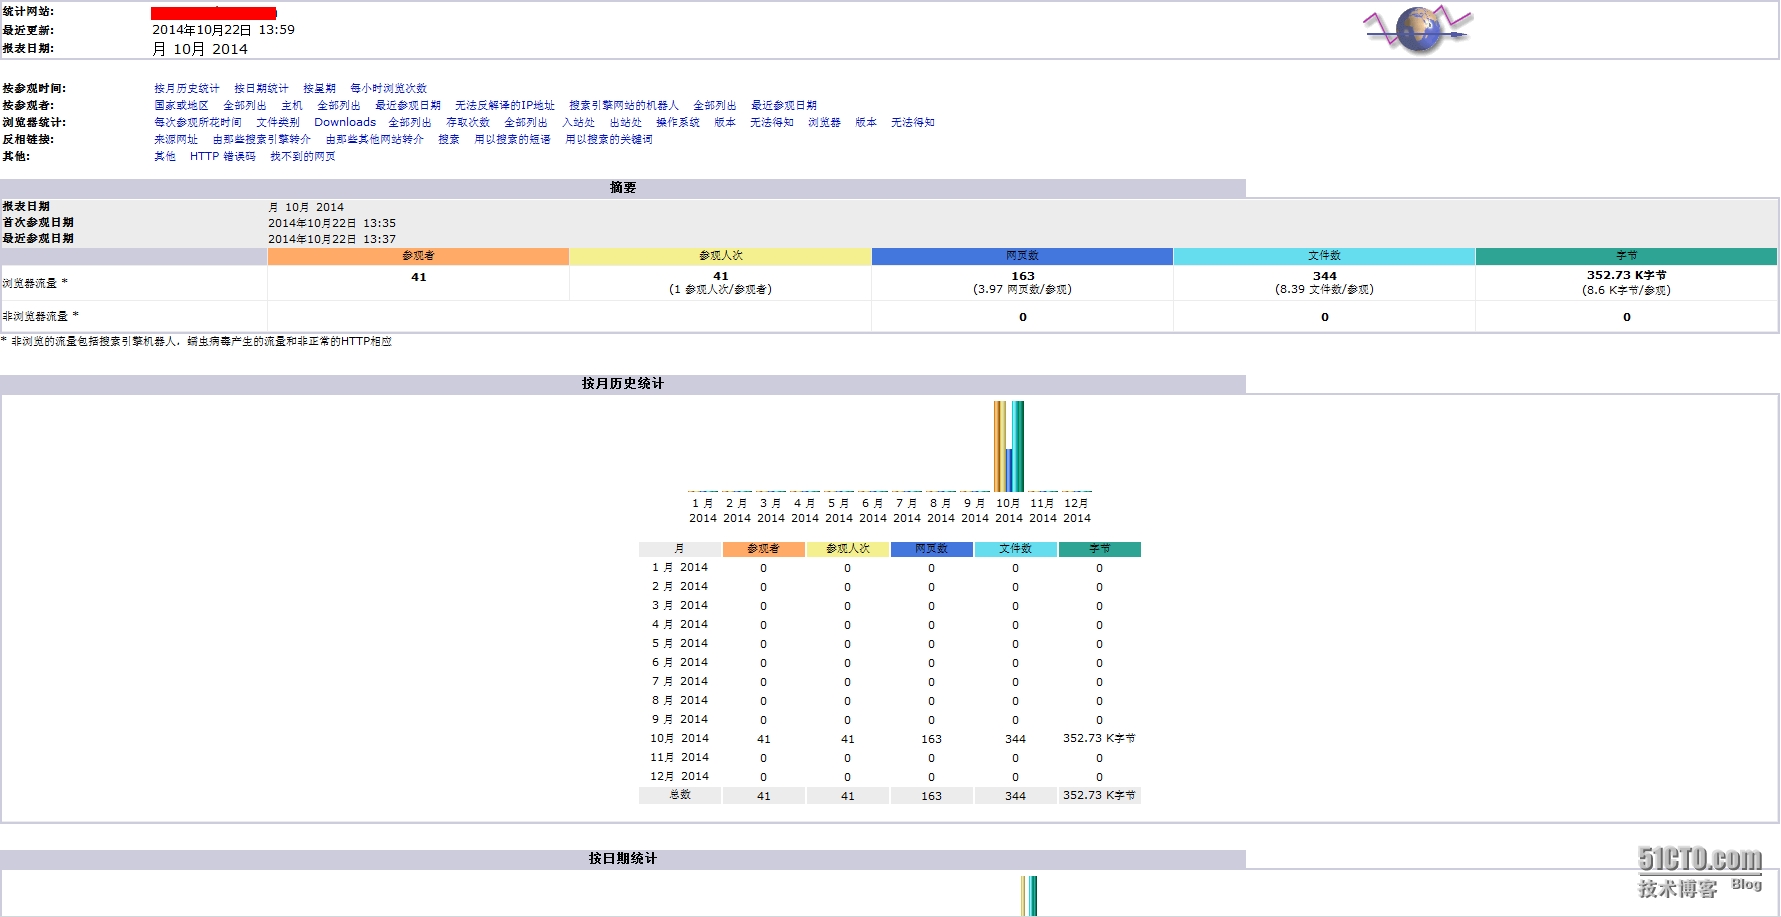
}最后使nginx重读配置文件,用浏览器查看统计结果 http://yourhostname:83/awstats/awstats.yourwebsite.html 日志分析页面示例:
参考资料: http://baike.baidu.com/view/228748.htm?fr=aladdin http://www.ibm.com/developerworks/cn/linux/l-cn-awstats-nginx/(有些错误,已在本文中纠正)
本文出自 “启程的Linux博客” 博客,请务必保留此出处http://qicheng0211.blog.51cto.com/3958621/1566682

相关文章推荐
- 使用 awstats 分析 Nginx 的访问日志
- 使用 awstats 分析 Nginx 的访问日志(IBM)
- 使用awstats分析Nginx的访问日志
- 使用 awstats 分析 Nginx 的访问日志
- awstats分析nginx日志访问404问题
- 使用awstats 分析 Nginx 的访问日志
- awstats 分析 Nginx 访问日志
- 使用 awstats 分析 Nginx 的访问日志
- 部署awstats分析nginx访问日志
- awstats访问日志分析-haproxy,nginx后端的tomcat access日志
- AWStats分析Nginx访问日志
- AWStats分析Tomcat\Apache\IIS\nginx 的访问日志
- 使用 awstats 分析 Nginx 的访问日志
- 使用 awstats 分析 Nginx 的访问日志
- 使用awstats分析Nginx的访问日志
- ubuntu 10.4.4 server下AWStats分析和查看Nginx的web访问日志
- 使用awstat分析Nginx的访问日志
- 笔记----windows下安装awstats来分析apache的访问日志
- 使用awstats自动分析Nginx日志(一)
- awstats分析nginx日志(简单配置)